Summary
Background:
Asymptomatic central nervous system involvement may occur in the early stages of the HIV infection. The aim of the study was to evaluate early brain metabolic changes by means of proton MR spectroscopy (H1MRS) in the HIV-1 seropositive patients without neurological deficits or significant abnormalities in the plain MR study.
Material/Methods:
The H1MRS examinations were performed with the use of a MR GE Signa 1,5T system. There were 39 subjects examined, aged 21 to 57 years (mean age 35 years) were examined, including 25 patients infected with HIV-1 and 14 healthy volunteers who constituted a control group. The examinations were performed using the Single Voxel Spectroscopy technique with the PRESS sequence, with following parameters: TR=1500 ms, TE=35 ms, number of acquisitions =128, time of acquisition =3 min. 43 sec. Voxels of 8 cm3 (20×20×20 mm) in size were located in the following 5 regions: posterior cingulate gyrus, grey matter of the frontal area, left basal ganglia, white matter of the left parietal area and white matter of the frontal area. The NAA/Cr, Cho/Cr, mI/Cr ratios in the defined regions of interest were statistically analyzed.
Results:
There was a statistically significant decrease (p<0.05) in the NAA/Cr ratios in the posterior cingulate area and white matter of the left parietal area in HIV-1 seropositive patients, as compared to the control group. Other metabolite ratios in all the above mentioned locations showed no statistically significant differences, as was also the case for NAA/Cr ratios in grey matter of the frontal area, left basal ganglia and white matter of the frontal area.
Conclusions:
The reduction of NAA/Cr values revealed in H1MRS studies suggests loss of neurons/neuronal activity in the posterior cingulate area and white matter of the left parietal area, in patients with HIV-1 at the stage before clinical manifestations of retroviral infection and structural changes in the plain MR study. This may reflect a direct neurotropic activity of HIV.
Keywords: HIV infection, brain, MR spectroscopy
Background
The involvement of the central nervous system in the development of human immunodeficiency virus (HIV) infection is often found as early as in the first stage of the disease [1–4]. In the initial phase, brain inflammation caused by the HIV is clinically asymptomatic [5,6], later leading to mild-to-advanced HIV-associated neurocognitive impairments (HNCIs) [7], and finally, in about 20% of patients, to dementia/encephalopathy in the course of HIV infection [5,8].
The exact causes of the dementive process in the course of HIV infection has not been fully understood [9]. Histopathological examinations showed that diffuse microglial aggregates containing HIV-infected multinucleated giant cells, become apparent at the early stage of the disease, both in the white and in the grey matter, while at the late stage, there is an abundant accumulation of HIV-infected macrophages in perivascular spaces, accompanied by multiple multinucleated giant cells, the “pallor” of the white matter and loss of cerebrocortical neurons [10,11].
White matter is most commonly the first to become damaged, followed by cerebral cortex [12]. In structural MR imaging, lesions within the brain and HIV-related encephalopathy at later stages of the infection are apparent as demyelination and brain atrophy areas, correlating with the results of autopsies [13]. On the other hand, there are no abnormalities in plain MR images at early stages of HIV infections.
The proton magnetic resonance spectroscopy (H1MRS) is a non-invasive method of investigating biochemical transformations within the brain. Reports published to date showed that metabolic changes in brain were visible on H1MRS already in the presence of minor motor deficits (MMDs) and with normal MRI images [14].
In this study, we used the H1MRS technique to analyze the metabolic composition of the brain tissue of patients without clinical manifestations of HIV-1 infection, previously subjected to neurological tests. Subjected to evaluation were the ratios of the N-acetylaspartate (NAA), choline (Cho) and myoinositol (mI) resonance signals compared to the creatine (Cr), which, being a metabolite of a relatively constant concentration, is commonly used as the reference for the remaining metabolites. In single voxel spectroscopy (SVS), the intensity values for the resonance signals are automatically generated for individual metabolites. N-acetylaspartate (NAA) is a marker for neurones/neuronal activity, choline (Cho) is a marker of cellular membrane metabolism, both in the myelin degradation phase and the cellular proliferation phase, myoinositol (mI) is a marker for glial cells, and creatine (Cr) is a marker for highly energetic transformations within the brain [15].
The aim of this work was to demonstrate the presence of early metabolic changes in the brain tissue of patients infected with HIV.
Material and Methods
The H1MRS examinations were performed with the use of a MR GE Signa 1.5 T system, using the PRESS sequence and a Single Voxel Spectroscopy (SVS) technique with a 20×20×20 mm (8 cm3) voxel size with the following parameters: TR=1500 ms, TE=35 ms, number of acquisitions =128, acquisition time =3 min. 43 sec. Automatic prescanning followed by shimming and suppression of water was performed before each PRESS sequence. The voxels were located in the following five regions: posterior cingulate gyrus, white matter of the left frontal region, grey matter of the frontal region, left basal ganglia, and white matter of the left parietal region. (Figures 1–5).
Figure 1.
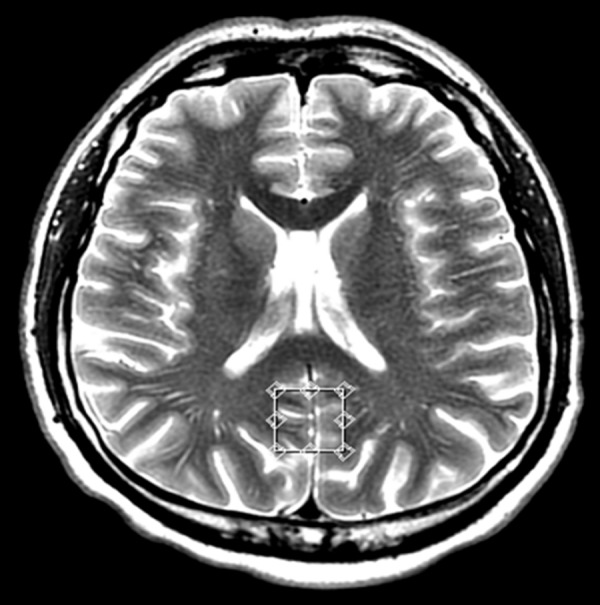
Voxel located in the posterior cingulate gyrus – transverse cross-section, T2-weighted image.
Figure 5.
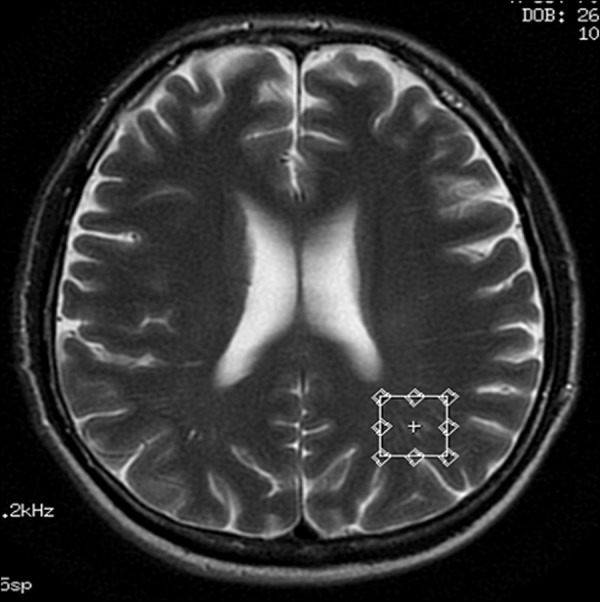
Voxel located in the white matter of the left parietal region – transverse cross-section, T2-weighted image.
Thirty-nine subjects aged 21 to 57 years (mean age 35 years) were examined, including 25 patients infected with HIV-1 and 14 healthy volunteers who constituted a control group (Table 1). Patients were referred from the Infectionus Diseases Outpatient Clinic of the Wroclaw Medical University. The patient group was selected after initial MRI scans were performed. The selected group consisted of HIV-1 seropositive, clinically asymptomatic.
Table 1.
Sex and age distribution in the study groups.
| Sex | Age range | Mean ± standard deviation | |
|---|---|---|---|
| HIV-1 seropositive group (N=15) | Females 5 Males 10 |
21–57 | 35.42±9.75 |
| Control group (N=14) | Females 5 Males 9 |
21–57 | 34.53±8.90 |
Statistical analysis of the ratios of resonance signals of N-acetylaspartate, choline and myoinositol in comparison to creatine (NAA/Cr, Cho/Cr, mI/Cr) was performed for the examined regions. The statistical software used was PASW Statistics 18.0. Kolmogorov-Smirnov test was used for evaluation of distribution normality of the studied variables. The significance of differences between the study groups was verified by a t-test for the dependent variable with normal distribution and after assumption of variance homogeneity.
Results
Statistically significant (p<0.05) reduction in NAA/Cr ratio in the HIV-1 seropositive patients compared to the control group was observed in the posterior cingulate gyrus and in the white matter of the left parietal lobe (Figures 6–9). Mean NAA/Cr value for the posterior cingulate gyrus was 1.60 in HIV-1 seropositive patients and 1.70 in healthy volunteers. In case of the parietal white matter, the mean NAA/Cr value was 1.84 in HIV-1 seropositive patients and 1.96 in healthy volunteers (Tables 2, 3). Levels of the remaining metabolites in all other locations, as well as the NAA/Cr ratios in the frontal white matter, in the frontal grey matter, and in the basal ganglia, showed no statistically significant differences between the study groups (Table 2).
Figure 6.
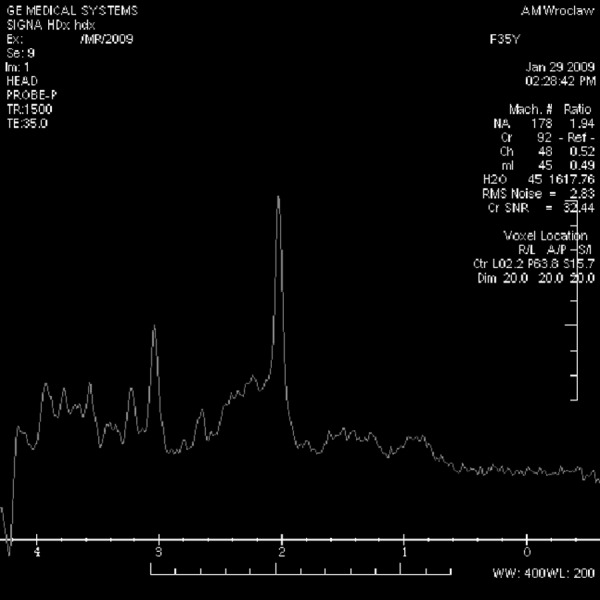
Spectrum of the posterior cingulate gyrus in a control-group patient.
Figure 9.

Spectrum of the parietal white matter in a HIV-seropositive patient.
Table 2.
Mean values and standard deviations (SD) of the marker/creatine ratios.
| Location | NAA/Cr | Cho/Cr | mI/Cr |
|---|---|---|---|
| mean (SD) | mean (SD) | mean (SD) | |
| PWM | |||
| Infected group | 1.84 (0.15) | 1.08 (0.13) | 0.68 (0.11) |
| Control group | 1.96 (0.12) | 1.05 (0.13) | 0.67 (0.09) |
| p=0.005 | p>0.05 | p>0.05 | |
| PCG | |||
| Infected group | 1.60 (0.12) | 0.59 (0.05) | 0.58 (0.05) |
| Control group | 1.70 (0.11) | 0.57 (0.07) | 0.60 (0.06) |
| p=0.016 | p>0.05 | p>0.05 | |
| FWM | |||
| Infected group | 1.74 (0.31) | 1.04 (0.21) | 0.64 (0.11) |
| Control group | 1.69 (0.18) | 1.02 (0.21) | 0.66 (0.07) |
| p>0.05 | p>0.05 | p>0.05 | |
| FGM | |||
| Infected group | 1.54 (0.20) | 0.80 (0.15) | 0.70 (0.14) |
| Control group | 1.62 (0.18) | 0.86 (0.19) | 0.71 (0.12) |
| p>0.05 | p>0.05 | p>0.05 | |
| LBG | |||
| Infected group | 1.53 (0.20) | 0.77 (0.11) | 0.53 (0.10) |
| Control group | 1.59 (0.20) | 0.77 (0.12) | 0.52 (0.11) |
| p>0.05 | p>0.05 | p>0.05 |
PWM – parietal white matter, PCG – posterior cingulate gyrus, FWM – frontal white matter, FGM – frontal grey matter, LBG – left basal ganglia.
Table 3.
Percentage difference of mean brain metabolite ratios between study groups.
| Control group | Infected group | Difference (%) | |
|---|---|---|---|
| NAA/Cr PCG | 1.70 | 1.60 | −5.9 |
| PWM | 1.96 | 1.84 | −6.12 |
| Cho/Cr PCG | 0.57 | 0.59 | +3.5 |
| PWM | 1.05 | 1.08 | +2.86 |
| mI/Cr PCG | 0.60 | 0.58 | −3.33 |
| PWM | 0.67 | 0.68 | +1.49 |
PCG – posterior cingulate gyrus; PWM – parietal white matter.
Discussion
Inflammatory brain lesions resulting from HIV-1 infection are probably caused by infected monocytes/macrophages and T cells crossing the blood-brain barrier [9]. Numerous studies were performed using the H1MRS technique in the evaluation of metabolic brain changes in patients with clinical symptoms of HIV infections, at advanced stages of the disease and encephalopathy, in the course of the HIV infection [7,16–23]. In the majority of studies there was a decrease in the NAA/Cr ratio, a slight increase in the Cho/Cr ratio and an increase in the mI/Cr ratio, as compared to the control group [7,16–19,24]. An increase in myoinositol levels and mI/Cr ratio was also observed at early stages of the disease with moderate neurocognitive impairment [14,25]. There were only several reports, based on a limited patient material, regarding HIV infection in clinically asymptomatic individuals. They showed a decrease in NAA/Cr; however, the results were not clinically significant [16–18,23,24,26–28]. In one study, however, statistically significant results were also obtained, such as NAA/Cr ratios amounting to 1.28 in HIV-seropositive patients (compared to 1.53 in the control group) for the white matter and to 1.19 (compared to 1.38 in the control group) for the grey matter [9].
In our study, we compared the metabolic changes in the brain in clinically asymptomatic HIV-infected patients and in the control group of healthy volunteers in a similar age range, – of 21 to 57 years. The age distribution in both study groups was normal, with similar mean and standard deviation values, which allowed for minimization of the effects of age-dependent differentiation in brain metabolite concentrations. We observed a statistically significant decrease in the NAA/Cr ratio in the white matter of the left parietal lobe and in the grey matter of posterior cingulate gyrus, as compared to the control group (Table 3). The reduction in NAA/Cr ratio suggests a neuronal activity impairment/neuronal loss at the early stage of HIV infection, with a normal image in the structural MRI examination. The lack of statistically significant differences in the NAA/Cr ratio of the remaining locations may result from the artefacts originating from adjacent bone structures and frontal sinuses and from a lower signal/noise ratio (SNR) in the frontal grey matter, frontal white matter and basal ganglia. Similarly to previous reports, we found a slightly higher reduction in the NAA/Cr ratio in the white matter compared to the grey matter, which is in line with histopathological results [12].
Conclusions
The reduction of NAA/Cr ratio observed in the H1MRS examination suggests a direct neurotropic activity of the HIV virus, resulting in neuronal activity impairment/neuronal loss in left parietal region and posterior cingulate gyrus. H1MRS examinations in clinically asymptomatic HIV-1 seropositive patients may contribute important information regarding the preclinical stage of the disease and may be helpful for clinicians making decisions regarding the appropriateness of early introduction of antiretroviral treatment.
Figure 2.
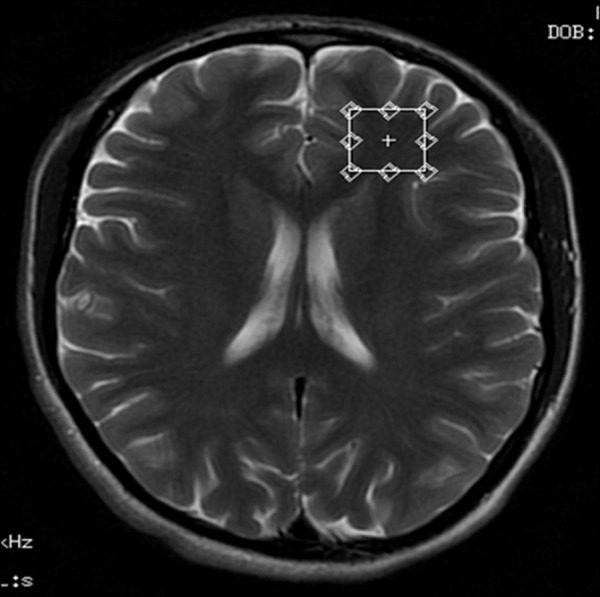
Voxel located in the left frontal white matter region – transverse cross-section, T2-weighted image.
Figure 3.

Voxel located in the grey matter of the frontal region – transverse cross-section, T2-weighted image.
Figure 4.
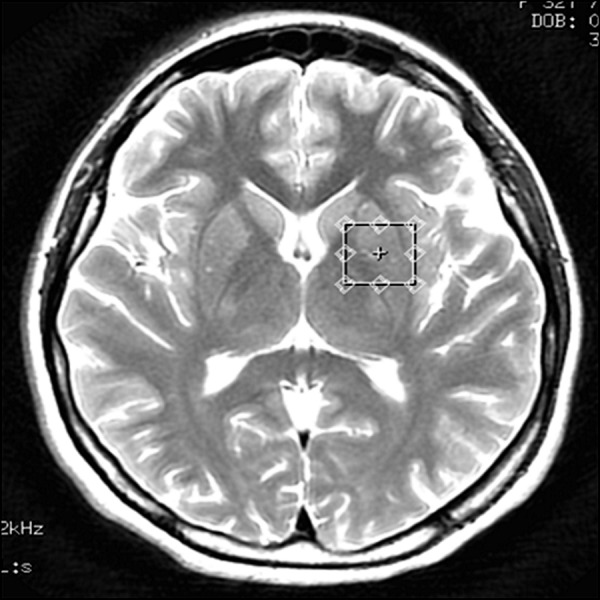
Voxel located in the left basal ganglia – transverse cross-section, T2-weighted image.
Figure 7.

Spectrum of the posterior cingulate gyrus in a HIV-seropositive patient.
Figure 8.

Spectrum of the parietal white matter in a control-group patient.
References:
- 1.Carne CA, Tedder RS, Smith A, et al. Acute encephalopathy coincident with seroconversion for anti-HTLV-III. Lancet. 1985;2:1206–8. doi: 10.1016/s0140-6736(85)90740-8. [DOI] [PubMed] [Google Scholar]
- 2.Resnick I, Berger JR, Shapsak P, Tourtellotte WW. Early penetration of the blood-brain barier by HIV. Neurology. 1988;38:9–14. doi: 10.1212/wnl.38.1.9. [DOI] [PubMed] [Google Scholar]
- 3.McDonald I, Weber J. HIV and nervous system. AIDS. 1989;3:465–67. doi: 10.1097/00002030-198907000-00014. [DOI] [PubMed] [Google Scholar]
- 4.Levy JA. Human Immunodeficiency Virus and the pathogenesis of AIDS. JAMA. 1989;261:299–306. [PubMed] [Google Scholar]
- 5.Navia B, Jordan B, Price R. The AIDS dementia complex: I. Clinical features. Ann Neurol. 1986;19:517–24. doi: 10.1002/ana.410190602. [DOI] [PubMed] [Google Scholar]
- 6.Grant I, Atkinson J, Hesseling J. Evidence for early central nervous system involvement in the acquired immunodeficiency virus (HIV) infections. Ann Intern Med. 1987;107:828–36. doi: 10.7326/0003-4819-107-6-828. [DOI] [PubMed] [Google Scholar]
- 7.Chang L. In vivo magnetic resonance spectroscopy in HIV and HIV-related brain diseases. Rev Neurosci. 1995;6:365–78. doi: 10.1515/revneuro.1995.6.4.365. [DOI] [PubMed] [Google Scholar]
- 8.McArthur JC, Cohen BA, Selnes OA, et al. Low prevalence of neurological and neuropsychological abnormalities in otherwise healthy HIV-1 infected individuals: result from the Multicenter AIDS Cohort study. Ann Neurol. 1989;26:601–11. doi: 10.1002/ana.410260504. [DOI] [PubMed] [Google Scholar]
- 9.Suwanwela N, Phanuphak P, Phanthumchinda K, et al. Magnetic resonance spectroscopy of the brain in neurologically asymptomatic HIV-infected patients. Magnetic Resonance Imaging. 2000;18:859–65. doi: 10.1016/s0730-725x(00)00173-9. [DOI] [PubMed] [Google Scholar]
- 10.Budka H. Neuropathology of human immunodeficiency virus infection. Brain Pathol. 1991;1:163–75. doi: 10.1111/j.1750-3639.1991.tb00656.x. [DOI] [PubMed] [Google Scholar]
- 11.Everall IP, Luthert PJ, Lantos P. Neuronal loss in the frontal cortex in HIV infection. Lancet. 1991;337:1119–21. doi: 10.1016/0140-6736(91)92786-2. [DOI] [PubMed] [Google Scholar]
- 12.Budka H, Wiley CA, Kleihues P, et al. HIV-associated disease of the nervous system. Review of nomenclature and proposal for neuropathology-based terminology. Brain Pathol. 1991;1:143–52. doi: 10.1111/j.1750-3639.1991.tb00653.x. [DOI] [PubMed] [Google Scholar]
- 13.Chrysikopolous HS, Press GA, Grafe MR, et al. Encephalitis caused by human immunodeficiency virus: CT and MR imaging manifestations with clinical and pathologic correlation. Radiology. 1990;175:185–91. doi: 10.1148/radiology.175.1.2315479. [DOI] [PubMed] [Google Scholar]
- 14.Wenserski F, Giesen HJ, Aulich A, Arendt G. Human Immunodeficiency Virus 1-associated Minor Motor Disorders: Perfusion – weighted MR Imaging and H1MR Spectroscopy. Radiology. 2003;228:185–92. doi: 10.1148/radiol.2281010683. [DOI] [PubMed] [Google Scholar]
- 15.Gujar SK, Maheshwari S, Björkman-Burtscher I, Sundgren PC. Magnetic Resonance Spectroscopy. J Neuro-Ophtalmol. 2005;25:217–26. doi: 10.1097/01.wno.0000177307.21081.81. [DOI] [PubMed] [Google Scholar]
- 16.Laubenberger J, Haussinger D, Bayer S, et al. HIV-related metabolic abnormalities in the brain: Depiction with proton MR spectroscopy with short echo times. Radiology. 1996;199:805–10. doi: 10.1148/radiology.199.3.8638009. [DOI] [PubMed] [Google Scholar]
- 17.Jarvik JC, Lenkinski RE, Grossman RI, et al. Proton MR spectroscopy of HIV infected patients: characterization of abnormalities with imaging and clinical correlation. Radiology. 1993;186:739–44. doi: 10.1148/radiology.186.3.8430182. [DOI] [PubMed] [Google Scholar]
- 18.Chong WK, Sweeney BJ, Wilkinson ID, et al. Proton spectroscopy of the brain in HIV infection: correlation with clinical, immunologic, and MR imaging findings. Radiology. 1993;188:119–24. doi: 10.1148/radiology.188.1.8099750. [DOI] [PubMed] [Google Scholar]
- 19.Meyerhoff DJ, MacKay S, Bachman L, et al. Reduced brain N-acetyl aspartate suggests neuronal loss in cognitively impaired human immunodeficiency virus – seropositive individuals: in vivo 1H magnetic resonance spectroscopic imaging. Neurology. 1993;43:509–15. doi: 10.1212/wnl.43.3_part_1.509. [DOI] [PubMed] [Google Scholar]
- 20.Meyerhoff DJ, MacKay S, Bachman L, et al. N-acetyl aspartate reductions measured by 1H MRS in cognitively impaired HIV – seropositive individuals. Magn Reson Imaging. 1994;12:653–59. doi: 10.1016/0730-725x(94)92460-0. [DOI] [PubMed] [Google Scholar]
- 21.Confort-Gouny S, Vion-Dury J, Nicoli F, et al. Localized brain proton MR spectroscopy metabolic patterns in HIV related encephalopathies. J Neurol Sci. 1993;118:123–33. [Google Scholar]
- 22.Chang L, Ernst T, Leonido-Yee M, et al. Cerebral metabolite abnormalities correlate with clinical severity of HIV-1 cognitive motor complex. Neurology. 1999;52:100–8. doi: 10.1212/wnl.52.1.100. [DOI] [PubMed] [Google Scholar]
- 23.Jarvik JC, Lenkinski RE, Saykin AJ, et al. Proton spectroscopy in asymptomatic HIV-infected adults: initial results in a prospective cohort study. J Acquir Immune Defic Syndr Hum Retrovirol. 1996;13:247–53. doi: 10.1097/00042560-199611010-00006. [DOI] [PubMed] [Google Scholar]
- 24.Tracey I, Carr CA, Guimaraes AR, et al. Brain choline-containing compounds are elevated in HIV-positive patients before the onset of AIDS dementia complex: A proton magnetic resonance spectroscopic study. Neurology. 1996;46:783–88. doi: 10.1212/wnl.46.3.783. [DOI] [PubMed] [Google Scholar]
- 25.Hurley RA, Hayman LA, Taber KH. Identification of HIV-Associated Progressive Multifocal Leukoencephalopathy: Magnetic Resonance Imaging and Spectroscopy. J neuropsychiatry Clin Neurosci. 2003;15:1–6. doi: 10.1176/jnp.15.1.1. [DOI] [PubMed] [Google Scholar]
- 26.Chong WK, Paley M, Wilkinson ID, et al. Localized proton MR spectroscopy in HIV infection and AIDS. AJNR. 1994;15:21–25. [PMC free article] [PubMed] [Google Scholar]
- 27.Paley M, Alonso J, Cozzone PJ, et al. A multi-centre proton magnetic resonance spectroscopy study of neurological complications of AIDS. AIDS Res Hum Retrovirus. 1996;12:213–22. doi: 10.1089/aid.1996.12.213. [DOI] [PubMed] [Google Scholar]
- 28.Harrison MJG, Newman SP, Hall-Craggs MA, et al. Evidence of CNS impairment in HIV infection: clinical, neuropsychological, EEG, and MRI/MRS study. J Neurol Neurosurg Psychiatry. 1998;65:301–7. doi: 10.1136/jnnp.65.3.301. [DOI] [PMC free article] [PubMed] [Google Scholar]


