Summary
Background:
Acute Wallerian degeneration following infarction has been show to result in areas of restricted diffusion within the brain. Very few reports describe this appearance in middle cerebellar peduncles.
Case Report:
A 37 year old woman was admitted to hospital following sudden collapse and was subsequently found to have a pontine infarct. The complex clinical course resulted in MR imaging including DWI at day 4, 9 and 23 after the initial presentation. The cerebellar peduncles were normal when imaged on day 4 and 9. At day 23, symmetrical high T2 signal was seen in both cerebellar peduncles. The DWI illustrated high signal with corresponding low signal on the ADC map consistent with restricted diffusion. We discuss why this appearance is in keeping with Wallerian degeneration and also describe the fibre pathways involved.
Conclusions:
Symmetrical high signal with restricted diffusion in the middle cerebellar peduncles following a pontine lesion is almost certainly attributable to Wallerian degeneration and should not be mistaken for a new ischaemia.
Keywords: MRI, DWI, Wallerian degeneration, middle cerebellar peduncle, transverse pontocerebellar fibres
Background
Wallerian degeneration is the process of axonal degeneration distal to injury of the neuronal cell body or proximal axon. The term initially described lesions of peripheral nerves, but now encompasses the central nervous system when the degeneration affects fibre tracts. The most common cause of Wallerian degeneration is cerebral infarction but haemorrhage, neoplasm, trauma, white matter disorders and multi-system atrophy can also result in degeneration.
Wallerian degeneration is most frequently observed in the corticospinal tract following infarction of the motor cortex or internal capsule [1]. Standard MR and diffusion weighted imaging (DWI) depict Wallerian degeneration when sufficiently large bundles of fibres are involved [2]. Wallerian degeneration of other projecting systems such as the optic radiation, corpus callosum, spinal cord and limbic system depicted on MR imaging has also been described [3,4]. In addition a handful of reports have described the MR findings of Wallerian degeneration in the middle cerebellar peduncles following pontine infarction [5–9]. Three reports describe their DWI findings in Wallerian degeneration of the middle cerebellar peduncles, all of which are imaged after a long interval from symptom onset (3, 4 and 8 months) [5,6,8]. Our case is unique in that MR with DWI was performed on day 4, 9 and 23 after the onset of the first symptoms following a pontine stroke. It reveals acute Wallerian degeneration of the middle cerebral peduncles with evidence of restricted diffusion, which has not been previously illustrated. It also highlights the point that not all abnormalities with restricted diffusion in a patient with ischaemic disease are further infarcts.
Case Report
A 37-year-old woman presented to her local hospital with a sudden onset of occipital headache and collapse. She had a past history of migraine, but no other medical problems. Prior to admission she had vomited, had a period of amnesia and was having difficulty communicating. On admission she had a CT scan of the brain, which was unremarkable. A lumbar puncture was performed which showed the presence of red cells. The sample was too small to perform spectroscopy for xanthochromia. She was transferred to the regional neurosciences centre for further assessment of a suspected subarachnoid haemorrhage, 3 days after the onset of her symptoms.
A cerebral angiogram was performed on day 4. This revealed a focal abnormality of the base of the basilar artery consistent with a vertebro-basilar dissection. CT of the head was subsequently repeated which showed a low attenuation lesion in the right side of the pons with a hyperdense basilar artery consistent with thrombus. No acute haemorrhage was seen.
MR was performed which showed reduced flow in the vertebro-basilar circulation and a vertebral dissection. The right side of the pons showed high T2-weighted signal. Restricted diffusion was apparent with high signal on the B1000 DWI and corresponding low signal on the apparent diffusion co-efficient (ADC) map in keeping with an acute infarct. The cerebellar peduncles were normal. At this time, the patient had pupillary asymmetry, a slight cerebellar dysarthria and mild left arm ataxia, but was otherwise neurologically intact. In view of the dissection intravenous heparin was commenced.
On day 8, the patient’s condition suddenly deteriorated. She was unable to communicate, had reduced power and a 6th nerve palsy. Over the course of an hour, she lost power in all limbs and developed decerebrate posturing. The IV heparin was stopped and a repeat CT of the head was performed for suspected dissection extension or haemorrhage. This again showed a hyperdense basilar artery and pontine infarction unchanged from the previous imaging.
The patient’s conscious level continued to fluctuate; at best she was moving her eyes to command, at worst her GCS was 3/15. Over the next 90 minutes a gradual tetraparesis and mutism developed with episodes of agitation. By the next morning the patient was completely locked in; she could only communicate with eye blinking, but had some preserved upward gaze. A repeat MR (day 9) showed more extensive high T2 weighted signal in the pons with restricted diffusion (Figure 1A). The cerebellar peduncles were also normal at this time (Figure1B). The pons still showed restricted diffusion (Figure 2A,B). Intra-arterial thrombolysis was considered but it was felt to be of limited value in continued extensive dissection with thrombosis as opposed to thrombo-embolic disease in a normal vessel. The evidence for stenting the basilar artery was weak at this time and on balance it was decided that this may risk further damage to the perforators and had a potential risk of fatal haemorrhage into the infarcted pons.
Figure 1A,B.
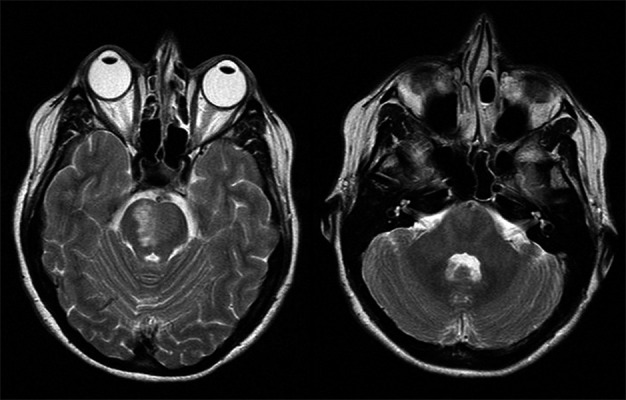
T2 weighted MR showing high signal in the pons and normal cerebellar peduncles (day 9).
Figure 2A,B.
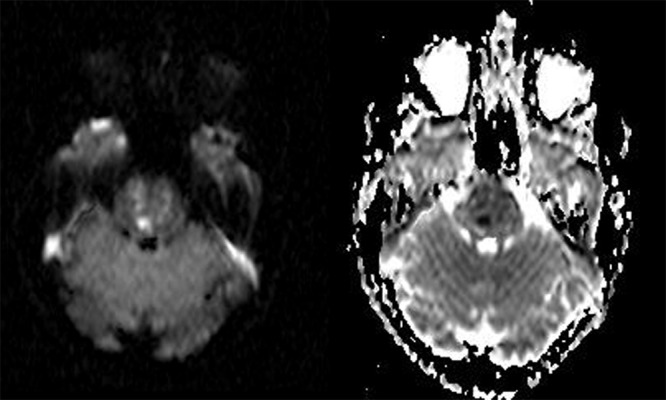
DWI and ADC map showing restricted diffusion within the pons following the infarction (day 9).
The subsequent clinical course was complicated with respiratory failure from a chest infection. On day 23 another MR was performed to examine the extent of infarct and to determine if there was persistent thrombus in the basilar artery to guide anti-coagulation therapy. The patient’s neurological status was stable at this stage.
The MR showed maturation of the infarct within the upper pons and inferior midbrain (Figure 3A). The diffusion weighted sequences demonstrated higher ADC values then when compared to the previous imaging indicating sub acute changes (Figure 4A,B). In addition there now was new symmetrical increased signal in both middle cerebellar peduncles on T2 weighted imaging (Figure 3B). These areas were of high signal on DWI with a corresponding low calculated ADC values (Figure 5A,B). Although no histological data is available, we consider these appearances were likely to represent restricted diffusion as a result of ongoing Wallerian degeneration, rather than infarction.
Figure3.
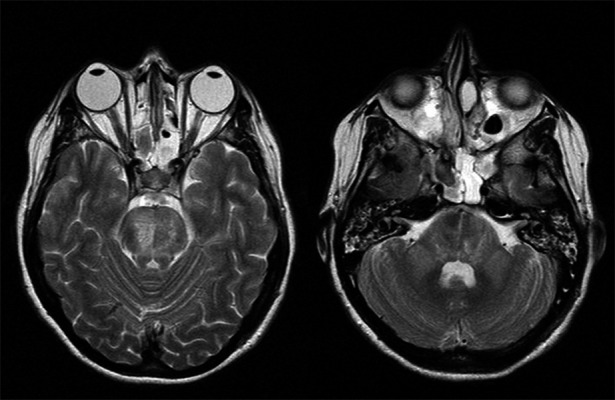
(A) T2 weighted imaging shows more extensive high signal abnormality consistent with maturation of the infarct. (B) T2 weighted MR showing bilateral symmetrical high signal in both cerebellar peduncles (day 23).
Figure 4A,B.
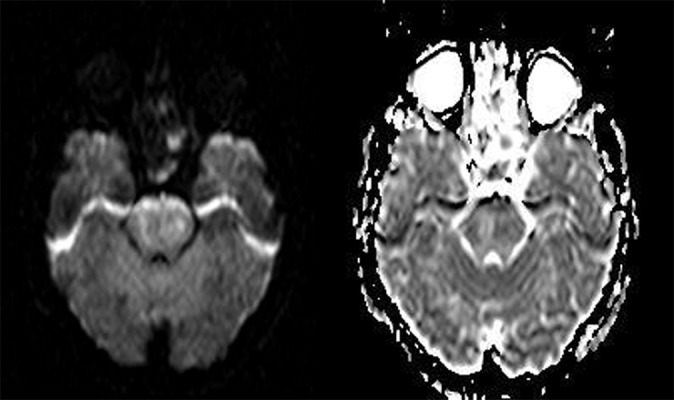
DWI and ADC map showing subacute infarction in the pons with an increase in ADC values (day 23).
Figure 5A,B.
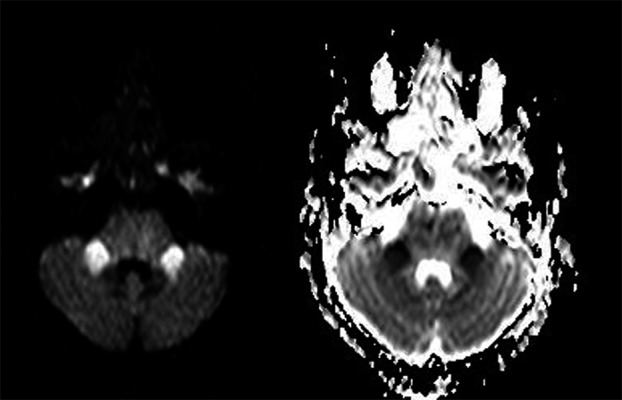
DWI and ADC map showing evidence of restricted diffusion in the cerebellar peduncles in keeping with Wallerian degeneration (day 23).
The patient’s condition subsequently slowly improved. She regained a full range of eye movement in all directions, had a flicker of movement in her left fingers and toes and was able to voluntarily nod for yes and shake her head for no. She was transferred for rehabilitation on day 61. Further follow up imaging has not been performed.
Discussion
Our case demonstrated hyperintensities on T2 weighted imaging and restricted diffusion in the cerebellar peduncles in the subacute stages following a pontine infarct. This high signal in the middle cerebellar peduncles may have been mistaken for ischaemic lesions. A number of factors make ischaemia as the cause of the lesions unlikely. Firstly, the symmetrical bilateral nature of the lesions do not reflect a single arterial territory, the peduncles are supplied by the superior cerebellar artery and the neighbouring structures within the same vascular territory were not involved and also the delayed appearance of these lesions and as the patient had no new neurology at the time of the 23 day scan. The pattern is much more in keeping with Wallerian degeneration.
In the ventral pons there are fibres that are arranged longitudinally and transversely. The longitudinal fibres are the corticospinal, corticobulbar and corticopontine tracts which project through the central portion of the ventral pons. The pontine nuclei surround the longitudinal fibres and give rise to the pontocerebellar tract. This tract is oriented transversely, crosses the midline and enters the cerebellum as the middle cerebellar peduncle. Pontocerebellar fibres constitute the largest contingent of mossy fibre cerebellar afferents. Their nuclei receive somatotopically arranged uncrossed projections from the whole of the ipsilateral cerebral cortex via the internal capsule and cerebral peduncle. The pontocerebellar fibres terminate in the cerebellar hemispheres, vermis and paraflocculus [7]. The signal abnormalities observed in Wallerian degeneration of the cerebellar peduncles is most often bilateral [5–9]. This is as a result of the decussation of fibres in the pons. An infarct in the pons therefore affects the nuclei and the tracts in the pons at the site of the infarct which pass to the contralateral middle cerebellar peduncle and also the tracts passing across from the contralateral nuclei.
Symmetrical bilateral hyperintensity of the middle cerebellar peduncles can also be seen in other conditions. In multisystem atrophy high T2 signal and associated loss of volume, known as the ‘hot cross bun sign’, is well described [10]. Other processes which may result in a similar appearance to Wallerian degeneration include spino-cerebellar ataxia, myelinolysis, methotrexate toxicity and metabolic disorders such as Wilson’s disease and adrenoleukodystrophy [11].
The features of Wallerian degeneration are not usually seen on T2 weighted imaging before 4 weeks [1]. The changes have been reported to last over 20 years [12]. Kuhn et al. describe the histological process of Wallerian degeneration and propose how this correlates to MR findings. They hypothesize Wallerian degeneration is characterised by an initial disintegration of the axon, which is not visible on imaging. From around 20 days to 2–4 months, the tracts may become hydrophobic as a result of the myelin and protein breakdown and appear low signal on T2 imaging. This is followed by an increase in signal intensity as a result of accumulation of water in the oedematous demyelinating tracts. The end stage of Wallerian degeneration is characterised by volume loss, atrophy and gliosis. It is therefore possible to approximately date the stage of Wallerian degeneration by MR findings. Most other series and case reports, including ours do not describe hypointensity in the course of Wallerian degeneration [2,5–9,13,14].
DWI is widely used in brain imaging and the scan time is short. It is useful in depicting Wallerian degeneration and is illustrated by high signal on the DWI sequence. A number of reports suggest that DWI is more sensitive at detecting early Wallerian degeneration than when compared to standard sequences. Uchino and Kang et al. describe Wallerian degeneration in the corticospinal tracts within 2 weeks using DWI [2,14]. Yamanda et al. described a lateral medullary infarct with early and subtle Wallerian degeneration in the inferior cerebellar peduncle 12 days after a stroke [15]. In our case Wallerian degeneration was seen on the T2 and DWI sequences performed 23 days after the patient’s initial symptoms and not on the MR from day 9. It is impossible to know whether the acute Wallerian degeneration is a result of the initial insult or that of the extension of the infarct which occurred on day 8.
Wallerian degeneration has been shown to cause restricted diffusion on DWI in fibre tracts in some reports. Bianchi et al. hypothesizes their findings of restricted diffusion charecterised by low ADC values in the corpus callosum in 4 patients is due to Wallerian degeneration in the corpus callosum [17]. Soares-Fenandes et al. describe restricted diffusion in the corticospinal tracts 13 days following infarction and attribute this to Wallerian degeneration [18]. Mazumdar et al. describe 5 neonates with corticospinal tract Wallerian degeneration imaged with DWI within 8 days of infarction with low ADC values [13].
In other studies where DWI was performed the ADC values have not been described [2,16]. Kuker et al. report a case of affecting the cerebellar peduncles with a normal ADC value where the imaging was performed 3 months after the insult and they conclude that any diffusion abnormality would have subsided by this time. Mejdoubi et al. also describe a high ADC again the imaging was after a long interval of 8 months. The three cases by Fitzek et al. describe minor reductions in the calculated ADC values in two cases (case 1 ADC 7.99×10⁻⁴ versus 8.05×10⁻⁴ mm2/s and case 2 ADC 6.87×10⁻⁴ versus 8.59×10⁻⁴ mm2/s) but these images are not illustrated in their report. Again their imaging was performed 4 months after the insult. Kang et al. also report an increase in the ADC value in the corticospinal tracts their two reports [14].
The explanation for high DWI signal with a spectrum of ADC values remains speculative. Restricted diffusion is likely to be a result of cell swelling, reduced motion of extracellular water, cytotoxic oedema and demyelinisation and timing of imaging is likely to play a significant role in the findings.
More recently, diffusion tensor imaging (DTI) has also shown promising results demonstrating Wallerian degeneration in the early stages following pontine infaction [19] and MCA territory infarction [20] using reduction in fractional anisotropy. A number of reports indicate this may have prognostic implications.
Conclusions
Our case highlights the importance of an understanding of the course of projection and association fibres in the diagnosis of Wallerian degeneration. High signal in the middle cerebellar peduncles with restricted diffusion following a pontine lesion is almost certainly attributable to Wallerian degeneration of the pontocerebellar tracts and should not be mistaken for a new ischaemia.
References:
- 1.Kuhn MJ, Mikulis DJ, Ayoub DM, et al. Wallerian degeneration after cerebral infarction: Evaluation with Sequential MR Imaging. Radiology. 1989;172:179–82. doi: 10.1148/radiology.172.1.2740501. [DOI] [PubMed] [Google Scholar]
- 2.Uchino A, Sawada A, Takase Y, et al. Transient detection of early Wallerian Degeneration on Diffusion-Weighted MRI after an acute Cerebrovascular Accident. Neuroradiology. 2004;46:183–88. doi: 10.1007/s00234-003-1159-x. [DOI] [PubMed] [Google Scholar]
- 3.Savoiardo M, Pareyson D, Grisoli M, et al. The effects of Wallerian Degeneration of the optic radiations demonstrated by MRI. Neuroradiology. 1992;34:323–25. doi: 10.1007/BF00588192. [DOI] [PubMed] [Google Scholar]
- 4.Meguro K, Constans JM, Courtheoux P, et al. Atrophy of the Corpus Callosum correlates with white matter lesions in patients with Cerebral Ischaemia. Neuroradiology. 2000;42:413–19. doi: 10.1007/s002340000302. [DOI] [PubMed] [Google Scholar]
- 5.Kuker W, Schmidt F, Heckl S, et al. Bilateral Wallerian degeneration of the Middle Cerebellar Peduncles due to paramedian pontine infarction. MRI findings. Neuroradiology. 2004;46:896–99. doi: 10.1007/s00234-004-1287-y. [DOI] [PubMed] [Google Scholar]
- 6.Fitzek C, Fitzek S, Stoeter P. Bilateral Wallerian degeneration of the medial Cerebellar Peduncles after Ponto-mesencephalic infarction. Eur J Radiol. 2004;49:198–203. doi: 10.1016/S0720-048X(03)00132-3. [DOI] [PubMed] [Google Scholar]
- 7.De Simone T, Regna-Gladin C, Carriero M, et al. Wallerian Degeneration of the Pontocerebellar Fibers. Am J Neuroradiol. 2005:26, 1062–65. [PMC free article] [PubMed] [Google Scholar]
- 8.Mejdoubi M, Catalaa I, Cognard C, et al. Bilateral Wallerian degeneration of the middle cerebellar peduncles due to unilateral pontine infarction. J Neuroradiol. 2006;33:263–65. doi: 10.1016/s0150-9861(06)77273-x. [DOI] [PubMed] [Google Scholar]
- 9.Uchino A, Sawada A, Takase Y, et al. Wallerian Degeneration of the Middle Cerebellar Peduncle after Pontine Infarction; MR Imaging. Radiation Medicine. 2004;22:37–41. [PubMed] [Google Scholar]
- 10.Okamoto K, Tokiguchi S, Furusawa MR features of diseases involving bilateral Middle Cerebellar Peduncles. Am J Neuroradiol. 2003;24:1946–54. [PMC free article] [PubMed] [Google Scholar]
- 11.Savoiardo M, Strada L, Girotti F, et al. Olivopontocerebellar atrophy: MR diagnosis and relationship to Multisystem Atrophy. Radiology. 1990;174:693–96. doi: 10.1148/radiology.174.3.2305051. [DOI] [PubMed] [Google Scholar]
- 12.Kuhn MJ, Johnson KA, Davis KR. Wallerian degeneration: Evaluation with MR Imaging. Radiology. 1988;168:199–202. doi: 10.1148/radiology.168.1.3380957. [DOI] [PubMed] [Google Scholar]
- 13.Bianchi T, Sims R. Restricted Diffusion in the Splenium of the Corpus Callosum After Cardiac Arrest. Open Neuroimag J. 2008;2:1–4. doi: 10.2174/1874440000802010001. [DOI] [PMC free article] [PubMed] [Google Scholar]
- 13.Mazumdar A, Mukherjee P, Miller J, et al. Diffusion-Weighted Imaging of Acute Corticospinal tract Injury Preceding Wallerian Degeneration in the maturing Human Brain. Am J Neuroradiol. 2003;24:1057–66. [PMC free article] [PubMed] [Google Scholar]
- 14.Kang D, Chu K, Yoon B, et al. Diffusion-weighted imaging in Wallerian Degeneration. J Neurological Sciences. 2000;178:167–69. doi: 10.1016/s0022-510x(00)00373-7. [DOI] [PubMed] [Google Scholar]
- 15.Yamada K, Kizu O, Ito H, et al. Wallerian Degeneration of the inferior cerebellar peduncle depicted by Diffusion Weighted Imaging. J Neurology, Neurosurgery and Psychiatry. 2003;74:977–78. doi: 10.1136/jnnp.74.7.977. [DOI] [PMC free article] [PubMed] [Google Scholar]
- 16.Castillo M, Mukherji SK. Early abnormalities related to post infarction Wallerian degeneration: Evaluation with MR Diffusion Weighted Imaging. J Comput Assist Tomogr. 1999;23:1004–7. doi: 10.1097/00004728-199911000-00034. [DOI] [PubMed] [Google Scholar]
- 17.Bianchi T, Sims R. Restricted Diffusion in the Splenium of the Corpus Callosum After Cardiac Arrest. Open Neuroimag J. 2008;2:1–4. doi: 10.2174/1874440000802010001. [DOI] [PMC free article] [PubMed] [Google Scholar]
- 18.Soares-Fernandes J, Beleza P, Ribeiro M, et al. Wallerian degeneration after stroke: a new prognostic factor? Acta Med Port. 2006;19(6):499–502. [PubMed] [Google Scholar]
- 19.Liang Z, Zeng J, Zhang C, et al. Progression of pathological changes in the middle cerebellar peduncle by diffusion tensor imaging correlates with lesser motor gains after pontine infarction. Neurorehabil Neural Repair. 2009;23(7):692–98. doi: 10.1177/1545968308331142. [DOI] [PubMed] [Google Scholar]
- 20.Thomalla G, Glauche V, Koch MA, et al. Diffusion tensor imaging detects early Wallerian degeneration of the pyramidal tract after ischemic stroke. Neuroimage. 2004;22(4):1767–74. doi: 10.1016/j.neuroimage.2004.03.041. [DOI] [PubMed] [Google Scholar]


