

Summary
In this article, authors presented several characteristic features of Gastrointestinal Stromal Tumors (GISTs), which may lead to diagnostic errors and unexpected difficulties during interpretation of CT images. In case of GIST, one may encounter problems at every level of diagnostics and treatment response monitoring, especially after introduction of modern molecular targeting therapies. RECIST scale criteria, used until now for evaluation of response to treatment in solid tumors are based merely on the size of the tumor and turned out to be inadequate after introduction of treatment with new molecular target drugs such as Imatinib.
Keywords: GIST, CT, imaging
GIST (gastrointestinal stromal tumor) is currently the most commonly diagnosed sarcoma of the gastrointestinal tract and its incidence is still increasing. Relatively recently, i.e. in 1998, this neoplasm was distinguished from a group of other gastrointestinal tract sarcomas after prof. Hirota had discovered a mutation in cKIT [1] protooncogene, which is crucial for the development of this tumor. Since then, the expression of KIT protein (CD 117 antigen) with tyro-sine kinase activity on the surface of the tumor cells has become the main diagnostic criterion.
GIST is resistant to a standard chemo- and radiotherapy. The only curative treatment is radical surgical excision. The effects of treatment of inoperative or metastatic GISTs were, until recently, very poor (median survival after recurrence was 9–20 months). However, in recent years there have appeared radical changes in the therapy of advanced tumors due to the discovery and implementation of treatment with tyrosine-kinase inhibitors. GIST has been the first solid tumor treated with an advanced molecular targeting therapy since 2001, when Imatinib [2,3] was introduced.
Detection of the primary tumor and neoplastic metastases, as well as monitoring of treatment response with radiological imaging sometimes present a challenge for the radiologist because of the diversity of pictures of the disease at every clinical stage. Especially the evaluation of response to molecular targeting therapy in computed tomography (CT) may present problems because radiological images usually differ from those in conventional chemotherapy. Incorrect interpretation of these images due to a strict application of the criteria of response to therapy based merely on changes in tumor size may result in early discontinuation of an effective drug and premature death of a patient.
Difficulties may appear already during diagnostics of the primary tumor. Primary GIST tumors are most often discovered in endoscopic studies as intramural tumors with a frequent characteristic ulceration at the top. However, lesions may be found both inside as well as on the outside of every part of the gastrointestinal tract and also within the omentum and mesentery, without any connection with the gastrointestinal tube, which poses problems or precludes endoscopic detection of the tumor [4]. Figures 1–3 illustrate GIST lesions of various growth patterns.
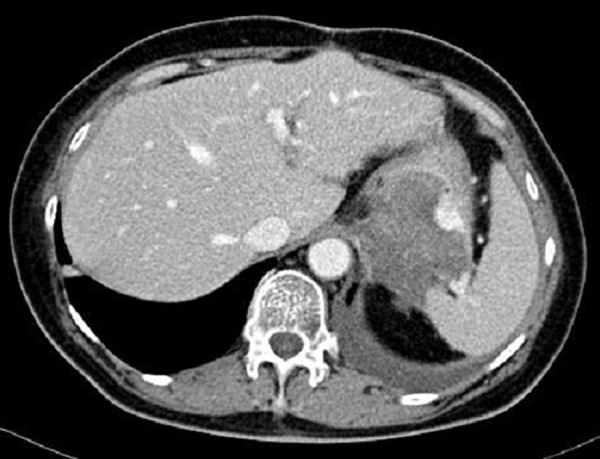
Figure 1.

Axial CT scans of the abdomen. Two cases of typical, intramural GISTs in their most frequent location in the stomach.
Figure 3.

Axial CT scans of the abdomen and reconstruction of the study in the frontal plain. Two cases of endophytic GISTs in the stomach. On the left, there is a large ulceration in the tumor.
Due to a relatively common exophytic growth of the tumor, the lesion may be impossible to detect endoscopically or may cause only slight modeling of the wall from the outside in the involved part of the GI tract. Standard endoscopic examinations are not helpful in the diagnostics of the small intestine either.
Another method frequently used for diagnosing GIST tumors is the ultrasound examination due to its high availability and commonness. Location of lesions inside the wall of the gastrointestinal tract significantly reduces the possibility of their detection in ultrasound scans. In case of lesions that are visible in ultrasound, one may come across great difficulties in regard to identifying the point of origin of the primary lesion and defining its type. Reports of ultrasound examinations, in which primary GISTs were found, are rarely correct in terms of the diagnosis of the tumor originating from the gastrointestinal wall. More often, diagnoses of pancreatic tumors and cysts, tumors of the liver, ovaries, or mesentery, and lymphomas are encountered, as well as abscesses between intestinal loops, intestinal inflammation or even an enlarged spleen. In the rare cases of retroperitoneal primary lesions, the diagnoses of renal and adrenal tumors predominate.
The role of CT usually comes down to staging and determining whether the lesions found through other diagnostic modalities are suitable for excision, as well as postoperative control and monitoring of chemotherapy. In CT, asymptomatic primary tumors are often incidentally found during studies performed for other reasons.
In CT diagnostics of GISTs one may encounter, although less often, similar difficulties in defining the character and point of origin of lesions as in ultrasound examinations. The following tumor characteristics influence these problems:
connection with the gastrointestinal wall, often difficult to visualize due to poor filling of the stomach and intestines with fluid or contrast medium,
lack of characteristic features of GISTs that would differentiate them from other possible lesions of the gastrointestinal wall, such as sarcomas, neuromas, carcinoid tumors, lymphomas, ectopic pancreas, etc,
areas of necrosis and cystic degeneration, often very large, result in misdiagnosis of intraabdominal abscesses, inflamed intestinal loops, conglomerates of intestinal loops, cysts and tumors of the pancreas or mesentery etc,
difficulties in defining the point of origin of large lesions, which invade and push aside surrounding structures and organs, as well as intestinal tumors infiltrating the mesentery,
heterogenous, low and high initial contrasting of the lesions with possible presence of calcifications; various types and enhancement intensity; and sometimes no strong enhancement typical for sarcomas,
rare incidence of this tumor, which inclines the reporting radiologist to diagnose lesions other than GIST.
Figures 4–9 presenting examples of lesions that posed diagnostics difficulties.
Figure 4.

Axial CT scans of the abdomen. Duodenal GIST described as a pathology of the gallbladder: perforated cholecystitis or carcinoma of the gallbladder with cholelithiasis.
Figure 9.

Axial CT scans of the abdomen. Two typical small bowel and duodenal GIST tumors. In these cases, radiological reports suggested primary lymphomas. Lack of enlarged lymph nodes in GISTs makes the differential diagnosis easier.
Dissemination of the primary process is often found at the moment of diagnosis. It is most commonly seen in the liver or peritoneum [6]. Sporadically, one may encounter primary metastatic tumors in other organs, including lymph nodes – in very advanced stages. While looking for meta-static tumors, one may also encounter problems, especially in case of small nodules and a mild spread to the peritoneum, as shown in Figure 10. In these cases, it is particularly important to fill the lumen of the GI tract with non-contrasting fluid or contrast agent [7,8].
Figure 10.

Axial CT scans of the abdomen. Two cases of small peritoneal metastases, which could be easily missed by the radiologist
The figures above also prove that ultrasound scan may not be appropriate for periodic follow-up examinations in patients after resection of the primary tumor because the chances for visualizing such lesions are slim. Regrettably, this is a common practice of some clinicians despite firm guidelines on periodic follow-up using computed tomography [9].
A radiologist searching for sarcoma spread to the liver expects metastatic nodules that become well enhanced after injection of a contrast medium, best visible in the arterial or venous phase of a dynamic study.
However, very diverse pictures may be encountered, which was illustrated in Figures 11–15.
Figure 11.

Axial CT scans of the abdomen – consecutive phases of dynamic CT examination. Strongly enhanced metastatic nodules are best visible in the arterial phase.
Figure 15.

Axial CT scans of the abdomen – consecutive phases of dynamic CT examination. Untypically, metastases are best seen before intravenous injection of contrast medium; the degree of their enhancement is similar to that of liver parenchyma.
Occurrence of isodense GIST metastases has been described in the literature [10–12]. The degree of their enhancement after application of the contrast agent is similar to that of the surrounding hepatic parenchyma, which may result in overlooking all or some of the lesions, especially in a single-phase study. In case of tumors that are poorly distinguishable from the surrounding tissue there may be problems with taking measurements. Monitoring of response to treatment poses a separate, fundamental diagnostic problem because of an untypical picture of a tumor during therapy and danger of discontinuation of the treatment following erroneous interpretation of radiographic images.
According to the RECIST 1.1 scale, commonly used in clinical studies for assessment of response to therapy, the only criterion of response is the reduction in tumor size, as shown in Table 1.
Table 1.
RECIST classification.
| Response to treatment according to RECIST scale | ||
|---|---|---|
| Complete regression | CR | Regression of all known foci of the disease and lack of new lesions |
| Partial regression | PR | At least 30% reduction in the sums of dimensions that could be measured, i.e. larger than 1 cm |
| Stable disease | SD | Dimensions of the lesions do not fulfill criteria of progression or regression |
| Progressive disease | PD | Enlargement of lesions by at least 20%, appearance of new lesions |
Alerady in 2004, three years after introduction of Imatinib to treatment of GIST, prof. Choi proposed extending the “response to treatment” scale by adding criteria of evaluation of tumor density changes following treatment, as assessed after injection of a contrast medium [13]. Classification according to Choi was presented in Table 2.
Table 2.
Classification according to Choi.
| Response to treatment according to Choi | ||
|---|---|---|
| Complete regression | CR | Disappearance of all known foci of the disease and lack of new lesions |
| Partial regression | PR | Reduction in the sizes of lesions by at least 10% or reduction in post-contrast enhancement by 15% or more |
| Stable disease | SD | Dimensions and contrasting of the lesions do not fulfill the criteria for progression or regression |
| Progression | PD | Increase in the size of the lesion by at least 10% without reduction in contrasting, appearance of a new lesion or enhancing nodule within the old lesion |
A decrease in density of lesions in CT images in response to effective treatment (confirmed with PET study) is currently a well-documented phenomenon in GIST chemotherapy [12,14,15]. At first, sizes of the lesions may remain unchanged despite good therapeutic response, and the only sign of treatment efficacy is a reduction of density in CT images. In such cases, the RECIST classification defines the disease as stable, while in fact it is regressing. It has also been found that lowering of density of the lesions has a greater prognostic value in terms of therapeutic efficacy than reduction in their sizes. Figure 16 pictures typical cases of good response to Imatinib treatment.
Figure 16.

Axial CT scans of the abdomen. Two examples of response to therapy in advanced GISTs. Both tumor sizes and densities have strongly decreased (to the level of fluid density). Liver metastases have a pseudocystic appearance.
The most important phenomenon that may occur during GIST chemotherapy is, so called, pseudoprogression of the lesions. It signifies an increase in tumor size despite a very good response to therapy (confirmed by PET study). In such cases, enlargement is always accompanied by a decrease in density in CT [11,16,17]. This phenomenon is relatively rare, but it may have fatal consequences for the patient if therapy response monitoring is performed using only RECIST scale, which takes into consideration only the sizes of lesions. Application of Choi’s classification, which includes evaluation of changes in tumor density following treatment, eliminates the threat of discontinuation of an effective drug. Awareness of the pseudoprogression phenomenon in GIST therapy, as well as in targeted molecular therapies of other neoplasms is still not widespread while this problem occurs more and more often as new drugs appear on the market.
Figures 17 and 18 presents case of a slight increase in lesion size after treatment accompanied by lowering of its contrasting, which classifies it as SD according to RECIST scale and as PR according to Choi classification.
Figure 17.

Axial CT scans of the abdomen. Metastatic tumor in the liver before (images in the upper row) and after two months of treatment with Imatinib (the lower row). Tumor size has slightly increased, but its density is significantly lower. Such increase in size during treatment is due to tumor tissue edema and intra-neoplastic hemorrhages.
Figure 18.

Axial CT scans of the abdomen. Another case of lowering of density of liver metastasis during chemotherapy (picture on the right) with concomitant increase in size.
Apart from an increase in tumor size during effective chemotherapy, other issues may arise, making a proper radiological interpretation difficult:
transformation of metastatic foci into lesions imitating simple cysts,
appearance of images with new metastatic foci during effective chemotherapy,
unexpected changes in size and contrasting of tumors, such as: concomitant reductions and increases in sizes of different lesions, decrease in tumor size despite disease progression, seeming increase in lesion density,
picture of a very slow progression, which sometimes lasts for years,
a unique pattern of disease progression in the form of so-called ‘nodules within tumors’.
Figures 19 and 20 show hepatic ‘cysts’ that were formed as a result of treatment but always contain a live neo-plastic tissue despite the lack of contrast enhancement. In some situations, when initial CT images and medical documentation are unavailable for comparison, these ‘cysts’ may be reported by a radiologist as simple cysts.
Figure 19.

Axial CT scans of the abdomen. Two examples of GIST metastases with pseudocystic appearance due to the fibromyxoid transformation induced by Imatinib treatment. The density of these lesions is usually slightly higher than of simple cysts.
Figure 20.

Axial CT scans of the abdomen. A case of pseudocystic liver metastases increasing in size and density – failure of Imatinib treatment and tumor progression.
During therapy of GIST, a phenomenon of pseudoprogression of a different kind may occur, which can also lead to discontinuation of an effective drug. Some of smaller metastatic lesions in the liver may be at first isodense to the surrounding liver parenchyma and exhibit similar degree of enhancement after application of the contrast medium, which makes them invisible in the initial CT examination. Following treatment, ‘new’ lesions may appear, which is a result of density lowering in previously present but unrecognized foci. Such situation was illustrated in Figure 21.
Figure 21.

Axial CT scans of the abdomen. A case of small liver metastases that initially were not visible. After several months of treatment, they appeared in CT images due to the lowering of their density. Such lesions may be incorrectly reported as new lesions.
During chemotherapy, one may also encounter a ‘worrisome’ increase in the density of a lesion following treatment, which in fact is caused by hemorrhages within the tumors. Such situation was presented in Figure 22.
Figure 22.

Axial CT scans of the abdomen before and after contrast injection. In the scans taken after treatment with Imatinib (the lower row), there is an increase in tumor density due to hemorrhaging. It is easier to differentiate between a true progression and hemorrhagic changes causing an increase in density of the tumor on images acquired before contrast injection. In such cases, there is no increase in contrast enhancement either.
There are also surprises regarding changes in tumor size during therapy. One may encounter metastases that decrease in size while other lesions remain unchanged or become enlarged, especially the ‘cystic’ lesions. Metastases may also diminish as the disease progresses and the only sign of progression may be an increase in tumor density or thickening of the wall in cases of ‘neoplastic cysts’, which was illustrated in Figures 23–26.
Figure 23.

Axial CT scans of the abdomen. Diminishing of the size of peritoneal metastatic tumor during treatment with Imatinib despite an actual progression of the disease as evidenced by the thickening of the walls of a ‘neoplastic cyst’ and appearance of enhanced paramural nodules.
Figure 26.

Axial CT scans of the abdomen – consecutive images during treatment with Imatinib. Changing sizes and degrees of contrast enhancement of metastatic lesions in the following months of therapy. Sizes of the tumors were constantly decreasing despite progression of the disease evidenced by appearance of new solid tissue within the neoplastic ‘cyst’.
One should also remember about the possibility of so-called slow disease progression. In some patients, enlargement of metastatic changes occurs very slowly and the patient evidently benefits from continuation of chemotherapy. The longest-treated person in Cracow facility has remained in good condition for the last six years despite a massive neo-plastic dissemination to the liver and constant enlargement of most foci since the very beginning of the therapy. In such cases, treatment should be carried on despite seeming indications for its discontinuation.
There are also unique images of metastatic nodules within metastatic tumors, first observed in GIST chemotherapy. They are caused by new local mutations within the ‘old’ neoplastic tissue, which gives rise to new lines of cells resistant to the applied drug. In CT, such changes are visualized as new, tiny areas of solid tissue, usually undergoing strong enhancement following contrast injection, usually located near the wall on the inside (rarely on the outside) of the old ‘neoplastic cyst’ that was formed during chemotherapy. As the dimensions of the old tumor usually do not change and may even diminish, they are classified as SD or PR according to RECIST scale, while in reality the disease progresses. Knowledge about this new progression pattern allows for early recognition of resistance to therapy with CT examinations. It should be noted that nodules may appear in every location within the old metastatic lesion. Live neoplastic cells always remain inside, as a consequence of chemostatic, not chemotoxic mechanism of action of targeted molecular therapies. Resistance to treatment exhibited by some cell lines poses a fundamental problem and indicates the lack of possibility of full recovery from GIST on Imatinib [17–19] treatment.
Conclusions
The variety of problems that arise in diagnostics and treatment monitoring of GIST tumors requires a thorough knowledge of this disease on the part of the reporting radiologist; optimally, provided by training in centers specializing in the treatment of GIST.
Also, the importance of the flow of information between clinicians and radiologists evaluating effectiveness of chemotherapy increases. Radiologists have to possess information on the type of drug the patient receives, its mechanism of action and duration of treatment. They also must know whether there were interruptions in treatment and if so, when it was discontinued. Lack of this information may result in incorrect interpretation of changes seen in radiological studies and have fatal consequences for the patient.
Due to the appearance of new patterns of therapeutic response in targeted molecular therapy and unique patterns of neoplastic progression, the criteria for radiological evaluation using CT that are based on measurements of tumor dimensions should be changed.
Figure 2.

Axial CT scans of the abdomen. Two cases of exophytic GISTs in the stomach.
Figure 5.

Axial CT scans of the abdomen. Two examples of GISTs described as intraabdominal abscesses or inflammation of the small intestine wall.
Figure 6.

Axial CT scan and reconstruction of the study in the frontal plain. A case of small intestine GIST diagnosed as an ovarian tumor and resected in the gynecology ward.
Figure 7.

Axial CT scan and reconstruction in the frontal plain. A small intestine GIST reported as endometriosis
Figure 8.

Axial CT scans of the abdomen. Two examples of GIST tumors with uncertain point of origin due to their large sizes. Picture on the left presents a rare primary retroperitoneal tumor.
Figure 12.

Axial CT scans of the abdomen – consecutive phases of dynamic CT examination. Well-enhancing metastatic nodules with areas of necrosis, located in the liver are best seen in the venous phase of the study.
Figure 13.

Axial CT scans of the abdomen. Typical presentation of larger GIST metastases of heterogenous density due to the presence of hypodense areas of necrosis.
Figure 14.

Axial CT scans of the abdomen – consecutive phases of dynamic CT examination. Unusual, because poorly enhancing metastatic nodules are best seen in the venous phase.
Figure 24.
Axial CT scan of the abdomen. The same tumor as in Figure 16 (the bottom row) after approximately three years of treatment with Imatinib. The size of the tumor has further decreased despite actual progression of the neoplastic process as evidenced by the appearance of contrast enhancement within the tumor.
Figure 25.

Axial CT scans of the abdomen – consecutive images during treatment with Imatinib within approximately one year. There is an apparent evolution of lesions in the following months of therapy evidenced by decrease in the sizes of tumors and lowering of their densities. The picture on the left shows progression despite continuous diminishing of the lesions. Note the new enhancing nodule within the biggest tumor (a “nodule within a nodule”) after injection of the contrast agent.
References:
- 1.Hirota S, Isozaki K, Moriyama Y, et al. Gain-of-function mutations of c-kit in human gastrointestinal stromal tumors. Science. 1998;279(5350):577–80. doi: 10.1126/science.279.5350.577. [DOI] [PubMed] [Google Scholar]
- 2.van Oosterom AT, Judson I, Verweij J, et al. Safety and efficacy of imatinib (STI571) in metastatic gastrointestinal stromal tumours: a phase I study. Lancet. 2001;358(9291):1421–23. doi: 10.1016/s0140-6736(01)06535-7. [DOI] [PubMed] [Google Scholar]
- 3.Radford IR. Imatinib. Novartis. Curr Opin Investig Drugs. 2002;3(3):492–99. [PubMed] [Google Scholar]
- 4.Stachura J, Limon J, Ruka W, et al. GIST Nowotwory podścieliskowe (stromalne) przewodu pokarmowego. Wydawnictwo Via Medica. 2003 [in Polish] [Google Scholar]
- 5.Kim HC, Lee JM, Kim SH, et al. Small gastrointestinal stromal tumours with focal areas of low attenuation on CT: pathological correlation. Clinical Radiology. 2005;60(3):384–88. doi: 10.1016/j.crad.2004.06.022. [DOI] [PubMed] [Google Scholar]
- 6.Rutkowski P, Debiec-Rychter M, Ruka W. Gastrointestinal stromal tumors: key to diagnosis and choice of therapy. Mol Diagn Ther. 2008;12(3):131–43. doi: 10.1007/BF03256278. [DOI] [PubMed] [Google Scholar]
- 7.Horton KM, Juluru K, Montogomery E, et al. Computed tomography imaging of gastrointestinal stromal tumors with pathology correlation. J Comput Assist Tomogr. 2004;28(6):811–17. doi: 10.1097/00004728-200411000-00014. [DOI] [PubMed] [Google Scholar]
- 8.Hersh MR, Choi J, Garrett C, et al. Imaging gastrointestinal stromal tumors. Cancer Control. 2005;12(2):111–15. doi: 10.1177/107327480501200206. [DOI] [PubMed] [Google Scholar]
- 9.Blay JY, Bonvalot S, Casali P, et al. Consensus meeting for the management of gastrointestinal stromal tumors. Report of the GIST Consensus Conference of 20–21 March 2004, under the auspices of ESMO. Ann Oncol. 2005;16(4):566–78. doi: 10.1093/annonc/mdi127. [DOI] [PubMed] [Google Scholar]
- 10.Linton KM, Taylor MB, Radford JA. Response evaluation in gastrointestinal stromal tumours treated with imatinib: misdiagnosis of disease progression on CT due to cystic change in liver metastases. BrJ Radiol. 2006;79(944):40–44. doi: 10.1259/bjr/62872118. [DOI] [PubMed] [Google Scholar]
- 11.Choi H, Charnsangavej C, Faria SC, et al. Correlation of computed tomography and positron emission tomography in patients with metastatic gastrointestinal stromal tumor treated at a single institution with imatinib mesylate: proposal of new computed tomography response criteria. J Clin Oncol. 2007;25(13):1753–59. doi: 10.1200/JCO.2006.07.3049. [DOI] [PubMed] [Google Scholar]
- 12.Bechtold RE, Chen MY, Stanton CA, et al. Cystic changes in hepatic and peritoneal metastases from gastrointestinal stromal tumors treated with Gleevec. Abdominal imaging. 2003;28(6):808–14. doi: 10.1007/s00261-003-0021-2. [DOI] [PubMed] [Google Scholar]
- 13.Choi H, Charnsangavej C, de Castro Faria S, et al. CT evaluation of the response of gastrointestinal stromal tumors after imatinib mesylate treatment: a quantitative analysis correlated with FDG PET findings. AJR. 2004;183(6):1619–28. doi: 10.2214/ajr.183.6.01831619. [DOI] [PubMed] [Google Scholar]
- 14.Chen MY, Bechtold RE, Savage PD. Cystic changes in hepatic metastases from gastrointestinal stromal tumors (GISTs) treated with Gleevec (imatinib mesylate) AJR. 2002;179(4):1059–62. doi: 10.2214/ajr.179.4.1791059. [DOI] [PubMed] [Google Scholar]
- 15.Choi H. Critical issues in response evaluation on computed tomography: lessons from the gastrointestinal stromal tumor model. Curr Oncol Rep. 2005;7(4):307–11. doi: 10.1007/s11912-005-0055-4. [DOI] [PubMed] [Google Scholar]
- 16.Mabille M, Vanel D, Albiter M, et al. Follow-up of hepatic and peritoneal metastases of gastrointestinal tumors (GIST) under Imatinib therapy requires different criteria of radiological evaluation (size is not everything!!!) Eur J Radiol. 2009;69(2):204–8. doi: 10.1016/j.ejrad.2008.10.009. [DOI] [PubMed] [Google Scholar]
- 17.Benjamin RS, Choi H, Macapinlac HA, et al. We should desist using RECIST, at least in GIST. J Clin Oncol. 2007;25(13):1760–64. doi: 10.1200/JCO.2006.07.3411. [DOI] [PubMed] [Google Scholar]
- 18.Desai J, Shankar S, Heinrich MC, et al. Clonal evolution of resistance to imatinib in patients with metastatic gastrointestinal stromal tumors. Clin Cancer Res. 2007;13(18):5398–405. doi: 10.1158/1078-0432.CCR-06-0858. [DOI] [PubMed] [Google Scholar]
- 19.Shankar S, vanSonnenberg E, Desai J, et al. Gastrointestinal stromal tumor: new nodule-within-a-mass pattern of recurrence after partial response to imatinib mesylate. Radiology. 2005;235(3):892–98. doi: 10.1148/radiol.2353040332. [DOI] [PubMed] [Google Scholar]