Summary
Background:
Currently, a few imaging methods are used in CNS diagnostics: computed tomography – CT, magnetic resonance imaging – MRI, and ultrasonography – USG. The ventricular system changes its dimensions with child’s development. Linear indices commonly used in the diagnostics of hydrocephalus do not consider developmental changes of the intracranial fluid spaces. The aim of our work was to identify reference values for selected linear indices in specific age groups.
Material/Methods:
The material included 507 CT examinations of the head in children of different age and both sexes. There were 381 CT examinations considered as normal and they were used to establish the reference values. They were compared with 126 CTs from the observational zone (3–10 percentile and 90–97 percentile). The children were divided into 7 following age groups: 0–12 months, >12–36 months, >3–6 years, >6–9 years, >9–12 years, >12–15 years, >15–18 years. For every group, the 10th, 25th, 50th, 75th and 90th percentile was calculated. The range between the 10th and the 90th percentile was described as a norm.
Results:
Reference values for particular indices: Huckman Number from 3.3 to 5.0 cm with correlation coefficient according to age equal to 0.34; Evans’ Index from 0.218 to 0.312 with correlation coefficient of −0.12; Bifrontal Index from 0.265 to 0.380 with correlation coefficient of 0.18; Bicaudate / Frontal Index from 0.212 to 0.524 with correlation coefficient of −0,33; Bicaudate Index from 0.059 to 0.152 with correlation coefficient of −0.26; Bicaudate / Temporal Index from 0.051 to 0.138 with correlation coefficient of 0.32; Schiersmann’s Index from 3.545 to 6.038 with correlation coefficient of 0.42.
Conclusions:
The intracerebral CSF spaces increased in a non-uniform manner with age. All indices established on the basis of linear parameters were relatively higher in younger children than in the older ones. In proportion to the cranial size, the intracranial fluid spaces decreased according to the age.
Keywords: infants and children, cerebrospinal fluid, computed tomography (CT), reference values, linear indices
Background
Currently, CNS diagnostics applies a few imaging methods: computed tomography – CT, magnetic resonance imaging – MRI, and ultrasonography for diagnostics of infants under 12 months old [1]. These different imaging modalities make it possible to show precisely the anatomy of the brain but also a lot of pathological changes [2–4]. Computed tomography (CT) is especially useful for the evaluation of brain morphology, including the size and shape of the ventricular system. CT images show differences in ventricular size in order to confirm ventricular widening or narrowing [2,5,6].
In children, changes of the ventricular system are connected with their development or show individual changes. However, they can be a result of many pathological factors influencing the child in infantry and childhood [5]. To evaluate intracranial fluid spaces, it was essential to establish reference values which determine their normal size taking into consideration developmental changes.
There are many indices based on linear measurements, which can be used to describe the ventricular system: Evans’ Index, Huckman Number, Bicaudate – Frontal (ventricular) Index, Schiersmann’s Index, Bicaudate Index etc. [7–10]. Their reference values can be found in the literature. Unfortunately, these data are not uniform for all age groups, because children undergo developmental changes. The aim of the presented research was to provide new reference values for the selected linear indices for intracranial fluid spaces in children from different age groups.
Material and Methods
The analysis included 507 CT images of the head in children diagnosed between January and August 2007 in Górnośląskie Centrum Zdrowia Dziecka Śląskiego Uniwersytetu Medycznego w Katowicach. The research material included the population of children from Silesia, of both sexes, aged from 1 day to 18 years (297 M, 210 F).
CT examinations were performed in transverse planes, with slice thickness of 3 and 8 mm, with the use of Somatom PLUS 4 scanner by Siemens. Only standardized CT examinations, i.e. performed along with proper planes, were analyzed. All CT examinations were radiodiagnostically described as normal (Group I) or abnormal (Group II). Measurements performed in Group I were used for analysis, to establish reference values. Measurements obtained in Group II were used for normative value equalization and correctness. Exclusion criteria were as follows: genetic disorders, intraventricular or subarachnoid hemorrhage, a history of a severe head trauma or central nervous system infection, as well as premature birth.
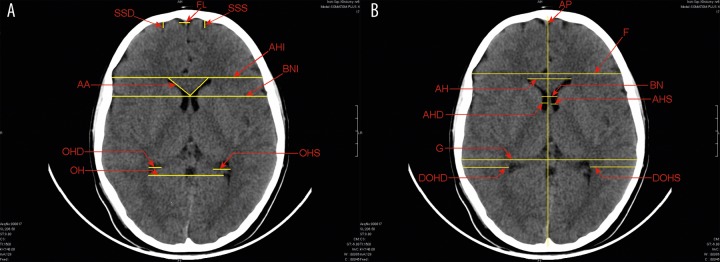
Linear measurements were performed on standardized transverse slices with the use of SIENET Magic View 300 – DICOM CD Browser (Figure 1). Specified linear measurements on the selected transverse sections were taken. Based on the measurements, the following linear indices were calculated: Huckman number, Evans’ Index, Bifrontal Index, Bicaudate-Frontal Index (Ventricular Index), Bicaudate Index, Bicaudate-Temporal Index, Schiersmann’s Index (Table 1). On the basis of developmental changes of the skull, ventricular system and arachnoid granulations, the children were divided into 7 age groups (Table 2). To establish reference values, the percentile method was used.
Figure 1.
Evaluation of linear measurements on selected CT scans.
Table 1.
Indices established on the basis of linear measurements.
| Index | Description |
|---|---|
| Huckman Number AH+BN [11] | Sum of the maximum distance between anterior horns and minimum bicaudate nuclei distance |
| Evans’ Index AH/G [8] | Maximum distance between anterior horns divided by maximum internal skull diameter |
| Bifrontal Index AH/F [8] | Maximum distance between anterior horns divided by maximum internal diameter of the frontal bone |
| Bicaudate-Frontal Index (ventricular) BN/AH [7] | Minimum bicaudate nuclei distance divided by maximum distance between anterior horns |
| Bicaudate Index BN/BNI [8] | Minimum bicaudate nuclei distance divided by internal skull diameter measured along the same line |
| Bicaudate-Temporal Index BN/G [9] | Minimum bicaudate nuclei distance divided by maximum internal skull diameter. |
| Schiersmann's Index H/E [7] | Maximum external diameter of the skull divided by cella media distance. |
Table 2.
Children distribution according to age – group I and II.
| Age group | Number of children, Group I | Number of children, Group II |
|---|---|---|
| 0–12 months | 51 | 33 |
| >12–36 months | 33 | 17 |
| >3–6 years | 45 | 12 |
| >6–9 years | 64 | 18 |
| >9–12 years | 68 | 20 |
| >12–15 years | 63 | 15 |
| >15–18 years | 57 | 10 |
For Group I, the mean value, SD, median, quartiles 1 and 3, as well as the 10th and 90th percentile were calculated for each age group. Values between the 10th and 90th percentile were described as an unquestionable norm. Percentile range from 3rd to 10th and from 90th to 97th was qualified as an “observation zone” and excluded from the norm creation [11,12].
For Group II, the mean value and SD were calculated, as well as the maximum and minimum. Statistical analysis was based on Pearson’s chi-square test to check the population distribution, and on Kolmogorov-Smirnov test to compare the sample with a reference probability distribution. The variation analysis between age groups was performed and correlation coefficient according to age was calculated. For normal distribution and variance homogeneity among the age groups, the parametric ANOVA test was used. For other types of distribution, the nonparametric Mann-Whitney U test and Kruskal-Wallis test were used. The Kruskal-Wallis test does not assume a normal distribution.
Results
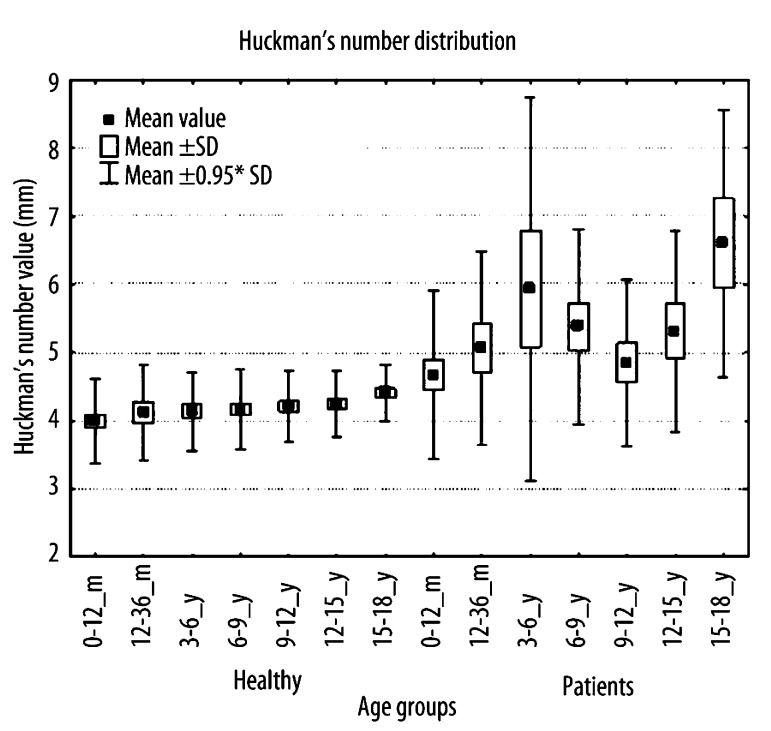
Huckman Number(AH+BN) – a sum of the maximum distance between anterior horns and of the minimum bicaudate nuclei distance (Figure 2).
Figure 2.
Mean value distribution of the Huckman Number in particular age groups. Group I (from zd 0–12 months to zd 15–18 years) and Group II (from ch 0–12 months to ch 15–18 years).
Changes between groups >3–6 years*, >6–9 years*, >12– 15 years, and >15–18 years* in Group I and II were statistically significant (a high statistical significance, with P value of < 0.002, was marked with *) (Table 3). The index presented increase according to the age (correlation coefficient at the level of “0.34”). No significant differences in the Huckman Number were found between consecutive age groups (P>0.01) (Table 4).
Table 3.
Reference values of the Huckman Number for Group I. 10 (10th percentile), 25 (1st quartile), 50 (median), 75 (3rd quartile), 90 (90th percentile), 10–90 reference values, mean ±SD standard deviation.
| Age group | 10 | 25 | 50 | 75 | 90 | 10–90 norm | Mean ±SD |
|---|---|---|---|---|---|---|---|
| 0–12 months | 3.300 | 3.580 | 3.900 | 4.300 | 4.980 | 3.300–4.980 | 4.001±0.750 |
| >12–36 months | 3.530 | 3.600 | 4.000 | 4.320 | 4.780 | 3.530–4.780 | 4.145±0.804 |
| >3–6 years | 3.600 | 3.800 | 4.100 | 4.343 | 4.960 | 3.600–4.960 | 4.125±0.544 |
| >6–9 years | 3.640 | 3.755 | 4.100 | 4.400 | 5.000 | 3.640–5.000 | 4.160±0.604 |
| >9–12 years | 3.690 | 3.800 | 4.170 | 4.595 | 4.940 | 3.690–4.940 | 4.226±0.523 |
| >12–15 years | 3.700 | 3.945 | 4.265 | 4.700 | 4.950 | 3.700–4.950 | 4.257±0.500 |
| >15–18 years | 4.000 | 4.100 | 4.300 | 4.600 | 4.950 | 4.000–4.950 | 4.389±0.438 |
Table 4.
Comparative values of the Huckman Number for Group II. Min. – minimal value, Max. – maximal value, Mean ±SD standard deviation.
| Age group | Min | Max | Mean ±SD |
|---|---|---|---|
| 0–12 months | 2.600 | 9.300 | 4.676±1.304 |
| >12–36 months | 2.600 | 8.480 | 5.065±1.494 |
| >3–6 years | 3.700 | 14.600 | 5.938±2.967 |
| >6–9 years | 3.320 | 8.010 | 5.380±1.498 |
| >9–12 years | 2.890 | 7.450 | 4.850±1.287 |
| >12–15 years | 3.400 | 8.850 | 5.310±1.559 |
| >15–18 years | 3.870 | 9.600 | 6.610±2.062 |
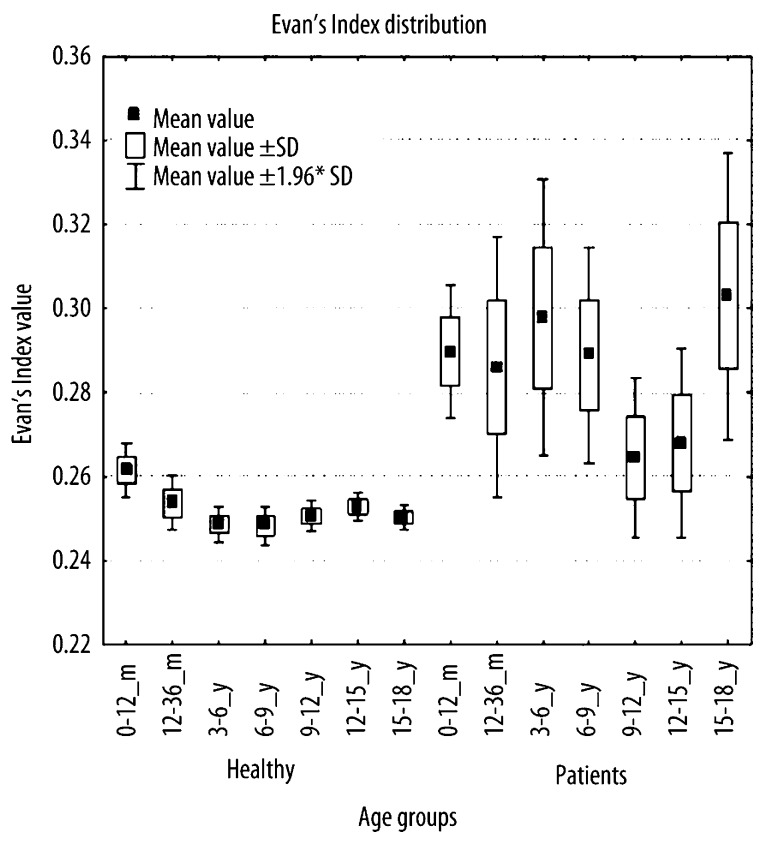
Evans’ Index (AH/G) – maximum distance between anterior horns divided by maximum internal skull diameter (Figure 3).
Figure 3.
Distribution of mean values of the Evans’ Index in particular age groups.
Evans’ Index changes between groups 0–12 months, >3–6 years* (P<0.006), >6–9 years, >12–15 years, and >15–18 years in Group I and II were of statistical significance (Table 5). Index value showed decrease according to the age (correlation coefficient of “–0.12”). No significant differences in the Evans’ Index were found between consecutive age groups (P>0.01) (Table 6).
Table 5.
Reference values of the Evans’ Index for Group I.
| Age group | 10 | 25 | 50 | 75 | 90 | 10–90 norm | Mean ±SD |
|---|---|---|---|---|---|---|---|
| 0–12 months | 0.230 | 0.243 | 0.255 | 0.275 | 0.312 | 0.230–0.312 | 0.263±0.034 |
| >12–36 months | 0.235 | 0.237 | 0.247 | 0.267 | 0.290 | 0.235–0.290 | 0.253±0.028 |
| >3–6 years | 0.224 | 0.234 | 0.248 | 0.260 | 0.272 | 0.224–0.272 | 0.247±0.019 |
| >6–9 years | 0.218 | 0.229 | 0.248 | 0.263 | 0.282 | 0.218–0.282 | 0.248±0.028 |
| >9–12 years | 0.231 | 0.236 | 0.250 | 0.260 | 0.284 | 0.231–0.284 | 0.250±0.023 |
| >12–15 years | 0.233 | 0.240 | 0.251 | 0.263 | 0.278 | 0.233–0.278 | 0.252±0.019 |
| >15–18 years | 0.230 | 0.240 | 0.252 | 0.257 | 0.276 | 0.230–0.276 | 0.251±0.022 |
Table 6.
Comparative values of the Evans’ Index for Group II.
| Age group | Min | Max | Mean ±SD |
|---|---|---|---|
| 0–12 months | 0.220 | 0.410 | 0.290±0.046 |
| >12–36 months | 0.163 | 0.395 | 0.286±0.065 |
| >3–6 years | 0.208 | 0.439 | 0.298±0.058 |
| >6–9 years | 0.176 | 0.374 | 0.289±0.056 |
| >9–12 years | 0.198 | 0.333 | 0.264±0.044 |
| >12–15 years | 0.179 | 0.361 | 0.268±0.045 |
| >15–18 years | 0.220 | 0.393 | 0.303±0.055 |
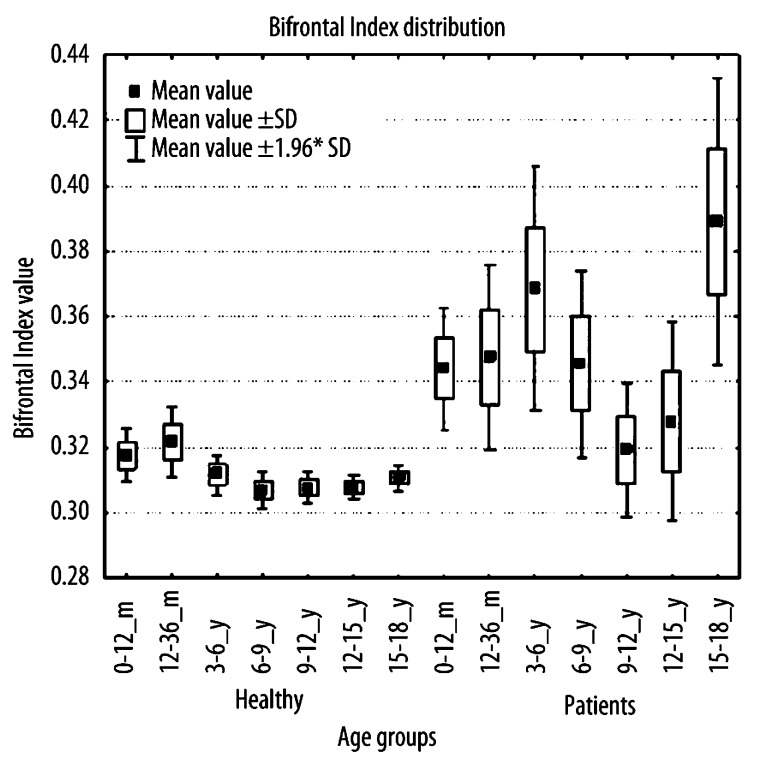
Bifrontal Index (AH/F) – maximum distance between anterior horns divided by maximum internal diameter of the frontal bone (Figure 4).
Figure 4.
Distribution of values of the Bifrontal Index in particular age groups.
Statistically significant differences between age groups >3–6 years, and >6–9 years* (P<0.001) in Group I and II were noted (Table 7). The index presented an increase according to the age (correlation coefficient at the level of “0.18”). Differences in the Bifrontal Index between consecutive age groups were not statistically significant (Table 8).
Table 7.
Reference values of the Bifrontal Index for Group I.
| Age group | 10 | 25 | 50 | 75 | 90 | 10–90 norm | Mean ±SD |
|---|---|---|---|---|---|---|---|
| 0–12 months | 0.274 | 0.294 | 0.310 | 0.339 | 0.380 | 0.274–0.380 | 0.318±0.043 |
| >12–36 months | 0.268 | 0.294 | 0.319 | 0.330 | 0.345 | 0.268–0.345 | 0.316±0.058 |
| >3–6 years | 0.276 | 0.290 | 0.310 | 0.329 | 0.346 | 0.276–0.346 | 0.310±0.027 |
| >6–9 years | 0.265 | 0.284 | 0.304 | 0.327 | 0.343 | 0.265–0.343 | 0.305±0.034 |
| >9–12 years | 0.279 | 0.292 | 0.302 | 0.327 | 0.351 | 0.279–0.351 | 0.308±0.031 |
| >12–15 years | 0.285 | 0.293 | 0.306 | 0.322 | 0.332 | 0.285–0.332 | 0.306±0.024 |
| >15–18 years | 0.288 | 0.295 | 0.311 | 0.321 | 0.336 | 0.288–0.339 | 0.310±0.027 |
Table 8.
Comparative values of the Evans’ Index for Group II.
| Age group | Min | Max | Mean ± SD |
|---|---|---|---|
| 0–12 months | 0.259 | 0.491 | 0.344±0.055 |
| >12–36 months | 0.208 | 0.478 | 0.352±0.085 |
| >3–6 years | 0.278 | 0.519 | 0.368±0.066 |
| >6–9 years | 0.197 | 0.456 | 0.345±0.062 |
| >9–12 years | 0.245 | 0.400 | 0.319±0.046 |
| >12–15 years | 0.215 | 0.428 | 0.328±0.060 |
| >15–18 years | 0.274 | 0.465 | 0.389±0.071 |
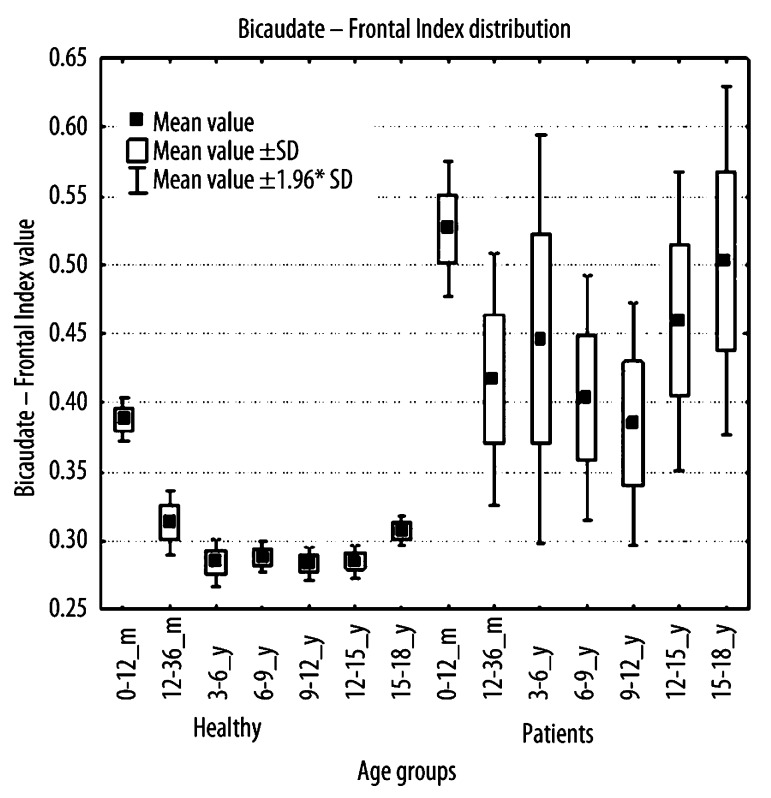
Bicaudate-Frontal Index (Ventricular Index) (BN/AH) – minimum bicaudate nuclei distance divided by maximum distance between anterior horns (Figure 5).
Figure 5.
Distribution of mean values of the Bicaudate-Frontal Index (ventricular index) according to age groups.
Changes between groups 0–12 months* (P<0.001), >3–6 years* (P<0.002), >6–9 years, >9–12 years, >12–15 years* (P<0.001), >15–18 years* (P<0.001) in Group I and II were statistically significant (Table 9). Index value showed decrease according to the age (correlation coefficient of “–33”). Changes between consecutive age groups >3–6 years (P<0.005), >6–9 years (P<0.001), >9–12 years (P<0.001) and >12–15 years (P<0.001) in comparison to the “0–12 months” group showed a high statistical significance (Table 10).
Table 9.
Reference values of the Bicaudate-Frontal Index (ventricular index) for Group I.
| Age group | 10 | 25 | 50 | 75 | 90 | 10–90 norm | Mean ±SD |
|---|---|---|---|---|---|---|---|
| 0–12 months | 0.300 | 0.332 | 0.379 | 0.430 | 0.524 | 0.300–0.524 | 0.386±0.085 |
| >12–36 months | 0.235 | 0.250 | 0.293 | 0.365 | 0.429 | 0.235–0.429 | 0.316±0.088 |
| >3–6 years | 0.212 | 0.231 | 0.276 | 0.332 | 0.419 | 0.212–0.419 | 0.291±0.090 |
| >6–9 years | 0.222 | 0.241 | 0.287 | 0.321 | 0.370 | 0.222–0.370 | 0.290±0.064 |
| >9–12 years | 0.214 | 0.228 | 0.275 | 0.322 | 0.372 | 0.214–0.372 | 0.283±0.063 |
| >12–15 years | 0.219 | 0.233 | 0.281 | 0.322 | 0.376 | 0.219–0.376 | 0.285±0.061 |
| >15–18 years | 0.242 | 0.273 | 0.303 | 0.342 | 0.395 | 0.242–0.395 | 0.312±0.062 |
Table 10.
Comparative values of the Bicaudate-Frontal Index (ventricular index) for Group II.
| Age group | Min | Max | Mean ±SD |
|---|---|---|---|
| 0–12 months | 0.281 | 0.788 | 0.526±0.142 |
| >12–36 months | 0.182 | 0.931 | 0.417±0.192 |
| >3–6 years | 0.176 | 1.116 | 0.446±0.263 |
| >6–9 years | 0.125 | 0.770 | 0.404±0.191 |
| >9–12 years | 0.095 | 0.875 | 0.385±0.202 |
| >12–15 years | 0.167 | 0.885 | 0.460±0.212 |
| >15–18 years | 0.206 | 0.844 | 0.503±0205 |
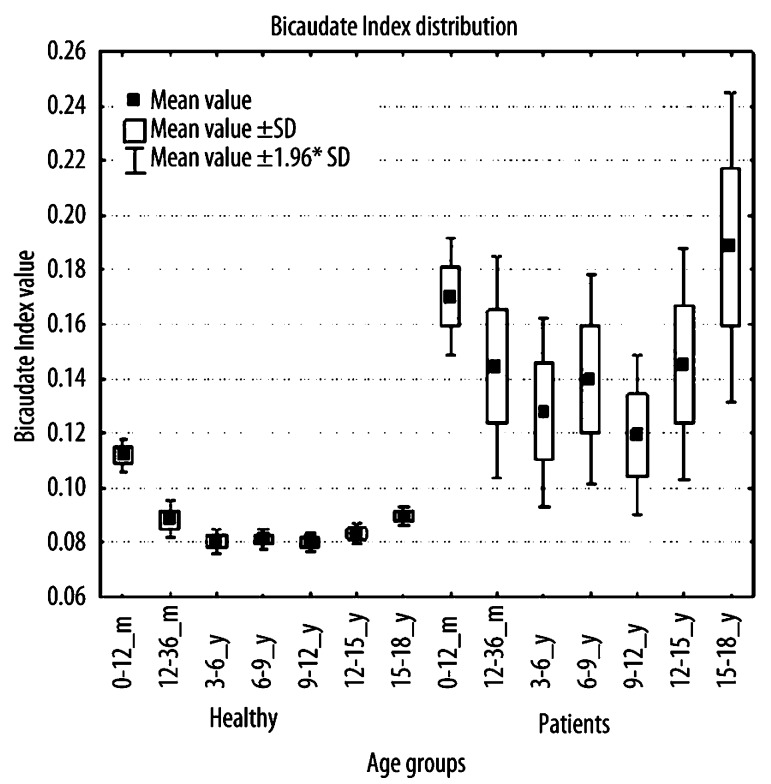
Bicaudate Index (BN/BNI) – minimum bicaudate nuclei distance divided by internal skull diameter measured along the same line (Figure 6).
Figure 6.
Distribution of mean values of the Bicaudate Index in particular age groups.
Changes between groups 0–12 months* (P<0.001), >12–36 months, >6–9 years* (P<0.003), >12–15 years* (P<0.004), >15–18 years* (P<0.001) in Group I and II were of statistical significance (Table 11). The index presented a decrease according to the age (correlation coefficient of ”−0.26”). No significant differences in the Bicaudate Index were found between consecutive age groups (P>0.01) (Table 12).
Table 11.
Reference values of the Bicaudate Index for Group I.
| Age group | 10 | 25 | 50 | 75 | 90 | 10–90 norm | Mean ±SD |
|---|---|---|---|---|---|---|---|
| 0–12 months | 0.080 | 0.091 | 0.109 | 0.131 | 0.152 | 0.080–0.152 | 0.113±0.032 |
| >12–36 months | 0.066 | 0.068 | 0.088 | 0.102 | 0.124 | 0.066–0.124 | 0.091±0.031 |
| >3–6 years | 0.059 | 0.064 | 0.076 | 0.091 | 0.120 | 0.059–0.120 | 0.083±0.026 |
| >6–9 years | 0.061 | 0.068 | 0.080 | 0.093 | 0.110 | 0.061–0.110 | 0.083±0.022 |
| >9–12 years | 0.061 | 0.065 | 0.076 | 0.093 | 0.107 | 0.061–0.107 | 0.081±0.021 |
| >12–15 years | 0.062 | 0.068 | 0.081 | 0.096 | 0.116 | 0.062–0.116 | 0.084±0.020 |
| >15–18 years | 0.072 | 0.078 | 0.089 | 0.100 | 0.118 | 0.072–0.118 | 0.091±0.018 |
Table 12.
Comparative values of the Bicaudate Index for Group II.
| Age group | Min | Max | Mean ±SD |
|---|---|---|---|
| 0–12 months | 0.079 | 0.360 | 0.170±0.063 |
| >12–36 months | 0.034 | 0.310 | 0.144±0.086 |
| >3–6 years | 0.049 | 0.249 | 0.128±0.061 |
| >6–9 years | 0.035 | 0.296 | 0.140±0.083 |
| >9–12 years | 0.022 | 0.255 | 0.119±0.067 |
| >12–15 years | 0.047 | 0.307 | 0.145±0.084 |
| >15–18 years | 0.058 | 0.290 | 0.188±0.092 |
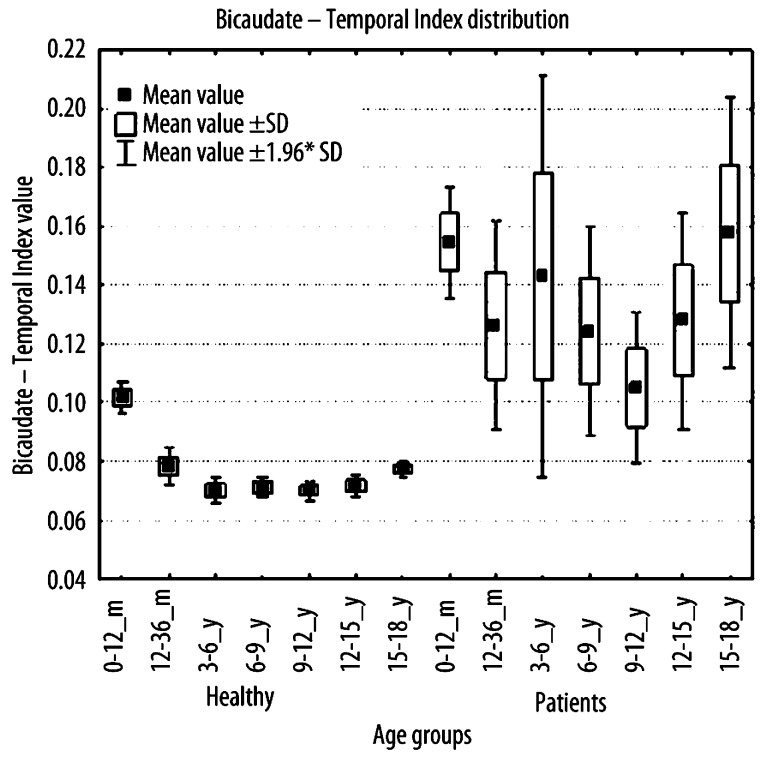
Bicaudate-Temporal Index (BN/G) – minimum bicaudate nuclei distance divided by maximum internal skull diameter (Figure 7).
Figure 7.
Distribution of mean values of the Bicaudate-Temporal index in particular age groups.
Changes between groups 0–12 months* (P<0.001), >12–36 months, >3–6 years* (P<0.001), >6–9 years* (P<0.001), >9–12 years, >12–15 years* (P<0.001), >15–18 years* (P<0.001) in Group I and II were statistically significant (Table 13). Index value showed a decrease according to the age (correlation coefficient of ”−0.32”). No significant differences in the Bicaudate –Temporal Index were found between consecutive age groups (P>0.01) (Table 14).
Table 13.
Reference values of the Bicaudate-Temporal Index for Group I.
| Age group | 10 | 25 | 50 | 75 | 90 | 10–90 norm | Mean ±SD |
|---|---|---|---|---|---|---|---|
| 0–12 months | 0.073 | 0.082 | 0.098 | 0.117 | 0.138 | 0.073–0.138 | 0.102±0.030 |
| >12–36 months | 0.058 | 0.063 | 0.075 | 0.089 | 0.110 | 0.058–0.110 | 0.081±0.029 |
| >3–6 years | 0.051 | 0.056 | 0.064 | 0.080 | 0.105 | 0.051–0.105 | 0.072±0.023 |
| >6–9 years | 0.053 | 0.060 | 0.068 | 0.081 | 0.098 | 0.053–0.098 | 0.072±0.020 |
| >9–12 years | 0.053 | 0.058 | 0.065 | 0.082 | 0.96 | 0.053–0.096 | 0.071±0.019 |
| >12–15 years | 0.052 | 0.059 | 0.070 | 0.084 | 0.100 | 0.052–0.100 | 0.073±0.019 |
| >15–18 years | 0.060 | 0.067 | 0.077 | 0.087 | 0.100 | 0.060–0.100 | 0.078±0.017 |
Table 14.
Comparative values of the Bicaudate-Temporal Index for Group II.
| Age group | Min | Max | Mean ± SD |
|---|---|---|---|
| 0–12 months | 0.068 | 0.323 | 0.154±0.056 |
| >12–36 months | 0.030 | 0.265 | 0.126±0.075 |
| >3–6 years | 0.045 | 0.490 | 0.143±0.121 |
| >6–9 years | 0.032 | 0.268 | 0.124±0.077 |
| >9–12 years | 0.019 | 0.233 | 0.105±0.059 |
| >12–15 years | 0.040 | 0.267 | 0.128±0.073 |
| >15–18 years | 0.049 | 0.247 | 0.158±0.074 |
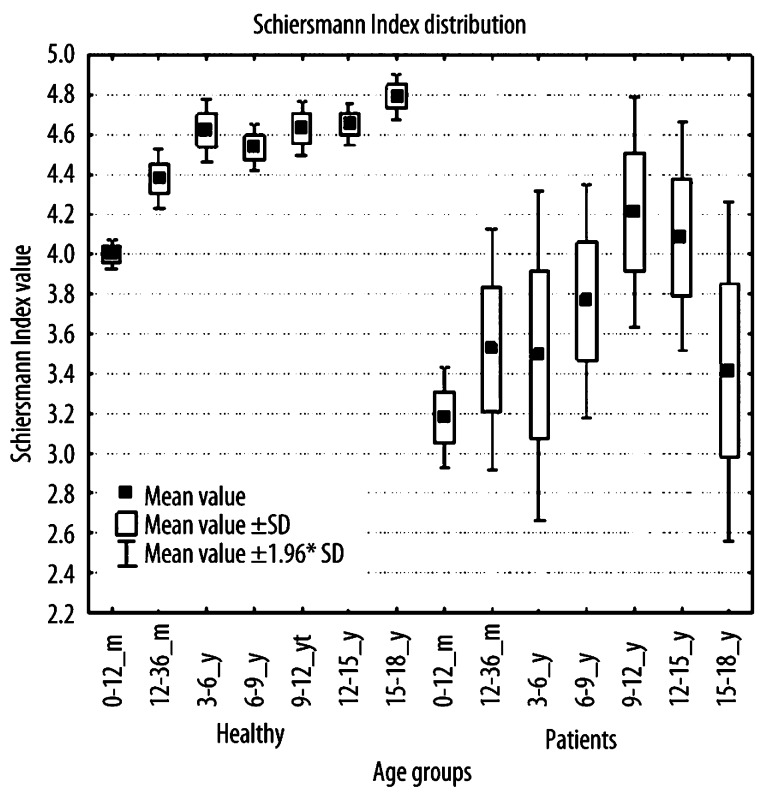
Schiersmann’s Index (H/E) – maximum external diameter of the skull divided by cella media distance (Figure 8).
Figure 8.
Distribution of mean values of the Schiersmann’s Index in particular age groups.
Statistically significant differences between age groups 0–12 months* (P<0.001), >12–36 months, >3–6 years* (P<0.001), >6–9 years, >15–18 years* (P<0.001) in Group I and II were statistically significant. The correlation coefficient of the presented index was 0.42. The index showed an increase according to the age (Table 15). Changes observed between age groups >3–6 years (P<0.02), >6–9 years (P<0.03), >9–12 years* (P<0.002), >12–15 years* (P<0.001), >15–18 years (P<0.001) in the Group I and II were of statistical significance. Changes between consecutive age groups were statistically significant with reference to group “012 months”, except for group >12–36 months (Table 16).
Table 15.
Reference values of the Schiersmann's Index for Group I.
| Age group | 10 | 25 | 50 | 75 | 90 | 10–90 norm | Mean ±SD |
|---|---|---|---|---|---|---|---|
| 0–12 months | 3,545 | 3.792 | 3.968 | 4.147 | 4.533 | 3.545–4.533 | 3.978±0.580 |
| >12–36 months | 3.879 | 4.061 | 4.250 | 4.517 | 5.375 | 3.879–5.375 | 4.413±0.708 |
| >3–6 years | 4.000 | 4.479 | 4.768 | 5.417 | 5.625 | 4.000–5.625 | 5.011±0.788 |
| >6–9 years | 3.912 | 4.108 | 4.498 | 4.863 | 5.481 | 3.912–5.481 | 4.548±0.680 |
| >9–12 years | 4.028 | 4.143 | 4.529 | 4.898 | 6.038 | 4.028–6.038 | 4.668±0.768 |
| >12–15 years | 3.977 | 4.277 | 4.636 | 5.041 | 5.480 | 3.977–5.480 | 4.719±0.801 |
| >15–18 years | 4.152 | 4.406 | 4.719 | 5.148 | 5.667 | 4.152–5.667 | 4.803±0.672 |
Table 16.
Comparative values of the Schiersmann's Index for Group II.
| Age group | Min | Max | Mean ± SD |
|---|---|---|---|
| 0–12 months | 1.403 | 4.750 | 3.181±0.739 |
| >12–36 months | 1.702 | 6.174 | 3.524±1.271 |
| >3–6 years | 1.753 | 6.318 | 3.494±1.461 |
| >6–9 years | 1.590 | 6.085 | 3.765±1.261 |
| >9–12 years | 2.084 | 6.667 | 4.211±1.320 |
| >12–15 years | 2.052 | 6.524 | 4.087±1.135 |
| >15–18 years | 2.038 | 6.042 | 3.415±1.376 |
Discussion
Current methods of imaging, and especially CT, are able to visualize changes in size and shape of the intracranial fluid spaces [2,5,13]. Changes of the ventricular system may be a result of different pathological conditions which may occur in infantry and childhood [5,14]. The volume of the ventricular system may be affected by a variety of conditions, which in turn can cause hydrocephalus. However, the size of the ventricular system in children can show individual or developmental changes. A more accurate assessment of changes of the ventricular system may be achieved by a quantitative evaluation of cerebral fluid compartments. Defining normal values for CSF spaces in childhood is essential for the diagnostics of all diseases and pathological changes within this system.
In the present study, reference values of the most often used indices were calculated.
Huckman Number is a useful parameter to evaluate the diameter of the anterior ventricular horn. The estimated norm ranged from 3.3 cm (as the 10th percentile for the “0–12 months” group) to 5 cm for the “>6–9 years” group, as the 90th percentile, which was the highest value for all age groups (Table 3). Changes of the index were age-dependent and so were the norms. Norms varied among consecutive age groups. Especially the lower border showed a strong correlation to age (from 3.3 cm for the youngest group to 4.0 cm for the oldest one). However, changes between groups were not statistically significant. There were no reports for analogous age groups. In the studies by Meese et al. [7], the mean Huckman Number was 3.5 cm for the group “0–2 years”, which was in accordance with the median value (3.9 cm) of our youngest age group (0–12 months).
For years, Evans’ Index has been commonly used in diagnostic imaging. Currently, because of a low diagnostic sensitivity and specificity of the index, it is described as insufficient, i.e. if occipital ventricular horns expand earlier than the anterior ones [4]. According to our data, the Evans’ Index reference value ranged from 0.218 for the “>6–9 years” group (as the 10th percentile) to 0.312 for the “0–12 months” group, as the 90th percentile, which was the highest value for all age groups (Table 5). There were no reports about developmental changes of the index. Kosourow et al. [9] reported a mean Evans’ Index value ranging from 0.22 to 0.28 in adults. The reported data were in accordance with the norm value for our oldest group (>15–18 years) equal to 0.230–0.276. It is known [8] that the Index value above 0.300 indicates a progressive hydrocephalus. However, the norm value found in our research for the “0–12 months” group was even higher and amounted to 0.312. Evans’ Index was only weakly age-dependent (correlation coefficient of ”–0.12”) but changes between consecutive age groups were not statistically significant.
Bifrontal Index results enabled us to establish its norm, ranging from 0.265 in the “>6–9 years” group, for the 10th percentile, to 0.380 in the “0–12 months” group, for the 90th percentile, which was the highest value in all age groups (Table 7). There were no reports describing developmental changes of the index. Previous reports have shown the index value of over 0.500 as the symptom of hydrocephalus, while the index level of less than 0.400 was found to be the reference value [8]. In the presented study, the norm value did not exceed 0.380, which was in agreement with previous reports. Index value decreased with age (correlation coefficient of ”0.18”).
The norm value of the Bicaudate-Frontal Index ranged from 0.212 in the “>3–6 years” group (for the 10th percentile) to 0.524 in the “0–12 months” group, for the 90th percentile, which was the highest value for all age groups (Table 9). There were no reports about developmental changes of the index. Index reference values reported by Meese et al. [7] amounted to ≥0.35 for the “0–2 years” group, which was in agreement with our reports (0.379 for the “012 months” group). The results of this study indicated that index value decreased with age (correlation coefficient of “–0.33”) and the highest levels of the index were observed for the “0–12 months” group. Changes of the index value between consecutive age groups were statistically significant in relation to values for the youngest group.
Bicaudate Index showed norm values at the level of 0.059 in the “3–6 years” group, for the 10th percentile and 0.152 in the “0–12 months” group, for the 90th percentile, which was the highest value for all age groups (Table 11). There were no data on developmental changes of the index. However, the norm value reported by Meese et al. [7] was below 0.200, which was in accordance with the norm value presented in our “0–12 months” group, i.e. 0.152. Index values decreased with age (correlation coefficient of ”–0.26”) and index level of more than 0.300 indicated a progressing hydrocephalus [8].
According to our data, norm values of the Bicaudate-Temporal Index ranged from 0.051 in the “>3–6 years” group, for the 10th percentile to 0.138 in the “0–12 months” group, for the 90th percentile, which was the highest for all age groups (Table 13). There were no data about developmental changes of the index. Norm values of the Bicaudate-Temporal Index, reported by Kosourow et al. [8] for adult patients ranged from 0.50 to 0.180 (which was a wider range than the one in our study, for the “>15–18 years” group, i.e. from 0.06 to 0.10. The obtained results showed index decrease with age (correlation coefficient of ”0.32”), with the highest value in the “0–12 months” group. Changes between the consecutive age groups were statistically significant in the ”>12–15 years” group, and “>12–36 years” group, in relation to the “0–12 months” group.
The results of direct linear measurements showed the size of the anterior horns decreasing with age. Comparative studies of the indices for anterior horns showed the greatest differences between age groups analogous to Group I and II for the Bicaudate-Frontal Index and the Bicaudate Index, which indicates their high sensitivity to pathological changes.
Analyzing the size of the lateral ventricles in children, we used indices concerning the entire skull size. Schiersmann’s Index enabled us to estimate developmental changes of the ventricular system regarding the skull size. In the presented study, the norm values of the Schiersmann’s Index ranged from 3.545 in the “0–12 months” group, for the 10th percentile, to 6.038 in the “>9–12 years” group, for the 90th percentile, which was the highest value for all age groups. A mean value of the index, reported by Falicki and Januszkiewicz [10] based on USG examinations of infants was 3.8, which was in accordance with our results obtained in the “0–12 months” group (median of 3.968). The index showed an increase with age (correlation coefficient of “0.42”).
The results of this study indicated that indices for ventricles change with age. However, particular compartments of the ventricular system do not grow uniformly. Indices describing the anterior horns decrease with age, as the Schiersmann’s Index. In most cases, the lateral ventricles are larger in the first year of life or in the first three years. Then, they start to decrease. The most significant changes of the ventricular size were noted after the 6th year of life. Lateral ventricular compartments develop in a uniform manner till the age of 15 (in the following groups: >6–9 years, >9–12 years, and >12–15 years). In the oldest group, i.e. >15–18 years, index values were in accordance with the level presented in the “>12–36 months” group (Table 15).
References:
- 1.Drews M, Strzyżewski K, Warzywoda M, et al. Significance of ultrasonography in diagnosis and treatment of hydrocephalus. Pol J Radiol. 1991;55(1–2):31–38. [Google Scholar]
- 2.Naidich T, Epstein F, Lin JP, et al. Evaluation of pediatric hydrocephalus by computed tomography. Radiology. 1976;119:337–45. doi: 10.1148/119.2.337. [DOI] [PubMed] [Google Scholar]
- 3.Prassopoulos P, Cavouras D. CT evaluation of normal CSF spaces in children: relationship to age, gender and cranial size. Eur J Radiol. 1994;18:22–5. doi: 10.1016/0720-048x(94)90359-x. [DOI] [PubMed] [Google Scholar]
- 4.Łosowska-Kaniewska D. Diagnostyka obrazowa wodogłowia. In: Zakrzewski, editor. Wodogłowie i inne zaburzenia krążenia płynu mózgowo rdzeniowego u dzieci Wydawnictwo Czelej. 2007. pp. 41–51. [Google Scholar]
- 5.Prassopoulos P, Cavouras D, Golfinopoulos S, et al. The size of the intra- and extraventricular cerebrospinal fluid compartments in children with idiopatic benign widening of the frontal subarachnoid space. Neuroradiology. 1995;37:418–21. doi: 10.1007/BF00588027. [DOI] [PubMed] [Google Scholar]
- 6.Łosowska-Kaniewska D. Diagnostic imaging of the congenital brain neoplasms. Pol J Radiol. 2008;73(2):48–52. [Google Scholar]
- 7.Meese W, Kluge W, Grumme T, et al. CT evaluation of the CSF spaces of healthy persons. Neuroradiology. 1980;19:131–6. doi: 10.1007/BF00342387. [DOI] [PubMed] [Google Scholar]
- 8.Maksymowicz W. Neurochirurgia w zarysie. In: Maksymowicz, editor. PZWL. 1999. pp. 155–6. Wodogłowie. [Google Scholar]
- 9.Kosourov AK, Gaivoronskij IV, Rokhlin GD, et al. In vivo assessment of various parameters of the brain ventricles with magnetic resonance tomography. Morfologiia. 2002;122(40):71–3. [PubMed] [Google Scholar]
- 10.Falicki Z, Januszkiewicz-Grabias A. Wyznaczanie wodogłowia wewnętrznego przy użyciu parametru powierzchniowego. Psychiatr Pol. 1967;1(5):529–32. [PubMed] [Google Scholar]
- 11.Krawczyński M. Diagnostyka auksologiczna In: Krawczyński M. Norma kliniczna w pediatrii. PZWL. 2005:15–37. [Google Scholar]
- 12.Silverwood RJ, Cole TJ. Statistical Opinion. Statistical methods for constructing gestational age-related reference intervals and centile charts for fetal size. Ultrasound in Obstet Gynecol. 2007;29:6–13. doi: 10.1002/uog.3911. [DOI] [PubMed] [Google Scholar]
- 13.O’Hayon BB, Drake JM, Ossip MG, et al. M. Frontal and occipital horn ratio: a linear estimate of ventricular size for multiple imaging modalities in pediatric hydrocephalus. Pediatr Neurosurg. 1998;29:245–9. doi: 10.1159/000028730. [DOI] [PubMed] [Google Scholar]
- 14.Karbowski K, Urbanik A, Chrzan R. Measuring methods of objects in CT images. Pol J Radiol. 2009;74(4):64–8. [Google Scholar]
- 15.Walecka I, Sicińska J, Furmanek M, et al. Value of computed tomography and magnetic resonance imaging in diagnosis of CNS. Pol J Radiol. 2006;71(1):7–12. [Google Scholar]


