

Abstract
In all eukaryotes, the ribosomal RNA genes are stably inherited redundant elements. In Drosophila melanogaster, the presence of a Ybb− chromosome in males, or the maternal presence of the Ribosomal exchange (Rex) element, induces magnification: a heritable increase of rDNA copy number. To date, several alternative classes of mechanisms have been proposed for magnification: in situ replication or extra-chromosomal replication, either of which might act on short or extended strings of rDNA units, or unequal sister chromatid exchange. To eliminate some of these hypotheses, none of which has been clearly proven, we examined molecular-variant composition and compared genetic maps of the rDNA in the bb2 mutant and in some magnified bb+ alleles. The genetic markers used are molecular-length variants of IGS sequences and of R1 and R2 mobile elements present in many 28S sequences. Direct comparison of PCR products does not reveal any particularly intensified electrophoretic bands in magnified alleles compared to the nonmagnified bb2 allele. Hence, the increase of rDNA copy number is diluted among multiple variants. We can therefore reject mechanisms of magnification based on multiple rounds of replication of short strings. Moreover, we find no changes of marker order when pre- and postmagnification maps are compared. Thus, we can further restrict the possible mechanisms to two: replication in situ of an extended string of rDNA units or unequal exchange between sister chromatids.
Keywords: Drosophila melanogaster, rDNA magnification, rDNA mapping, Rex, Ybb−
IN eukaryotes the 18S, 5.8/2S, and 28S rDNAs are contained in the same transcription unit, and many (hundreds to thousands) of rDNA transcription units are organized in clusters located in one or a few chromosomes. In Drosophila melanogaster each rDNA copy, Figure 1, is about 8 kb long and, in addition to the coding sequences, includes an external transcribed spacer (ETS) upstream of the 18S sequence and two internal transcribed spacers (ITS-1 and ITS-2) located between the 18S and 5.8/2S sequences and the 5.8/2S and 28S sequences, respectively (Wellauer and Dawid 1977; Tautz et al. 1988). Contiguous rDNA units are separated by intergenic spacers (IGS). The variable length of the IGS can reach 10–11 kb because it contains diverse numbers of 95-, 330-, and 240-bp-long subrepeats (Pellegrini et al. 1977; Long and Dawid 1980; Simeone et al. 1985; Tautz et al. 1987; Glover 1991).
Figure 1 .

A typical rDNA unit of D. melanogaster: each rDNA unit contains (solid bars) the 18S, 5.8S/2S, and 28S coding sequences, and (thin bars) an external transcribed spacer (ETS) and two internal transcribed spacers (ITS). The 28S contains the insertion sites for both R2 and R1, separated by about 60 bp (Jakubczak et al. 1990). R2 elements are 3.4 kb long and R1 elements are 5.5 kb long, although both elements (open bars) are frequently and variably truncated at their 5′ ends. Adjacent units are separated by an intergenic spacer (IGS, thin bar), consisting of various numbers of 95-, 330-, and 240-bp-long subregions. R2 and R1 variants were simultaneously amplified by PCR, using one primer directed upstream of the R2 insertion site and the other directed downstream of the R1 insertion site. IGS variants were PCR amplified using two different nearby pairs of primers to provide a control for specificity.
The genome of wild-type D. melanogaster has two similar rDNA clusters. A 2800-kb cluster is in the pericentromeric heterochromatin of the X chromosome long arm. The other, 2200 kb long, is located at the base of the short arm of the Y chromosome (Ritossa 1976; Polanco et al. 1998). Because of their heterochromatic locations, meiotic recombination in the rDNA arrays is rare. Both clusters consist of about 200–250 rDNA units (Tartof 1971; Tautz et al. 1988), in both head-to-tail (tandem) and head-to-head (reversed) orientations, with a variable number of orientation switches in different stocks (Robbins and Swanson 1988). Cytologically, the rDNA cluster corresponds to the nucleolar organizer (NO) (Cooper 1959; Ritossa and Spiegelman 1965); the chromosomal site of nucleolus formation (McClintock 1934).
Genetically, the rDNA corresponds to the bobbed locus (bb; 1-66.0) (Ritossa 1976). rDNA deficiency causes several pleiotropic effects: some related to rDNA expression, others related to rDNA structure. First, during achiasmatic male meiosis, pairing of the X and Y chromosomes at the level of the 240-bp subregions of the X chromosome IGS sequences (McKee et al. 1998) ensures regular disjunction. Thus, in male meiosis, deletions of the X chromosome rDNA yield high sex-chromosome nondisjunction. Second, rDNA deficiency produces meiotic drive, distortion of reciprocal genotype ratios (X:Y and XY:0) in recovered gametes (Sandler and Novitski 1957) caused by alteration of genotype-dependent sperm functionality. The rDNA-free In(1)sc4Lsc8R X chromosome, for example, produces a high frequency of nondisjunction (XY ↔ 0) and yields a genotype-specific 0 > X > Y > XY sperm-recovery progression from most functional to least functional (Sandler and Braver 1954; McKee and Lindsley 1987). Third, rDNA deficiency determines the hypomorphic bobbed (bb) phenotype, described by Bridges (1916) as a recessive trait characterized by slow development, production of short and thin thoracic bristles, thinning, and, sometimes, etching of the abdominal cuticular tergites and by deposition of dechorionated eggs. All of these morphological features reflect the reduced protein synthetic ability caused by lack of rRNA (Ritossa et al. 1966).
The various bobbed alleles are denoted, according to their relative rDNA loss-of function, as:
bb0 or bbl (lethal) alleles, having an amount of rDNA incompatible with life, <∼10% of wild type (Spencer 1944; Terracol and Prud’homme 1986).
bb alleles, having a reduced number of rDNA copies (about half or less of wild type), but sufficient for life. For example, the bb2 chromosome carries about 120 rDNA units (Tartof 1973).
bb+ alleles, having a wild type number of functional rDNA copies, about 200–250 copies (Tartof 1973).
Although the most “objective” method for distinguishing between bb and bb+ phenotypes is measuring the length of the scutellar bristles, all of the bb phenotypes are quite variable from fly to fly and, except for some overlap, bb and bb+ are also distinguishable “by eye,” as shown by Boschi (2007; M. Boschi, E. E. Swanson, A. Bianciardi, M. Belloni, and L. G. Robbins, unpublished results).
As in other insects (Jakubczak et al. 1991; Burke et al. 1993; Lathe et al. 1995), the rDNA of D. melanogaster can also contain two kinds of non-LTR (non-long terminal repeat) retrotransposable elements named R1 and R2. Many X chromosome rDNA repeats are inactivated by the insertion of an R1 retrotransposon (Wellauer and Dawid 1977; White and Hogness 1977) and both X and Y chromosome copies may be interrupted by an R2 element (Dawid and Wellauer 1978; Long and Dawid 1979; Long et al. 1981; Eickbush and Eickbush 1995). Although R1 and R2 are only remotely evolutionarily related (Malik et al. 1999), both have insertion sites in the 28S coding sequence, <100 bp apart (Roiha et al. 1981). A full-length R1 copy is about 5.5 kb long and a full-length R2 insertion is about 3.4 kb long, but both retrotransposons often have variable-length deletions at their 5′end and also cause deletions of genomic regions located upstream of their insertion sites (Jakubczak et al. 1990; George et al. 1996).
rDNA redundancy is generally stable (Tartof 1974a,b): for example, spontaneous reversion of a bb2 allele (having 120 rDNA copies) to bb+, an increase of ∼80 copies, has a frequency of <1/20,000 (Hawley and Marcus 1989). Several processes, however, alter rDNA redundancy. Some of these operate only at a somatic level, such as compensation (Tartof 1971; Tartof 1973; Endow 1980) and independent rDNA polytenization in salivary gland chromosomes (Endow and Glover 1979 ; Endow 1982, 1983; Belikoff and Beckingham 1985a,b). Other processes have heritable effects, such as rare rDNA-mediated recombination between the sex chromosomes (X and Y or X and X; Williams et al. 1989), intrachromosomal rDNA recombination induced by Rex (described below), or another process, called magnification (Ritossa 1968), which is the focus of this work.
Magnification is the heritable increase of copy number of the X chromosome rDNA array. It was discovered by Ritossa in 1968 as phenotypic reversion from bb to bb+ of bb/Ybb− males accompanied by an increase of rDNA copy number. Spontaneous magnification is rare, but at least two conditions can increase magnification frequency. One is the presence of the Ybb− chromosome in male germ cells. The other is presence of Rex in the mother, which, in addition to the inter-array rDNA crossovers described below, provokes magnification of single rDNA arrays in early embryonic mitoses.
Magnification events are easily identifiable as phenotypic reversion from bb (a few functional rDNA copies) to bb+ (a sufficient amount of physiologically functional rDNA to yield a wildype phenotype). Boschi (2007; M. Boschi, E. E. Swanson, A. Bianciardi, M. Belloni, and L. G. Robbins, unpublished results) studied magnification of bb2 either induced by presence of the Ybb− chromosome in males or induced by maternal presence of Rex. Although these induce magnification at different times, Rex acting during embryogenesis, especially at the first mitotic division, and Ybb− acting during spermatogenesis, both produce the same frequency of magnification: 3.8% (24/627) for Rex, and 2.9% (77/2701) for Ybb− (χ2 = 1.54, 1 d.f., P = 0.214). Variability of expression and penetrance was extensive and similar for the two samples, as well as for the starting bb2 allele and a control bb+ array. To assess stability of the magnified alleles, Boschi also followed bobbed phenotype for several generations of a genealogic tree. Although some progeny of magnified females have a bobbed phenotype, they nevertheless transmit a magnified allele since many of their progeny again express a wildtype, magnified, phenotype. Hence, transmission of magnified alleles is stable even though they are variably expressed in individuals.
A number of mechanisms have been proposed for magnification, but experimental results have been contradictory. Although this was a very active area of research at one time, there is little recent literature and many readers will not be aware of much of this background. Hence, a summary of prior work on the mechanism of magnification may be found in Supporting Information, File S1.
The present work aims to clarify the mechanism or mechanisms of magnification with another approach: comparison of the rDNA map of a starting, viable bobbed allele, bb2, carrying about 120 rDNA copies (Tartof 1973), with those of several chromosomes produced by magnification of bb2. Mapping rDNA variants within arrays should allow us to distinguish between models that change, or do not change, the molecular order. Direct molecular mapping of an entire rDNA array is, however, not feasible because of its repetitive structure. Thus, our approach is to generate classical recombination-based genetic maps in which we plot the distribution of rDNA molecular markers in the regions delimited by the crossovers.
Because of its heterochromatic nature, rDNA is normally refractory to recombination. Hence, we have induced rDNA recombination using the maternal-effect Rex element. The Rex (Ribosomal exchange) element (Robbins 1981) is a genetically-characterized but molecularly-unidentified neomorphic, repeated element that maps within the X chromosome rDNA (Rasooly and Robbins 1991). Rex has a temperature-sensitive, semidominant, maternal action that promotes frequent early-embryonic mitotic exchange between two separated rDNA arrays of the same chromosome (Robbins 1981; Swanson 1987). Numerous suppressors of Rex (Su(Rex)), some autosomal and others X linked, exist in laboratory stocks and in flies isolated from natural populations (Rasooly and Robbins 1991). From its maternal effect, it is inferred that Rex expression in females yields packaging of a Rex product into eggs. The Rex product then affects rDNA stability during early stages of embryonic development (Swanson 1987). Cytologically, at least 1/3 of embryos produced by Rex females suffer rDNA-specific chromosome damage, and most of these embryos die (Robbins and Pimpinelli 1994; Robbins 1996). However, about 1–8% of surviving adults have undergone recombination between two rDNA arrays, mostly before S phase of the first division (Robbins 1981).
Rex-induced intra-chromosomal rDNA recombination between two arrays in a single chromosome generates extensive deletions or inversions (Robbins 1981; Swanson 1987) depending on the orientation of the paired rDNA arrays. Recombination of opposite-orientation copies, a hairpin exchange, Figure 2A, inverts everything between the two arrays, but leaves gene content intact. Because each inverted chromosome carries both products of a single exchange, these chromosomes are particularly valuable for understanding the recombination mechanism (Rasooly and Robbins 1991; Crawley 1996). For example, one or more rDNA variants located near the exchange site are frequently missing from both crossover arrays, indicating that these exchanges were accompanied by loss of material. These recombinants are difficult to detect, however, because inversion changes only the order of the genes and these chromosomes cannot be identified using morphological markers.
Figure 2 .

“Hairpin” and “spiral” recombination induced by Rex in target chromosomes duplicated for the nucleolus organizer: the target chromosome carries a pericentromeric rDNA array (black solid bar) and a distal rDNA array (red solid bar). Rex induces mitotic recombination between the two rDNA arrays that can pair in two ways. (A) A hairpin exchange inverts all of the chromatin between the sites of exchange. (B) A spiral exchange generates a minichromosome deficient for all of the chromatin between the exchange sites and an acentric ring that contains the deleted chromatin. Five molecular length variants (D, A, C, B, and A, white type) are shown for the basal array, and four (G, F, E and D, blue type) for the distal array. Because the D variant is present in both arrays it is not a recombination marker. To distinguish between the two A variants a quantitative analysis is needed.
Recombination between same-orientation repeats, a spiral exchange, Figure 2B, deletes everything between the two arrays, removing this material to a circular acentric chromosome that is lost because of the absence of the centromere. For the target diagramed in the figure, the recovered centric product is a minichromosome that contains only the material proximal to the centromeric rDNA array, the crossover rDNA array and the region distal to the telomeric rDNA array (Robbins and Swanson 1988). Because of the loss of nearly all of the X euchromatin, a female zygote in which this event takes place during the first mitotic division develops as a male, while the less-frequent spiral exchanges that take place after S-phase of the first division yield gynandromorphs; part female (non recombinant) and part male (recombinant) mosaics.
Consistent with all of these observations, but by no means demonstrated, is the notion that Rex produces an endonuclease, perhaps encoded by a de-repressed retrotrasposon (such as an R1 or R2 element). That endunuclease, packaged into the oocyte, then damages the rDNA leading to embryonic death, repair to a normal karyotype, or a crossover-generating repair (de Cicco and Glover 1983; Hawley and Marcus 1989; Robbins and Pimpinelli 1994; Robbins 1996).
Because Rex does not promote exchanges between homologs, but only between two arrays in a single chromosome, each array to be mapped was inserted into a target chromosome containing a second array located near the telomere. The same distal array, Tp(1;1)scV2, was used in all targets. Rex-induced spiral intrachromosomal exchange between the two rDNA arrays produces minichromosomes that contain only the portion of the centromeric array proximal to the exchange and the portion of the telomeric array distal to the exchange. All of the remaining chromatin between the exchange points, including all of the euchromatin, is lost as an acentric ring chromosome (Figure 2B).
Convenient rDNA markers are the lengths of inter-genic spacers (IGS) and the presence/absence and length of R1 and R2 retrotransposons (Figure 1). Both kinds of variant are detectable and measurable through PCR, using primers targeting sequences close upstream and downstream from the IGS or retrotransposon insertion sites. Mapping of the centromeric array has to be based on those variants that are present in the centromeric array but absent in the telomeric array. Variants that are present in both arrays are generally not very useful because they are the equivalent of homozygous mutants. Occasionally, a homozygous variant may be lost in the crossover produced by a given spiral exchange (such as the D variant in the example of Figure 2B) and in that case it is mappable – the loss of the variant indicates that one copy (or cluster of copies) is distal to the exchange within the centromeric array and that the other copy is proximal to the exchange within the distal array. Variants common to both arrays, even in such mappable cases, do not, however, add any detail to the map because they do not define additional, not otherwise identified, exchange sites.
Those variants that are present only in the distal array can contribute only to the mapping of the distal array. Because the aim of this project is to map the rDNA before and after magnification, mapping the partner array doesn’t serve any purpose for understanding the mechanism of magnification. Because the distal array was never exposed to a magnifying environment, however, its map does provide a useful control. The multiplicity of steps required for this analysis have many points at which artifacts might be introduced. A nonexhaustive list includes vagaries of PCR specificity or kinetics, mis-reading or mis-interpretation of the gels, or Rex-provoked events during generation of the crossover minichromosomes that are more complex than simple two-strand single exchanges. Any anomalies that are equally present in both the partner-array mapping and in the bb2 and bbM mapping, however, have nothing to do with magnification.
The various proposed magnification mechanisms would yield different patterns of variants within magnified arrays (Figure 3). In the ‘clonal chromosome replication’ model (Terracol 1987) a cluster of adjacent rDNA copies, or a single rDNA unit, amplifies in situ through a single duplication or reiterated replications. The copy-number increase depends on both the number of replications and the number of rDNA repeats in the sequence that is copied. For example, an increase of 80 rDNA repeats could be obtained as either 80 copies of a single rDNA unit, or as 40 copies of a pair of rDNA units, or from a single duplication of a region containing 80 rDNA units. There may be few replicates of an extended group of copies (A), or many copies of identical rDNA repeats (B), but the new rDNA repeats are adjacent to the starting rDNA cluster/unit and the order of variants is unchanged.
Figure 3 .

Magnification products: depending on the mechanism involved, magnification could yield five different kinds of products. A starting chromosome is diagramed that carries seven distinguishable regions, indicated as variously colored rectangles. (A) Limited in situ replication of a long region (red, pink, pale blue, and dark blue rectangles) generates elongated rDNAs that carry a few adjacent copies of the template region. (B) Extensive in situ replication of a short region (red rectangle) generates magnified arrays carrying many adjacent copies of the template region. (C) Limited extrachromosomal replication of a long region generates arrays that carry several, not necessarily adjacent, copies of the template. (D) Extensive extrachromosomal replication of a short segment generates rDNAs carrying many copies of the template that need not be adjacent to either the template or to each other. (E) Unequal exchange between sister chromatids generates a magnified array carrying a duplication of the region delimited by the displaced exchange sites and a reduced array that has lost this region.
In the ‘extra-chromosomal over-replication’ model (Ritossa 1968) a group of adjacent rDNA repeats, or a single rDNA unit, excises from the X chromosome. Through duplication or reiterated replication, these copies amplify and finally reintegrate into the original rDNA array, probably moved with respect to their original location. Moderate extra-chromosomal over-replication of an extended group of rDNA copies produces strings of identical clusters (C). Reiterated extra-chromosomal replication of a single template rDNA unit produces many identical rDNA repeats, that reintegrate at one or more sites in the rDNA, again not necessarily close to the original copy nor necessarily close to each other (D). The location of new rDNA repeats with respect to the original template sequence, only adjacent (hypotheses A and B) or also distant (hypotheses C and D), allows discrimination between in situ and extra-chromosomal over-replication models; if the bb2 order of markers is maintained in the maps of the magnified alleles, we would have to discard both extra-chromosomal over-replication models.
In the model of ‘unequal exchange between sister chromatids’ (Tartof 1974), magnification can produce only adjacent duplication of an extended string of rDNA repeats, having a length equal to the displacement of the exchange sites (hypothesis E). Distinguishing between products of unequal exchange and those produced through replication depends on the degree of amplification. Products of unequal exchanges are indistinguishable from products of a single in situ replication because both would only duplicate a string of multiple rDNA units and neither would change map order. Multiple rounds of replication, however, would yield products with multiple copies, rather than just a duplication, of the amplified units.
Extensive replication of short segments could be detected as increased copy number of one or a few variants (or possibly as expansion of a segment of the genetic map). The difference between in situ events and insertion of extra-chromosomal replicates, however, can be detected only by comparison of the genetic maps of the starting and magnified arrays. For this, we used an extension of the method invented by Scott Williams for mapping rDNA using rare spontaneous crossovers (Williams et al. 1989, reviewed in Williams and Robbins 1992).
Materials and Methods
Technical problems
This kind of genetic mapping requires genetic, molecular and analytic manipulations. Since each stage is subject to experimental error, the final results carry a progressive accumulation of errors. This kind of analysis can not localize each copy of a multi-copy marker, but, with care and with appropriate controls, can yield a semiquantitative map that allows discrimination among the various models. Some of the things to bear in mind are:
The bb2 allele, the magnified alleles and the relative minichromosomes are maintained in balanced strains that also contain other sources of rDNA. For molecular analysis, however, the genomes have to be free of these extraneous sources of rDNA. Hence, one or more generations are needed to establish a stock, and at least one generation of crossing is needed to place the array to be analyzed in a background free of other rDNA. The rDNA arrays are assumed to remain stable during these steps, but this has not been demonstrated.
Somatic rDNA copy number is variable, and DNA is extracted from whole adults rather than just germ cells. If DNA were extracted from single adults, one would not know whether any differences seen were just somatic. Hence, DNA samples were extracted from 200-250 adults to average the somatic variation.
Semiquantitative amplification requires that different copy length variants undergo PCR with the same pseudo-first-order kinetics. IGS and R2/1 sequences vary in length by as much as 10-fold, requiring different optimal elongation conditions. We chose an elongation time sufficient for the longest sequences. Other problems include the difficulty of reproducing the same physical-chemical conditions in different reaction buffers, the design of good primers given the highly repetitive rDNA structure, and local structural variations of the rDNA that might affect primer specificity independently of nucleotide sequence.
Post PCR processing (gel electrophoresis, ethidium bromide staining and digital photography) also could introduce artifacts mainly because of inequalities of local gel concentration and staining, variation in light intensity across the trans-illuminator, and optical distortion. Given these problems, a photometric analysis of the gels could be misleading and we relied more on our visual judgement, replicate reactions, and, when available, internal controls.
Overview of general principles
Because of the complexity of the analysis, we first present an overview and then provide more detailed explanations of some aspects, such as map construction.
The work has a genetic initial part, an intermediate bio-molecular part and a final analytical part. The genetic part includes (1) generation of magnified chromosomes, (2) introduction of these arrays into target chromosomes having a second rDNA array near the telomere, (3) generation of sets of crossover minichromosomes, and (4) production of genotypes in which the array to be analyzed is the only source of rDNA. The first three steps preceded this work and will be described in detail in a separate article (M. Boschi, E. E. Swanson, A. Bianciardi, M. Belloni, and L. G. Robbins, unpublished results). They are only briefly reviewed here. The bio-molecular, intermediate, part consists of genomic DNA extraction from adults, PCR and electrophoretic separation of PCR products. The analytical part, which includes analysis of the gels and interpretation of the data to generate the genetic maps, is presented in Results.
Induction of magnification
To test Ybb−-dependent magnification, cv v car bb2/BSYbb− males were crossed with In(1)sc4Lsc8R, y wa B/y females (Boschi 2007; M. Boschi, E. E. Swanson, A. Bianciardi, M. Belloni, and L. G. Robbins, unpublished results). Magnified, paternally-transmitted X chromosomes, were recovered as revertant (bb2 to bb+) Bar daughters. In order to test Rex-dependent magnification, cv v car bb2/Y males were crossed with In(1)sc4Lsc8R, y wa B/y Rex females and magnified products (paternally-transmitted X chromosomes that had been exposed to Rex ooplasm) were recovered as Bar bb+ daughters. Large samples of magnified chromosomes were generated for phenotypic and basic genetic characterization. Of these, ten Ybb−-magnified alleles (bbM18, bbM19, bbM20, bbM22, bbM23, bbM25, bbM26, bbM27, bbM28 and bbM29) and fourteen Rex-magnified alleles (bbM1, bbM2, bbM3, bbM4, bbM5, bbM6, bbM7, bbM8, bbM10, bbM11, bbM15, bbM16, bbM17 and bbM38), each one from a separate cross and therefore necessarily produced by independent magnification events, were kept as cv v car bbM/Y ♂ × C(1)DX, y f/Y ♀ stocks.
Production of target chromosomes
A single Tp(1;1)scV2 Df(1)X1, Bx X1 chromosome carrying an rDNA array transposed to a near-telomere location was used as the source of the partner array for all target chromosomes. Single crossovers between the Tp chromosome and the chromosomes carrying bb2 or a magnified array yield two-array targets, kept as Tp(1;1)scV2 cv (v) bbx Bx+ car/Y ♂ × C(1)DX, y f/Y ♀ stocks, where bbx stands for either bb2 or one of the bbM arrays.
Exposure of target chromosomes to Rex action
Tp(1;1)scV2 cv (v) bbx Bx+ car/Y males were crossed with y Rex/attached-XY, y w Df(1)259 females producing Tp(1;1)scV2 cv (v) bbx Bx+ car/attached-XY, y w Df(1)259 female zygotes. In some of these zygotes, Rex’s maternal action provokes spiral intra-chromosomal recombination between the two rDNA arrays. The resulting minichromosomes contain the proximal portion of the pericentromeric rDNA array and the distal portion of the telomeric, partner, rDNA array. The rest of the target chromosome is lost as a circular acentric chromosome. These female zygotes therefore develop into male adults. Because the minichromosome’s homolog is an attached-XY, these males are fertile. The small Df(1)259 deletion near the telomere of the attached-XY ensures that the minichromosome can not be lost from the attached-XY, y w Df(1)259/minichromosome, y+ ♂ × C(1)RM, y wa Su(wa)/minichromosome, y+ ♀ stocks. The stability of these stocks is not perfect, however. In some cases, as we discovered when we wanted to collect new DNA samples after several months in culture, detachments of either the attached-XY or C(1)RM chromosomes do occur. Because presence of free-X chromosomes in a stock allows the generation of viable minichromosome-free genotypes, periodic selection is actually required to avoid loss of the stocks.
Uncovering of rDNA arrays
For the analysis of bb2, bbM and Tp alleles, cv v car bbx/Y or Tp(1;1)scV2 Df(1)X1, Bx X1/Y males were crossed with C(1)RM, y wa Su(wa)/0 females, producing sterile cv v car bbx/0 or Tp(1;1)scV2 Df(1)X1, Bx X1/0 males respectively. For the analysis of minichromosomes, genomic DNA was extracted mostly from C(1)DX, y f/minichromosome, y+ females produced by minichromosome, y+/attached-XY, y w Df(1)259 ♂ × C(1)DX, y f/BSY ♀ crosses. As a control, some extractions were also made from sterile In(1)sc4Lsc8R, y wa B/minichromosome, y+ males produced by a In(1)sc4Lsc8R, y wa B/Y ♂ × C(1)DX, y f/minichromosome y+ ♀ cross.
Preparation of genomic DNA
For each allele, we collected about 200-250 adults, all of the same genotype, but not necessarily sibs. DNA extraction followed the protocol of Bender et al. (1983) as modified by T. Friedman (personal communication). Extracted DNA was purified on Elutip-D columns following the manufacturer’s protocol. Subsequently, DNA concentrations were measured fluorometrically using PicoGreen (Invitrogen) and samples were diluted in H2O to 25ng/ml for PCR.
PCR
PCR primers were first determined in silico by analyzing the GenBank M21017 rDNA nucleotide sequence. Subsequently, suitability of the primer pairs was verified experimentally. As indicated in Figure 1, IGS variants were amplified using the IGS-F primer (5′-CTAAGGTCGTATCCGTGCTG-3′) targeting a sequence located at the 3′-end of the 28S and the IGS-R primer (5′-CAAGTCCCGTGTTCAAAAAG-3′) targeting a sequence close to the beginning of the promoter leader region (ETS). A second pair of IGS primers, IGS-F1 (5′-CGACAATGGATGTGATGCCAATG-3′) and IGS-R1 (5′-GGAGCCAAGTCCCGTGTTCAAAAAG-3′), was also used to test target specificity; the two pairs of primers generate the same spectrum of bands with one set displaced respect to the other in accord with the different spacing of the primers. R2/1 variants were amplified using the R2/1-F primer (5′-CGGGTCAACGGCGGGAGTAA-3′) targeting a sequence located close upstream to the integration site of R2, and the R2/1-R primer (5′-TCCCTACCTGGCAATGTCCT-3′) targeting a sequence located immediately downstream of the integration site of R1. Hence, insertions of both R1 and R2 are detected in the same reaction, but we can not tell which bands contain R1 and which contain R2. Both PCR amplifications, of IGS and of R2/1 variants, were carried out using the TaKaRa LA Taq kit in volumes of 25 μl (13.25 μl of 25 ng/ml DNA; 2.5 μl of 10X buffer; 2.5 μl of 25 mM MgCl2; 4 μl of 2.5 mM dNTP mix; 1.25 μl of 10 μM F-primer; 1.25 μl of 10 μM R-primer; 0.25 μl of 5 U/μl TaKaRa LA Taq polymerase). Reactions were run in a GeneAmp PCR System 2700 Thermal Cycler set with a preliminary denaturation phase (2’ @ 94°), followed by 30 cycles of amplification, each consisting of: denaturation (40” @ 94°), annealing (1’ @ 50° for IGS or 1’ @ 53° for R2/1) and elongation (10’ @ 66°). After the amplification, the samples were held 10’ @ 72°. In these conditions, the kinetics of PCR is close enough to pseudo-first order that the amount of product varies with input DNA concentration (Figure 4A), and additional cycles beyond the 30 used for the experiments continue to yield additional product (data not shown).
Figure 4 .

R2/1 variant composition of bb2 and the magnified alleles: (A) Electrophoresis of three increasing concentrations (1X, 2X, and 3X) from six independent R2/1 PCR amplifications of bb2. (B) R2/1 variants of bb2 and of the bbM1, bbM2, bbM3, bbM4, bbM5, bbM6, bbM7, bbM8, bbM10, bbM11, bbM15, bbM16, bbm17, and bbM38 alleles produced by Rex-induced magnification of bb2. The bb2 sample, for unknown reasons, amplified poorly in this run. (C) R2/1 variants of the bbM18, bbM19, bbM20, bbM22, bbM23, bbM25, bbM26, bbM27, bbM28, and bbM29 alleles produced by Ybb–-induced magnification of bb2. In this particular run, bbM29 failed to amplify. The R2/1 variants are up to 6 kb in length. The 550-bp-long product produced by amplification of retrotransposon-free (functional) rDNA units is so abundant that the band is saturated and, therefore, not quantifiable. The 3.3- and 1-kb-long variants in the bbM10 and bbM25 lanes, indicated by the right-pointing arrowhead, are two exceptional new bands that are not present in bb2 nor in any of the other magnified alleles.
Electrophoresis
PCR products were separated by horizontal electrophoresis in 20 cM × 40 cM 1% agarose buffer gels in 0.5X TBE run at 60 Volts for 26-30 h. Gels were stained for 20’ in Ethidium Bromide, rinsed 10’ in H20 and photographed on a UV trans-illuminator, with a 585nM bandpass-filtered Nikon coolpix 4500 digital camera.
Results
Analysis
An overview of the variants, both R2/1 and IGS, of all of the analyzed alleles is shown in Figures 4 and 5, respectively. Both the IGS and R2/1 variants range up to 6 kb in length. The 550 bp long R2/1 product is actually the retrotransposon-free repeat. This is the most common variant and is abundant enough to saturate the signal.
Figure 5 .

IGS variant composition of bb2 and the magnified alleles: (A) Six lanes of the IGS PCR products for bb2 samples from distinct DNA extractions. (B) IGS variants in bb2 and the 14 alleles produced by Rex-induced magnification (bbM1, bbM2, bbM3, bbM4, bbM5, bbM6, bbM7, bbM8, bbM10, bbM11, bbM15, bbM16, bbM17, and bbM38). (C) PCR products from IGS amplification of 10 alleles produced by Ybb−-induced magnification (bbM18, bbM19, bbM20, bbM22, bbM23, bbM25, bbM26, bbM27, bbM28, and bbM29). The IGS variants range up to 6 kb in length. The magnified alleles did not carry any new or obviously intensified bands with respect to the bb2 lane. Note that the bb2 amplification in B and the bbM29 amplification in C are problematic; they were for samples drawn from the same DNA aliquots as in Figure 4. For the usable parts of these lanes, however, the variant compositions are comparable to those of the other magnified arrays.
To test the resolution of this analysis, the number of copies of variants were estimated as fractions using ImageQuant 5.0 (Molecular Dynamics) to measure band intensity and estimate molecular weight.
Given, I = intensity of a band from ImageQuant peak integration
L = length of fragment from interpolation of length-standards
N = total copy number
Then, IN = intensity normalized for fragment length = I/L
and C = number of copies of variant =
The least intense variants seem to be in many fewer than one copy per array, e.g. from 0.01 to 0.1 copies (Figure 6), despite the fact that they are present in the starting and all magnified genotypes (Figures 4 and 5). DNA was extracted from samples of multiple adults, and the presence of these faint bands could be the result of somatic, or even germline, variation from individual to individual such that this variant is present in only some of the flies, or in just some tissue of even one fly. Alternatively, bands apparently in less than one copy per array could be PCR artifacts (non first order kinetics, hybridization of primers to non-rDNA sequences, variants with low processivity etc.) or be produced by variable presence of extrachromosomal copies.
Figure 6 .

An example of estimated copy numbers of rDNA variants: the bbM1 R2/1 PCR lane in Figure 4 was quantified using ImageQuant software and copy numbers were calculated assuming a total of 120 copies as described in the text. Except for the variant uninterrupted by either R1 or R2, variants are present in 10 or fewer copies. Variants present in bb2 and not in Tp(1;1)scV2 that were used as markers for map construction are indicated.
By comparing the pattern of variants of the bb2 allele with that of the magnified arrays, each of which has about 80 more rDNA copies than bb2, it should be possible to identify any new variants produced by magnification, or major increases in copy number of particular variants. Neither new bands nor obviously more intense bands are present in these arrays, with two exceptions (indicated with the symbol ▶ in Figure 4): the 3.3-kb-long R2/1 band in bbM10 and the 1-kb-long R2/1 band in bbM25. Possible origins of these few exceptions are considered in the Discussion. The qualitative and quantitative similarity among the patterns of the bb2 and magnified alleles certainly does not provide a prima facie indication of multiple rounds of replication, unless that replication involves multiple variants so that the increase for each is imperceptible in the gels. There is a caveat to this, however, with regard to the R2/1 gels. Magnification detected phenotypically requires an increased number of functional rDNA units. If only retrotransposon-free copies replicated, given the already saturated signal of the 550-bp product, we would not be able to see it. The IGS PCR products, however, are completely identical, as far as we can tell, for the bb2 and magnified arrays. Thus, the copies added during magnification must be distributed among so many existing variants that the intensity change for each is imperceptible. Hence, we must discard both models of magnification, whether extrachromosomal or in situ, by extensive amplification of short stretches.
Mappable markers were identified by comparing, in the same gel, the variants present in the bb2 and magnified arrays (they are identical) and in the near-telomere Tp array and selecting those present only in the basal arrays. In this way nine R2/1 markers (named as R followed by length in base pairs, R0750, R0910, R0963, R1355, R1767, R2059, R2166, R2784, and R2916; Figure 7A) and eight IGS markers (named as S followed by length in base pairs, S2785, S2876, S3030, S3079, S3266, S3518, S3542, and S3887; Figure 7B) were selected. Eight Tp-specific variants were also identified: seven R2/1 markers (R0666, R0883, R1179, R1832, R1903, R2322, and R2754; Figure 7A) and the S2021 IGS marker (Figure 7B).
Figure 7 .

The bb2 set of minichromosome crossovers: the nine minichromosomes derived from bb2 (m24, m25, m27, m28, m29, m30, m31, m32, and m33) were analyzed in the same gels along with bb2 and Tp(1;1)scV2. (A) Nine (R2916, R2784, R2166, R2059, R1767, R1355, R0963, R0910, and R0750) bb2-specific R2/1 markers that are absent in the Tp(1;1)scV2 lane, and seven (R2754, R2322, R1903, R1832, R1179, R0883, and R0666) Tp(1;1)scV2-specific R2/1 markers that are absent in the bb2 lane are indicated. (B) Eight (S3887, S3542, S3518, S3266, S3079, S3030, S2876, and S2785) bb2-specific IGS markers and one (S2021) Tp(1;1)scV2-specific IGS marker are indicated. All of the minichromosome samples, but neither bb2 nor Tp(1;1)scV2, contain the 1.25-kb-long IGS variant that was used as a quantitative internal control (see text and Figure 10).
Scoring recombinants for marker presence/absence
The bb2 allele, in which magnification had been induced, three Rex-magnified alleles (bbM1, bbM3, and bbM4), and one Ybb−-magnified allele (bbM18) were mapped. For each allele to be tested, two PCR reactions and two electrophoretic gels were done, one for IGS variants and the other for R2/1 variants. Each gel contained the PCR products of the bb2 or bbM allele to be mapped (first lane), those of the Tp allele (second lane), and those of the set of crossover minichromosomes (subsequent lanes).
The bb2 gels (Figure 7) illustrate the mapping technique. Images of the other gels are in Figure S1, Figure S2, Figure S3, and Figure S4. The first lane contains the variants of the bb2 array and the second lane contains those of the Tp array. Variants of all minichromosomes derived from bb2 (m24, m25, m27, m28, m29, m30, m31, m32, and m33) are in the subsequent nine lanes. Each mappable marker was identified by its presence in the first lane and absence in the second lane, and its presence or absence in the minichromosomes was then scored. For example, the R2916 marker (Figure 7A), which is present in the bb2 lane and is absent in the Tp lane, is also present in the m29 and m32 lanes, but is absent in m24, m25, m27, m28, m30, m31, and m33. Table 1 summarizes the distribution of the 17 markers for bb2 and its minichromosome set, and the other sets are shown in Table S1, Table S2, Table S3, and Table S4. Four markers were not classifiable in some gels, but they are the least abundant, and hence hardest to score, marker variants.
Table 1 . Qualitative crossover data for the bb2 set of crossover minichromosomes.
| Crossover minichromosome | |||||||||
|---|---|---|---|---|---|---|---|---|---|
| Marker | m32 | m29 | m33 | m30 | m31 | m25 | m27 | m28 | m24 |
| R2916 | + | + | |||||||
| R2784 | + | + | |||||||
| R2166 | + | + | + | + | + | + | + | ||
| R2059 | + | + | + | + | + | + | + | + | + |
| R1767 | + | + | |||||||
| R1355 | + | + | |||||||
| R0963 | + | + | + | + | + | ||||
| R0910 | + | + | + | x | x | + | |||
| R0750 | + | + | |||||||
| S3887 | + | + | + | + | + | + | + | + | + |
| S3542 | + | + | + | + | + | + | + | ||
| S3518 | + | + | + | + | + | + | + | + | + |
| S3266 | + | + | |||||||
| S3079 | + | + | + | + | + | + | + | + | |
| S3030 | + | + | + | + | + | + | + | + | + |
| S2876 | + | + | + | + | + | + | + | + | + |
| S2785 | + | + | + | + | + | + | + | + | + |
The presence of nine R2/1 and eight IGS markers was scored for the crossover minichromosome sets from bb2, three Rex-magnified alleles (bbM1, bbM3, and bbM4) and the Ybb−-magnified bbM18 allele. The results for bb2 are shown here, while the other four sets are in Table S1, Table S2, Table S3, and Table S4. The minichromosomes are listed from left to right on the basis of the number of markers carried; minichromosomes produced by more distal exchanges carry more markers than those produced by more proximal exchanges. One marker was absent in two lanes in which a new, slightly shorter, band was present (see text). +, marker present. x, marker with apparent molecular weight shift.
Ordering the exchanges
With intrachromosomal spiral recombination, minichromosomes carry only those markers located proximal to the site of exchange in the centromeric rDNA arrays (Figure 2B). Hence, minichromosomes produced by more proximal exchanges carry fewer bb2-specific or bbM-specific markers than those produced by distal exchanges. If exchanges were randomly distributed, the number of markers would be proportional to centromere distance, but whether proportional or not, the number of markers does allow us to order the exchange events. We need determine only presence or absence of a band to do this. For example, for the nine bb2 exchanges, the most proximal exchange is the one that produced the m24 minichromosome that carries only five IGS-markers (S2785, S2876, S3030, S3518, and S3887). The second exchange is that which produced the m28 minichromosome; it carries the S3079 marker in addition to those present in the m24 minichromosome. The m25, m27, m30, m31, and m33 exchanges are distal to m28, but are qualitatively indistinguishable because all of these minichromosomes carry the same seven markers. Finally, the most distal exchanges are m29 and m32, again indistinguishable because they carry the same eight markers. The minichromosomes are listed in Table 1 in this order, and the ordering of the exchange points is also indicated in Figure 8 by the minichromosome names below the maps.
Figure 8 .

Qualitative maps of individual alleles: using the presence/absence results from Table 1, Table S1, Table S2, Table S3, and Table S4, the exchanges (indicated under each chromosome) are ordered on the basis of the number of markers carried by the minichromosomes. Indistinguishable exchanges are grouped together. The qualitative maps of bb2, bbM3, bbM4, and bbM18 are divided into six regions, and that of bbM1 is divided into five. The proximal limit of each marker (indicated above each chromosome) is the most distal exchange that generates a minichromosome in which the marker is absent. Markers having indistinguishable proximal limits are grouped together. Because they were unscorable in these particular gels, the bbM1 and bbM3 maps do not include the R1355 and R0750 markers, the bbM4 map does not include the R1767 variant and the bbM18 map does not include the R1767 and the S3887 markers (nc in tables).
Determining proximal limits for variant locations
In the previous step, the exchanges that occurred in a given allele were ordered according to the numbers of markers present in their respective minichromosome crossovers. Subsequently, the proximal limit along the array of each marker variant can be placed with respect to these exchange sites. The proximal limit of a marker is the most distal exchange that generates a minichromosome in which the marker is absent. The next more-distal exchange contains at least one copy of this variant. Repeating this for each marker produces the maps shown in Figure 8. In these maps, markers having indistinguishable proximal limits are grouped together. For example, in the bb2 allele, the proximal limits of the S2785, S2876, S3030, S3518, and S3887 markers are indistinguishable from the centromere because they are present in all of the bb2-derived crossovers. The proximal limit of the S3079 marker is the m24 exchange because m24 is the only one of the minichromosomes in which this marker is absent. The m28 exchange is the proximal limit of the S3542 and R2166 markers because they are absent in both the m24 and m28 minichromosomes and because the m28 exchange is distal to the m24 exchange. The proximal limit of the S3266 marker is the group of (so far) indistinguishable m25, m27, m30, m31, and m33 exchanges.
The proximal limit maps had three inconsistencies (Table 1, Table S1, Table S2, Table S3, Table S4, and Figure 8). In two gels, a minichromosome generated by a proximal exchange carries a marker that is absent in other minichromosomes of the same set that were generated by a more distal exchange. In the bbM1 map the m53 exchange is placed distally to m50 because minichromosome 53 carries S3266, a marker that is absent in the m50, m56, and m46 minichromosomes. However, the R0963 marker is present in the m50 minichromosome even though it is absent (indicated as Def in Table S1) in the m53 minichromosome (for gel, see Figure S1A). In the bbM18 set, R0910 is absent (indicated as Def in Table S4) in the m112 minichromosome, although it is present in six minichromosomes produced by more distal exchanges (m111, m110, m100, m104, m106, and m102 (for gel, see Figure S4A).
The third inconsistency is in the bb2 data set. R0910 is absent in the m30 and m31 minichromosomes, but is present in the m25 minichromosome that was produced by an exchange that is proximal to both the m30 and m31 exchanges. Note, however, that the m30 and m31 lanes have a new variant, R0850, that is not present in bb2, nor in any of the magnified arrays (Figure 7A). These observations suggest that the Rex-induced exchanges in m30 and m31 truncated the missing R0910 marker to yield R0850. The R0850 variant of the m30 and m31 minichromosomes, indicated by an X in Table 1, was therefore taken as an R0910 surrogate for map construction.
Although these retrotransposon variants that are missing, or possibly altered, in distal crossovers create ambiguity for the construction of maps of individual rDNA arrays, it should be noted that these are within-minichromosome-set exceptions, hence produced during the generation of the crossovers rather than during magnification, and do not indicate that there have been map changes during the process of magnification.
Coherence of the proximal limits of variant distributions among the starting and magnified chromosomes and a consensus map of the proximal limits
Extrachromosomally amplified rDNA repeats, if they are produced during magnification, must reintegrate somewhere within the array. It is unlikely that the excision and insertion sites will coincide. Hence, a model of extrachromosomal magnification would be supported if the order of proximal limits of variants in one or more magnified array(s) differs from that in bb2. Conversely, if the maps of bb2 and of all of the magnified alleles are coherent it will be possible to make a single consensus map of the proximal limits of the variants, leading us to discard both models of extrachromosomal amplification. To test for coherence among the maps of the individual alleles, the pairwise orders of proximal limits were compared. Any inversion of pairwise order would indicate displacement of at least one rDNA copy in the array.
This comparison was done in two steps as detailed in File S1 and Table S5. First, the pairwise order of the proximal limits was established for each individual map. Second, pairwise orders were then compared among all of the magnified arrays to look for reversals. There were 152 opportunities for detecting a reversal, but there were none at all in the entire data set.
The absence of any order reversals argues against both models of extrachromosomal amplification and allows us to establish a single order of exchanges (detailed in supporting information) that is valid for bb2 and for all of its derivatives as shown in Figure 9. This map of the most proximal copies of the markers is the best that one can do with purely qualitative analysis of the data. From this analysis we have an ordering of 11 (or possibly 12) distinguishable exchange points that divide the map into segments and we know where the most proximal copy of each marker is located. However, we cannot tell where any other copies might be distributed. To go beyond this, we must consider variation of band intensity as well.
Figure 9 .

A consensus qualitative map: the consistency among the individual qualitative maps allows us to draw a single consensus map. The proximal limit of each marker is indicated above the chromosome and the 11 (perhaps 12) regions delimited by the exchange points are noted under the chromosome with the alleles from which the crossover minichromosomes were derived indicated to the right. Markers that have indistinguishable proximal limits are grouped together, as are indistinguishable exchanges. The ordering of m53 (from the bbM1 set) is uncertain because R0750 and R1355 were not classifiable in the bbM1 and bbM3 gels—we do not know if m53 is proximal to the most proximal copy of R1355 and/or R0750. Moreover, if m53 is proximal to the most proximal copy of R0750, it defines a further region-delimiting exchange point. Similarly, ordering of m17, m108. and m112 is uncertain because of our inability to define the proximal limit of R1767 in the bbM4 and bbM18 minichromosome sets.
Quantitative internal controls
An internal control would be useful for comparison of the intensity of a band in different lanes. Comparison of the intensity of such an internal control across lanes would allow us to judge the general uniformity of loading and PCR yield, and comparing the intensity in a marker band to the intensity of the control band would provide a relative measure of copy number that is independent of loading and yield. While low-copy-number variants common to the arrays to be mapped and the partner array provide a control of this type (see File S1), the ideal internal control would be a repeated variant (generating an intense but not saturated band), amplifiable with the same primer pair, that is external to and independent of the arrays being mapped.
No such variant external to the rDNA was available for the R2/1 variants, but all of the C(1)DX, y f /minichromosome, y+ genotypes carry a 1.25-kb-long IGS variant that is absent in all of the cv v car bbx/0 and Tp(1;1)scV2 Df(1)X1, Bx X1/In(1)sc4Lsc8R, y wa B genotypes. This variant is apparently derived from the C(1)DX, y f stock and lies outside of the X chromosome rDNA array. That the 1.25-kb IGS variant is not carried by the minichromosomes, but is indeed derived from the C(1)DX stock, was verified by collecting minichromosome25/In(1)sc4Lsc8R, y wa B and minichromosome29/In(1)sc4Lsc8R, y wa B males instead of minichromosome/C(1)DX females, and running PCR reactions with both the IGS-F/IGS-R and IGS-F1/IGS-R1 primer pairs (Figure 10). In this gel, the 1.25-kb (IGS-F/IGS-R) or 1.35-kb (IGS-F1/IGS-R1) IGS variants are not present. Other crosses (not shown) demonstrated that this IGS variant is either in both the C(1)DX and BSY chromosomes of the C(1)DX stock, or, a priori more likely, is autosomal. In either case, this IGS variant fortuitously provided the desired internal control, and we have not done anything further to map it.
Figure 10.
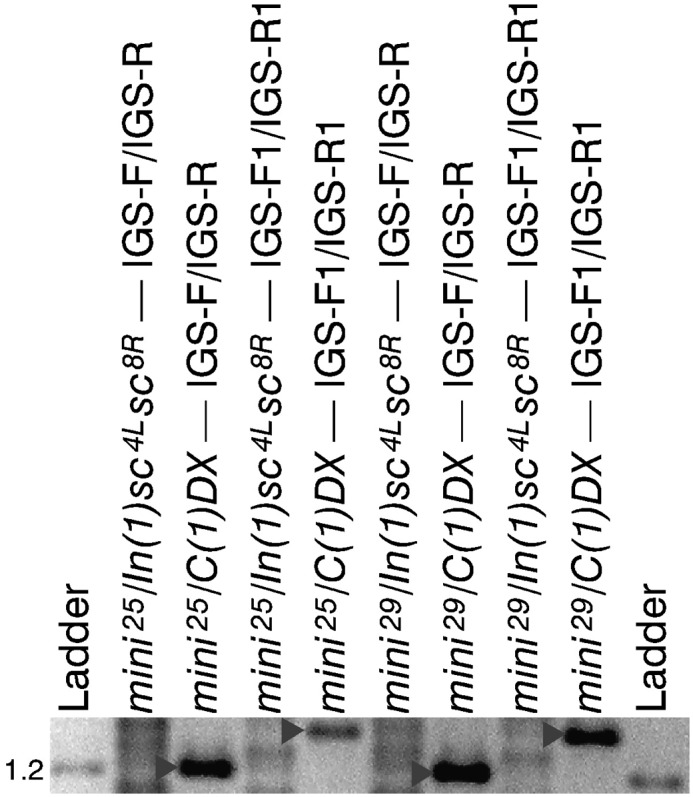
Quantitative internal-control band: a 1.25-kb (with the IGS-F/IGS-R primer pair) or 1.35-kb (with the IGS-F1/IGS-R1 primer pair)-long IGS variant is present in all of the C(1)DX, y f/minichromosomex y+ genotypes, such as minichromosome25 y+/C(1)DX, y f (second and fourth lanes) and minichromosome29 y+/C(1)DX, y f (sixth and eighth lanes), but these variants are absent in cv v car bbx/0 and Tp(1;1)scV2 Df(1)X1, Bx X1/In(1)sc4Lsc8R, y wa B. These variants derive from the C(1)DX, y f stock, and lie outside of the X chromosome rDNA array, because they are also absent in minichromosome25 y+/In(1)sc4Lsc8R, y wa B (first and third lanes) and in minichromosome29 y+/In(1)sc4Lsc8R, y wa B (fifth and seventh lanes). This band provides an internal control that allows us to compare different lanes within a single gel independently of loading and PCR yield differences.
The intensity of each control band was estimated with ImageQuant software and the results are shown in Table 2 as the percentage of the intensity of each control band in a minichromosome set relative to the intensity of that band in the darkest lane of that gel. In almost all cases (41/45) the control band’s intensity is more than 50% of the maximum; in general PCR yield and gel loading differs by less than a factor of 2 from sample to sample.
Table 2 . Relative intensities of the quantitative-control band.
| Array | Minichromosome | |||||||||
|---|---|---|---|---|---|---|---|---|---|---|
| bb2 | m24 | m25 | m27 | m28 | m29 | m30 | m31 | m32 | m33 | |
| 86% | 63% | 87% | 79% | 65% | 64% | 63% | 70% | 100% | ||
| bbM1 | m46 | m48 | m49 | m50 | m52 | m53 | m55 | m56 | ||
| 80% | 76% | 100% | 89% | 87% | 81% | 76% | 83% | |||
| bbM3 | m1 | m2 | m3 | m4 | m5 | m6 | m7 | m8 | m9 | m10 |
| 100% | 64% | 37% | 58% | 46% | 83% | 76% | 52% | 42% | 74% | |
| bbM4 | m14 | m16 | m17 | m19 | m20 | m21 | m22 | m23 | ||
| 65% | 78% | 91% | 58% | 74% | 31% | 100% | 100% | |||
| bbM18 | m100 | m102 | m103 | m104 | m105 | m107 | m108 | m110 | m111 | m112 |
| 98% | 82% | 77% | 90% | 86% | 100% | 76% | 83% | 92% | 96% | |
PCRs of C(1)DX, y f /minichromosomex y+ genotypes with the IGS-F/IGS-R primer pair contain a 1.25-kb-long IGS variant that segregates independently from the rDNA and is derived from the C(1)DX stock. Within each minichromosome set (first column), the intensity of the 1.25-kb band is given as the percentage of signal compared to the crossover with the most intense 1.25-kb band.
Although the R2/1 gels do not contain an equivalent internal control, the procedures used were identical except for PCR reaction conditions, and we can be reasonably confident that noticeably greater-than-twofold intensity differences for a marker band are real and not loading artifacts. The general visual uniformity of the majority of nonmarker bands across the lanes, whether in the IGS or R2/1 gels, also supports this inference (see Figure 7, Figure S1, Figure S2, Figure S3, and Figure S4). It is our view, however, that less-than-twofold quantitative differences should not be considered in the mapping.
Locating multiple copies
Band intensity should be consistent with the qualitative observations: minichromosomes produced by distal exchanges must have the same or more copies of each variant than is present in minichromosomes produced by more proximal exchanges. The loss of a marker or a decrease of intensity in a more distal exchange could result from errors in the analysis, such as a mistake in ordering of the exchanges, or they could be real. Deletions that occur during the Rex-induced exchange process, such as have been unequivocally identified in hairpin-exchange products (Rasooly and Robbins 1991; Crawley 1996), would produce such inconsistencies.
Consideration of only the presence or absence of a marker locates the most centromere-proximal copy of that variant. The aim of a quantitative analysis is to localize the other additional copies (if any) of the marker and to define the marker’s distal limit. The presence of additional copies of a marker in a region is recognizable as a marked intensity difference for this band in minichromosomes produced by adjacent exchanges. In contrast, equal intensity of a band in two minichromosomes produced by adjacent exchanges indicates that no additional copies are located within the region between these exchanges.
Initially we tried to digitally quantify the intensity of bands using Imagequant: integrating the intensity of all pixels in a band after subtracting the average of local background for each pixel. The noise of PCR and gel densitometry, the complexity of the numerical data, and the inference from the internal control that only differences of more than a factor of 2 are reliable caused us to opt for a semiquantitative approach, based on “eyeball” estimation of intensity, that scores only visually obvious changes of relative intensity. This subjective method could introduce some bias and will not identify small changes in copy number for high-copy-number variants, but should let us reliably identify large-copy-number changes for high-copy-number variants and changes of but one or a few copies for low-copy-number variants. Following this logic, the minichromosome bands were reclassified as containing no copies, the first (+) copy, or other (++) more distal copies, if any (Table 3, Table S6, Table S7, Table S8, and Table S9). In some cases, three degrees of intensity were clearly evident and these are indicated as (+), (++), and (+++).
Table 3 . Semiquantitative crossover data for the bb2 set of crossover minichromosomes.
| Crossover minichromosome | |||||||||
|---|---|---|---|---|---|---|---|---|---|
| Marker | m32 | m29 | m33 | m30 | m31 | m25 | m27 | m28 | m24 |
| R2916 | ++ | + | |||||||
| R2784 | ++ | + | |||||||
| R2166 | +++ | ++ | + | + | + | + | + | ||
| R2059 | + | + | + | ++ | ++ | + | + | + | + |
| R1767 | ++ | + | |||||||
| R1355 | + | + | |||||||
| R0963 | ++ | ++ | + | + | + | ||||
| R0910 | ++ | ++ | ++ | x | x | + | |||
| R0750 | ++ | + | |||||||
| S3887 | + | + | + | + | + | + | + | + | + |
| S3542 | + | + | + | + | + | + | + | ||
| S3518 | + | + | + | + | + | + | + | + | + |
| S3266 | + | + | |||||||
| S3079 | ++ | + | + | + | + | + | + | + | |
| S3030 | + | + | + | + | + | + | + | + | + |
| S2876 | + | + | + | + | + | + | + | + | + |
| S2785 | + | + | + | + | + | + | + | + | + |
The band intensities of the nine R2/1 and eight IGS markers in the minichromosome sets from bb2, three Rex-magnified alleles (bbM1, bbM3, and bbM4) and the Ybb−-magnified bbM18 allele were semiquantitatively estimated. The results for bb2 are shown here, while the other four sets are in Table S6, Table S7, Table S8, and Table S9. Minichromosomes are listed from left to right on the basis of decreasing number or intensities of the markers. One marker was absent in two lanes in which a new, slightly shorter, band was present (see text). +, marker present. ++, marker distinctly more abundant than +. +++, marker distinctly more abundant than ++. x, marker with apparent molecular weight shift.
For example, in the bb2 minichromosome set (Figure 7B and Table 3) the S3079 band is less intense in m25, m27, m29, m30, m31, and m33 than in both the starting bb2 array and in the m32 crossover. This observation confirms the qualitative result that the m32 exchange is distal to the others, but indicates that there are two clusters of S3079 repeats in the bb2 array. One cluster is located in the interval between the m24 exchange site and the most proximal of the m25, m27, m29, m30, m31, m33 exchanges. The other cluster is located between the most distal exchange of the m25, m27, m29, m30, m31, m33 group and the m32 exchange site.
The semiquantitative maps were generally in conformity with the qualitative maps for the 17 marker variants in all 45 minichromosomes, but three incongruities were found. In the qualitative map of the bb2 allele, both the m30 and m31 minichromosomes resulted from medial exchanges, but the semiquantitative map indicates that both of these minichromosomes carry more R2059 repeats than are present in other minichromosomes produced by more distal exchanges (Figure 7A and Table 3). The S2876 marker also is more abundant in the m16 minichromosome than in more distally produced minichromosomes of the bbM4 set (Figure S3B and Table S8). Possible explanations for these exceptions are considered later.
Constructing the final map
The semiquantitative analysis adds information about the location of distal copies of multi-copy markers. The first step in incorporating this information into the map is comparison of the qualitative and semiquantitative information for each single allele. The semiquantitative data agree with the qualitative results, but allow us to define some additional exchange points. For bb2, the m32 and m29 exchanges were inseparable in the qualitative data (Table 1), but the semiquantitative data tell us that the m32 exchange is distal to the m29 exchange because its minichromosome carries more copies of several markers (R2916, R2784, R2166, R1767, R0750, and S3079) (Table 3 and Figure 11). Similarly, in the bbM1 allele (Figure S1 and Table S6) the m56 exchange is distal to the m46 exchange, in bbM3 (Figure S2 and Table S7) both m4 and m8 are distal to m2, and in bbM18 (Figure S4 and Table S9) m108 is distal to m112.
Figure 11.

Semiquantitative maps of single alleles: the semiquantitative data set shown in Table 3, Table S6, Table S7, Table S8, and Table S9 was used to order the exchange points (indicated under the chromosome) for each allele. Indistinguishable exchanges are grouped together. The semiquantitative maps of bb2, bbM3, and bbM18 are divided into seven regions and those of bbM1 and bbM4 in six. Some exchanges that were indistinguishable in the qualitative analysis are distinguishable using the semiquantitative results: m32 is distal to m29 in bb2, m56 is distal to m46 in bbM1, m4 and m8 are distal to m2 in bbM3, and m108 is distal to m112 in bbM18. The most proximal (in blue) and additional (in red) copies of each marker are indicated in the exchange-delimited regions. The bbM1 and bbM3 maps do not include the R1355 and R0750 markers, the bbM4 map does not include the R1767 variant, and the bbM18 map does not show the R1767 and the S3887 markers because they were unscorable in these particular gels (nc in tables).
If magnification does not change the order of the markers, as for the previous qualitative consensus map of the most proximal copies, we should be able to use the quantitative information to construct a consensus map of all of the copies of the markers. The procedure is analogous to deletion mapping. First, we determined the order of all exchanges, then, considering the overlap of the segments defined by the various alleles, the copies of each marker were placed within the exchange-delimited regions. This semiquantitative map is shown in Figure 12.
Figure 12.

The semiquantitative consensus map: the coherence among the individual semiquantitative maps allows us to make a consensus map subdivided into 16 (possibly 17) exchange-delimited regions. The most proximal (in blue) and additional (in red) copies of each marker are indicated above the chromosome and the exchange points are indicated below, with the alleles from which the crossovers were derived shown to the right. This map is more detailed than the qualitative map: the presence of a second R0910 copy (or group of copies) in m56 allows us to place m56 distal to the m25–m46–m16–m102-defined exchange. The ordering of m53 is, however, not clarified by the semiquantitative data because R0750 and R1355 were not classifiable in the bbM1 and bbM3 gels. The exchange defined by m49 from the bbM1 set and m2 from the bbM3 set is proximal to that defined by m4 and m8 from the bbM3 set, m20 from the bbM4 set and m111 from the bbM18 set, because m4, m8, m20, and m111 carry additional R2784 and R0963 copies. The ordering of m17 from the bbM4 set and m112 from the bbM18 set, ambiguous with a purely qualitative analysis, is resolved by the presence of an additional R0963 copy (or group of copies) in the m29 and m112 minicromosomes, and its absence in m5, m9, and m17. Each of the next group of exchanges (m32 from the bb2 set, and m48, m52, and m55 from the bbM1 set) picks up additional copies of R2916, R2784, R2166, R1767, and S3079. m108 picks up additional R2166 copies and m3, the most distal exchange of the whole map, picks up additional R0910 and S3030 copies. Because increase of intensity is meaningful only within a minichromosome set and cannot be compared across different gels, the presence of other additional copies of some markers in other intervals (in gray type) cannot be excluded.
The semiquantitative and purely qualitative maps are the same from the centromere to the exchange site defined by m27, m7, m103, and m107. The quantitative analysis reveals the presence of a second R0910 copy (or group of copies) in minichromosome 56. This allows us to place m56 distal to the m25–m46–m16–m102 defined exchange. The next exchange is defined by 11 crossovers all of which pick up the first R0963 copy: m30, m31, and m33 from the bb2 set, m50 from the bbM1 set, m6 and m10 from the bbM3 set, m22 and m23 from the bbM4 set, and m100, m104, and m106 from the bbM18 set. An example of qualitative data confirmed by the semiquantitative results is represented by the next exchange site, defined by m19 and m21 from the bbM4 set, m110 from the bbM18 set, and, possibly m53 from the bbM1 set, although the location of m53, as explained below, is uncertain. These crossovers carry the most proximal copies of R0750 and S3266 and the second copy (or group of copies) of R2166. The next exchange site is defined by m14, which picks up the first copy of R1355.
The ordering of m53 is uncertain because R0750 and R1355 were not classifiable in the bbM1 and bbM3 gels. There are three possibilities. If the first R0750 copy is absent in the m53 crossover, than the exchange site defined by m53 is distal to that of the 11 crossovers that pick up the first R0963 copy and proximal to that defined by m19, m21, and m110. If the m53 crossover carries the first R0750 copy, but does not carry the first R1355 copy, than the exchange site defined by m53 is indistinguishable from the m19–m21–m110 exchange site. Finally, if m53 contains copies of both R0750 and R1355, it is at the same site as m14.
The next exchange is defined by the two crossovers that pick up the first R2784 copy: m49 from the bbM1 set and m2 from the bbM3 set. The exchange defined by m4 and m8 from the bbM3 set, m20 from the bbM4 set, and m111 from the bbM18 set is more distal because these minichromosomes carry additional R2784 and R0963 copies. Continuing distally, we have the exchange defined by m5 and m9 from the bbM3 set and m17 from the bbM4 set that picks up the first R2916 copy, followed by the exchange defined by m29 and m112 that carries the first R1767 copy and an added R0963 copy (or group of copies).
We noted above that the ordering of the m17 exchange was uncertain in the qualitative map because of the illegibility of the R1767 bands in the bbM4 and bbM18 gels. The semiquantitative analysis, however, resolves this ambiguity because of the presence of an additional R0963 copy (or group of copies) in the m29 and m112 minichromosomes, but not in m5, m9, and m17.
The next group of exchanges consists of m32 from the bb2 set, and m48, m52, and m55 from the bbM1 set. They all pick up additional copies of R2916, R2784, R2166, R1767, and S3079. m108 is the next more-distal exchange because it picks up additional R2166 copies and m3 picks up additional R0910 and S3030 copies and is the most distal exchange of the whole map.
We know that an additional R2916 copy (or copies) is present between the m29–m112 and m32–m48–m52–m55 sites, but an increase of intensity is meaningful only within a minichromosome set and cannot be compared across different gels. Hence, we don’t know whether the additional R2916 copies are between the m5–m9–m17 and m29–m112 exchange sites or distal to the m32–m48–m52–m55 site. The same uncertainty, indicated in gray in Figure 12, also exists for additional copies of some other markers.
The final semiquantitative consensus map localizes the marker copies in 16 (possibly 17) exchange-delimited regions. This map is more detailed than the qualitative map because it is based on more information; it includes the distal as well as proximal limits of all copies rather than just the proximal limits of the most proximal copies. The semiquantitative map is probably not as reliable as the qualitative map, however, because of the somewhat subjective evaluation of intensity differences.
Comparison of the maps yields three principal inferences:
Because of the coherence among the maps of the individual alleles, we now know that magnification does not modify the order of the rDNA variants within arrays.
The genome of the C(1)DX stock carries a 1.25-kb-long (using the IGS-F/IGS-R primer pair) IGS variant that is absent in all of the mapped rDNA arrays. This variant is either autosomal or present in both the C(1)DX and BSY chromosomes.
R2/1 variants may be lost and new R2/1 variants are sometimes generated during minichromosome-producing Rex-induced recombination. At least in this data set, however, there was no gain or loss of IGS variants during Rex-induced mitotic recombination.
Mapping the Tp(1;1)scV2 rDNA array
To verify the mapping methodology and to gather further information about the Rex-induced exchange process, the Tp(1;1)scV2 rDNA array, the constant subtelomeric array used as crossover partner for mapping the bb2 and magnified arrays was also mapped. We identified eight Tp(1;1)scV2-specific variants (R2754, R2322, R1903, R1832, R1179, R0883, R0666, and S2021; Figure 7) and they were classified in all 45 minichromosomes (Figure 7, Figure S1, Figure S2, Figure S3, Figure S4, and Table S10), except for the R1179 band that was not analyzable in the bbM18 set (see Figure S4A). Map construction, as detailed in supporting information, followed the same procedures as used for the bb2 and magnified arrays. First, the order of exchange points was determined individually for each gel (Table S10), and then these orders were combined to yield the order of all exchanges in the Tp(1;1)scV2 array. Although the Tp(1;1)scV2 array was the same in all of the minichromosome sets, and this array had never been exposed to magnifying conditions, there were three incongruities (but no order reversals) similar to those seen for the proximal arrays in this data set as well, missing bands (deletions) or new bands (seemingly Rex-induced exchanges within a marker variant). Thus, the Tp(1;1)scV2 results reinforce our inference that the incongruities seen for the basal arrays were introduced during generation of the crossover minichromosomes and not during the magnification process.
Once the order of all of the exchange sites had been established, the Tp(1;1)scV2 qualitative map (Figure 13) was completed by identifying the distal limits of each marker as the most proximal exchange point yielding a minichromosome that does not carry that variant. The most proximal exchange point of the map is defined by 17 minichromosomes carrying all eight of the Tp(1;1)scV2 markers: m24, m27, and m28 of the bb2 set, m49, m50, and m56 of the bbM1 set, m1, m2, m5, m6, and m9 of the bbM3 set, m17, m19, m21, and m23 of the bbM4 set, and m107 and m112 of the bbM18 set. The next point is the distal limit of the R0883 marker and is defined by m25 and m33 of the bb2 set, m7 of the bbM3 set, and m100 and m111 of the bbM18 set. Continuing distally we reach the R0666 distal limit, defined by m29 of the bb2 set, m46 of the bbM1 set, m8 and m10 of the bbM3 set, m14, m20, and m22 of the bbM4 set, and (perhaps) m103 of the bbM18 set. The succeeding exchange points are: the distal limit of R1179 defined by m4 of the bbM3 set and (perhaps) m103 of the bbM18 set, that of S2021 defined by m30 and m31 of the bb2 set, the distal limit of R2322 defined by m16 of the bbM4 set and m106 of the bbM18 set, the distal limit of R2754 defined by m48, m52, m53, and m55 of the bbM1 set and by m110 of the bbM18 set, and the distal limit of R1903 defined by m104 and m108 of the bbM18 set. The most distal point, that is, the distal limit of R1832, is defined by m32 of the bb2 set, m3 of the bbM3 set, and m102 of the bbM18 set, all of which do not carry any Tp(1;1)scV2 specific markers.
Figure 13.

The map of the Tp(1;1)scV2 rDNA array: all of the exchange points (indicated under the chromosome) are ordered using presence/absence information for the eight Tp(1;1)scV2-specific markers (indicated above the chromosome) in all 45 of the minichromosomes shown in Table S10. Indistinguishable exchanges are grouped together. The map of the Tp(1;1)scV2 array contains eight (possibly nine) exchange-delimited regions. The ordering of the m103 exchange point is ambiguous because of the uncertain presence of R1179 in the m103 minichromosome. The distal limit of each Tp(1;1)scV2-specific marker (shown above the chromosome) is defined as the most proximal exchange point yielding a minichromosome that does not carry that variant.
Because the gels did not show any substantial intensity variation for these markers, no further information about the distal limits of the markers can be added to this Tp(1;1)scV2 qualitative map.
Discussion
The mechanism of magnification
Twenty-four independently magnified chromosomes induced by Ybb− (10) or Rex (14) in bb2 were collected. About 100 molecular-length variants, either IGS or R2/1, were compared among all of these chromosomes. In general, magnification was not accompanied by presence of new variants not already present in bb2 nor by markedly increased copy numbers of subsets of variants. From this we conclude that the approximately 80-copy increase of rDNA that reverts bb2 to bb+ arises by small-copy-number increases of multiple different variants. Thus, we discard both magnification models, in situ or extrachromosomal, that are based on massive overreplication of a single repeat or of a short rDNA cluster. Neither of these is consistent with our observations, because either would yield strong replication of the one or few variants involved.
Given this, three other models remain possible: two based on replication, either in situ or extrachromosomal, of an extended rDNA cluster, and one based on unequal exchange between sister chromatids. Comparing the maps of molecular variants before and after magnification, however, allows us to also exclude extrachromosomal replication. Five rDNA arrays were mapped: the starting bb2 allele, the Rex-magnified bbM1, bbM3 and bbM4 alleles, and the Ybb−-magnified bbM18 allele. Seventeen bb2-specific variants were followed: eight IGS variants and nine R2/1 variants. All of the molecular variants maintain the same order in all five arrays. Because of the consistency of the maps of bb2 and the magnified alleles, magnification must increase the number of rDNA repeats without reorganizing the architecture of the rDNA. This not only confirms the exclusion of extensive replication of a short rDNA cluster on the basis of the absence of marked changes in variant copy numbers, but also excludes limited extrachromosomal replication of a long rDNA segment.
Only two models remain consistent with our results: replication in situ of a long rDNA cluster and unequal exchange between sister chromatids. Our data cannot distinguish between these two models, because neither of these mechanisms would change the rDNA maps. However, the two models follow completely different mechanisms, which could have rather different evolutionary effects.
Unequal recombination produces both rDNA magnification and rDNA reduction, maintaining the average number of repeats per rDNA array; selection would presumably remove arrays with too few or too many active copies. Replication, in contrast, could only magnify the rDNA, requiring another (as yet unknown) mechanism to balance this persistent increase. While waiting for new experimental data that would enable us to distinguish between unequal recombination and limited replication of a long rDNA cluster, or that would identify the balancing mechanism of continual overreplication, we prefer unequal recombination.
The behavior of Rex and of the Ybb− chromosome
There were two clear exceptions to the constancy of the R2/1 variants among bb2 and its magnified derivatives. The Ybb−-magnified bbM25 allele carries a slightly less than 1-kb-long R2/1 variant that is absent in bb2 and in all of the other magnified alleles. The Rex-magnified bbM10 allele carries a new 3.3-kb-long R2/1 variant. These new R2/1 variants could derive either from retrotransposon movements or from retrotransposon-provoked exchanges. The insertion of a retrotransposon in a retrotransposon-free rDNA unit (the 550-bp-long variant) could produce a longer rDNA unit with a unique length, yielding a new band, or with the same length as other, preexisting, variants, yielding intensified bands. Likewise, new variants, having a unique length or having the same length as preexisting variants, could arise by recombination between two retrotransposons having different lengths. Recombination would, however, yield a corresponding reciprocal product in which a band was lost or of reduced intensity. We did not observe any loss or reduction of bands, but the difference between two additions and zero reductions is, obviously, not statistically significant.
The production of new variants seems independent of the element used to induce magnification; one was found in a Rex-magnified allele and the other in a Ybb−-magnified allele. No clearly new IGS variants were found, so this phenomenon may be related specifically to R1 and/or R2. Once again, however, this must be taken with a grain of salt as observing none when at most a few are expected could be just a matter of chance. The appearance of only altered R1 or R2 variants in both the Rex and Ybb− samples, however, together with several other observations, leads us to suggest that Ybb− induces magnification because it contains a Rex-like element and that both cause magnification because they actively produce a retrotransposon-coded endonuclease; during spermiogenesis in the case of Ybb− and during oogenesis in the case of Rex. First, Ybb−-induced magnification is not caused by the deficiency of rDNA, but by some unknown element in the Ybb− chromosome (Endow et al. 1984; Hawley and Tartof 1985). Second, a double-strand break and its repair may be the proximate event leading to magnification (Marcus et al. 1986; Paredes and Maggert 2009). Third, numerous alterations of R2/1 PCR products were evident in the minichromosome products of Rex-induced exchange.
A less-plausible, but still possible, alternative should be kept in mind, however. R1 repeats are known to reside outside the rDNA (Kidd and Glover 1980). Hence, the presence of new or intensified bands in the magnified arrays or crossover minichromosomes could arise from the segregation of autosomal R1 repeats introduced during the crosses used to construct the stocks. This would require, however, that the genotypes used in the crosses carry several different autosomal R1/2 variants. Moreover, unlike the autosomal (or pseudo-autosomal) IGS sequence present in our C(1)DX stock, none of these variants is fixed, or even at high frequency; if such variants were common, appearance of new or intensified bands would have been the rule rather than the exception. Finally, the new variants would have to have been fixed or nearly fixed in the stocks of the magnified chromosomes or they would produce at most very faint bands in DNA extracted from multiple flies.
That R1 or R2 specific modifications are implicated in Rex-induced recombination is more certain. The loss of R2/1 bands, or the appearance of new ones, in this sample is relatively frequent, yet no such alterations in IGS variants was observed. Because Rex-induced recombination is often accompanied by local deficiencies at the exchange sites (Rasooly and Robbins 1991; Crawley 1996), the loss of a band, by itself, cannot be interpreted as a break in a retrotransposon. The appearance of new R2/1 variants, however, cannot arise by the simple production of deficiencies and implicates the retrotransposon sequence itself in the recombination event. These data therefore support the speculation (Hawley and Marcus 1989) that Rex is an oogenesis-active variant of an R1 or R2 retrotransposon.
In summary, though by no means proven, the observations reported here and the observations reported by others are internally consistent with the idea that breakage, whether induced by an endogenous nuclease, such as a retrotransposon-encoded one, or by a transgene-encoded one, such as I-CreI, is sufficient to start the magnification process and that Rex and Ybb− work in similar ways at different points in the life cycle.
Some considerations about somatic variation
Because our DNA samples were extracted from about 200 adults, the observation of both R2/1 and IGS variants in much less than one copy per genome could be an effect of individual-to-individual somatic variation. Different tissues require massively different numbers of ribosomes, and it seems reasonable to think that somatic regulation makes use of DNA amplification as well as transcription-level regulation. Although the experiments reported here rule out a role for extrachromosomal circles in rDNA magnification (Graziani et al. 1977; see also review by Cohen and Segal 2009), they might be the less-than-one-copy per genome variants that we detect. Amplification of different variants in the soma of individuals, whether they be chromosomal or extrachromosomal copies, would give exactly what we observe when we look at variant composition in DNA extracted from a sample of 200 or so flies. Without further experiments, however, this notion is speculative.
The map of the Tp(1;1)scV2 array
The map of the Tp(1;1)scV2 array is not directly relevant to understanding the mechanism of magnification, but it is nevertheless useful. The Tp(1;1)scV2 map, derived from all of the 45 minichromosome lanes in all of our gels, includes more data points than the maps of individual bobbed alleles, each of which is based on a group of no more than 10 minichromosomes. The mapping of the Tp(1;1)scV2 array also confirms that the few exceptions found in the maps of the magnified arrays were produced during the Rex-induced exchange process rather than by magnification. The map of bb2 and of the magnified alleles is a consensus map, while the Tp(1;1)scV2 map is a map of a single allele followed in all of the gels. That exceptions of the same type and frequency were found for the Tp(1;1)scV2 markers says that these exceptions have nothing to do with magnification. Finally, as shown in Figure 14, aligning the two maps clearly demonstrates that Rex-induced recombination is more often than not unequal, presumably because repeated arrays pair even when offset.
Figure 14.

Alignment of the exchange sites in the Tp(1;1)scV2 and pericentromeric rDNA arrays. Each minichromosome derives from a distinct Rex-induced exchange between the two rDNA arrays of the target chromosomes. The order of the exchange sites in the consensus map of bb2 and the magnified pericentromeric rDNA arrays (top chromosome) is compared with that of the Tp(1;1)scV2 array (bottom chromosome). Lines are drawn connecting the end points of each exchange in the two arrays. Dotted lines are used for the few cases where exchange-point location is uncertain. Each intersection among these connections indicates misalignment of the arrays during the Rex-induced recombination.
New research lines
The main aim of this work was to define the mechanism of magnification, but several observations, not directly implicated in magnification, suggest two new research lines:
The observed R2/1 and IGS variation, that is, the presence of variants (possibly somatic) in less than one copy per genome and the appearance of new variants, should be clarified through a pedigree of the copy number and variant composition of rDNAs of single individuals. Following the segregation of variants we will know if they are really new germ-line variants in single individuals or variants produced during somatic development. We will also know if the wide individual-to-individual phenotypic variation, previously observed by Boschi (2007; M. Boschi, E. E. Swanson, A. Bianciardi, M. Belloni, and L. G. Robbins, unpublished results) in phenotype-based pedigrees, is dependent on copy-number as well as transcription-level variation.
The rather frequent appearance of new R2/1 variants during Rex-induced recombination supports the hypothesis that Rex is an active retrotransposon variant. But, because we used a primer pair that reveals all R1 and R2 length variation that does not distinguish between them, we do not know if Rex is a variant of R1 or R2. Separate amplification with R1-specific and R2-specific primer pairs should resolve this.
The appearance of new R2/1 bands in Rex-magnified and Ybb−-magnified chromosomes suggests that the Ybb−-chromosome carries a Rex-like element. Genetic experiments will be needed to know if Ybb− can also induce exchanges between rDNA arrays, either during spermatogenesis or via a maternal effect of X/X/Ybb− females. Concomitant molecular analysis should reveal whether the same sequences are the targets of both Rex and Ybb−.
Supplementary Material
Acknowledgments
We thank M. P. Bozzetti for help with primer design.
Footnotes
Communicating editor: C.-ting Wu
Literature Cited
- Belikoff E. J., Beckingham K., 1985a A stochastic mechanism controls the relative replication of equally competent ribosomal RNA gene sets in individual dipteran polyploid nuclei. Proc. Natl. Acad. Sci. USA 82: 5045–5049 [DOI] [PMC free article] [PubMed] [Google Scholar]
- Belikoff E. J., Beckingham K., 1985b Both nucleolar organizers are replicated in Dipteran polyploid tissues: a study at the level of individual nuclei. Genetics 111: 325–336 [DOI] [PMC free article] [PubMed] [Google Scholar]
- Bender W., Spierer P., Hogness D. S., 1983. Chromosomal walking and jumping to isolate DNA from the Ace and rosy loci and the bithorax complex in Drosophila melanogaster. J. Mol. Biol. 168: 17–33 [DOI] [PubMed] [Google Scholar]
- Boschi M., 2007. Meccanismi di magnificazione dell’rDNA di Drosophila melanogaster. Ph.D. dissertation, University of Siena, Italy
- Bridges C. B., 1916. Non-disjunction as a proof of the chromosome theory of heredity. Genetics 1: 1–52, 107–163 [DOI] [PMC free article] [PubMed] [Google Scholar]
- Burke W. D., Eickbush D. G., Xiong Y., Jakubczak J., Eickbush T. H., 1993. Sequence relationship of retrotransposable elements R1 and R2 within and between divergent insect species. Mol. Biol. Evol. 10: 163–185 [DOI] [PubMed] [Google Scholar]
- Cohen S., Segal D., 2009. Extrachromosomal circular DNA in eukaryotes: possible involvement in the plasticity of tandem repeats. Cytogenet. Genome Res. 124: 327–338 [DOI] [PubMed] [Google Scholar]
- Cooper K. W., 1959. Cytogenetic analysis of major heterochromatic elements (especially Xh and Y) in Drosophila melanogaster, and the theory of “heterochromatin”. Chromosoma 10: 535–588 [DOI] [PubMed] [Google Scholar]
- Crawley P. G., 1996. The development of a Rex-induced spiral exchange technique for mapping the ribosomal DNA of D. melanogaster and further investigations of the genetic properties of Rex. Ph.D. dissertation, Michigan State University, East Lansing
- Dawid I. B., Wellauer P. K., 1978. Ribosomal DNA and related sequences in Drosophila melanogaster. Cold Spring Harb. Symp. Quant. Biol. 42: 1185–1194 [DOI] [PubMed] [Google Scholar]
- de Cicco D. V., Glover D. M., 1983. Amplification of rDNA and type I sequences in Drosophila males deficient in rDNA. Cell 32: 1217–1225 [DOI] [PubMed] [Google Scholar]
- Eickbush D. G., Eickbush T. H., 1995. Vertical transmission of the retrotransposable elements R1 and R2 during the evolution of the Drosophila melanogaster species subgroup. Genetics 139: 671–684 [DOI] [PMC free article] [PubMed] [Google Scholar]
- Endow S. A., 1980. On ribosomal gene compensation in Drosophila. Cell 22: 149–155 [DOI] [PubMed] [Google Scholar]
- Endow S. A., 1982. Polytenization of the ribosomal genes on the X and Y chromosomes of Drosophila melanogaster. Genetics 100: 375–385 [DOI] [PMC free article] [PubMed] [Google Scholar]
- Endow S. A., 1983. Nucleolar dominance in polytene cells of Drosophila. Proc. Natl. Acad. Sci. USA 80: 4427–4431 [DOI] [PMC free article] [PubMed] [Google Scholar]
- Endow S. A., Glover D. M., 1979. Differential replication of ribosomal gene repeats in polytene nuclei of Drosophila. Cell 17: 597–605 [DOI] [PubMed] [Google Scholar]
- Endow S. A., Komma D. J., Atwood K. C., 1984. Ring chromosomes and rDNA magnification in Drosophila. Genetics 108: 969–983 [DOI] [PMC free article] [PubMed] [Google Scholar]
- George J. A., Burke W. D., Eickbush T. H., 1996. Analysis of the 5′ junctions of R2 insertions with the 28S gene: implications for non-LTR retrotransposition. Genetics 142: 853–863 [DOI] [PMC free article] [PubMed] [Google Scholar]
- Glover D. M., 1991. Mitosis in the Drosophila embryo-in and out of control. Trends Genet. 7: 125–132 [DOI] [PubMed] [Google Scholar]
- Graziani F., Caizzi R., Gargano S., 1977. Circular ribosomal DNA during ribosomal magnification in Drosophila melanogaster. J. Mol. Biol. 112: 49–63 [DOI] [PubMed] [Google Scholar]
- Hawley R. S., Marcus C. H., 1989. Recombinational controls of rDNA redundancy in Drosophila. Annu. Rev. Genet. 23: 87–120 [DOI] [PubMed] [Google Scholar]
- Hawley R. S., Tartof K. D., 1985. A two-stage model for the control of rDNA magnification. Genetics 109: 691–700 [DOI] [PMC free article] [PubMed] [Google Scholar]
- Jakubczak J. L., Xiong Y., Eickbush T. H., 1990. Type I (R1) and type II (R2) ribosomal DNA insertions of Drosophila melanogaster are retrotransposable elements closely related to those of Bombyx mori. J. Mol. Biol. 212: 37–52 [DOI] [PubMed] [Google Scholar]
- Jakubczak J. L., Burke W. D., Eickbush T. H., 1991. Retrotransposable elements R1 and R2 interrupt the rRNA genes of most insects. Proc. Natl. Acad. Sci. USA 88: 3295–3299 [DOI] [PMC free article] [PubMed] [Google Scholar]
- Kidd S. J., Glover D. M., 1980. A DNA segment from D. melanogaster which contains five tandemly repeating units homologous to the major rDNA insertion. Cell 19: 103–119 [DOI] [PubMed] [Google Scholar]
- Lathe W. C., III, Burke W. D., Eickbush D. G., Eickbush T. H., 1995. Evolutionary stability of the R1 retrotransposable element in the genus Drosophila. Mol. Biol. Evol. 12: 1094–1105 [DOI] [PubMed] [Google Scholar]
- Long E. O., Dawid I. B., 1979. Expression of ribosomal DNA insertions in Drosophila melanogaster. Cell 18: 1185–1196 [DOI] [PubMed] [Google Scholar]
- Long E. O., Dawid I. B., 1980. Alternative pathways in the processing of ribosomal RNA precursor in Drosophila melanogaster. J. Mol. Biol. 138: 873–878 [DOI] [PubMed] [Google Scholar]
- Long E. O., Rebbert M. L., Dawid I. B., 1981. Nucleotide sequence of the initiation site for ribosomal RNA transcription in Drosophila melanogaster: comparison of genes with and without insertions. Proc. Natl. Acad. Sci. USA 78: 1513–1517 [DOI] [PMC free article] [PubMed] [Google Scholar]
- Malik H. S., Burke W. D., Eickbush T. H., 1999. The age and evolution of non-LTR retrotransposable elements. Mol. Biol. Evol. 16: 793–805 [DOI] [PubMed] [Google Scholar]
- Marcus C. H., Zitron A. E., Wright D. A., Hawley R. S., 1986. Autosomal modifiers of the bobbed phenotype are a major component of the rDNA magnification paradox in Drosophila melanogaster. Genetics 113: 305–319 [DOI] [PMC free article] [PubMed] [Google Scholar]
- McClintock B., 1934. The relation of a particular chromosomal element to the development of the nucleoli in Zea mays. Z. Zellforsch. 21: 294–328 [Google Scholar]
- McKee B. D., Lindsley D., 1987. Inseparability of X-heterochromatic functions responsible for X:Y pairing, meiotic drive and male fertility in Drosophila melanogaster. Genetics 116: 399–407 [DOI] [PMC free article] [PubMed] [Google Scholar]
- McKee B. D., Wilhelm K., Merrill C., Ren X., 1998. Male sterility and meiotic drive associated with sex chromosome rearrangements in Drosophila: role of X-Y pairing. Genetics 149: 143–155 [DOI] [PMC free article] [PubMed] [Google Scholar]
- Paredes S., Maggert K. A., 2009. Expression of I-CreI endonuclease generates deletions within the rDNA of Drosophila. Genetics 181: 1661–1671 [DOI] [PMC free article] [PubMed] [Google Scholar]
- Pellegrini M., Manning J., Davidson N., 1977. Sequence arrangement of the rDNA of Drosophila melanogaster. Cell 10: 213–214 [DOI] [PubMed] [Google Scholar]
- Polanco C., González A. I., de la Fuente Á, Dover G. A., 1998. Multigene family of ribosomal DNA in Drosophila melanogaster reveals contrasting patterns of homogenization for IGS and ITS spacer regions. A possible mechanism to resolve this paradox. Genetics 149: 243–256 [DOI] [PMC free article] [PubMed] [Google Scholar]
- Rasooly R. S., Robbins L. G., 1991. Rex and a suppressor of Rex are repeated neomorphic loci in the Drosophila melanogaster ribosomal DNA. Genetics 129: 119–132 [DOI] [PMC free article] [PubMed] [Google Scholar]
- Ritossa F., 1968. Unstable redundancy of genes for ribosomal RNA. Proc. Natl. Acad. Sci. USA 60: 509–516 [DOI] [PMC free article] [PubMed] [Google Scholar]
- Ritossa F., 1976. The bobbed locus, pp. 801–846 The Genetics and Biology of Drosophila, Vol. 1B, edited by Ashburner M., Novitski E. Academic Press, New York [Google Scholar]
- Ritossa F., Spiegelman S., 1965. Localization of DNA complementary to ribosomal RNA in the nucleolus organizer region of Drosophila melanogaster. Proc. Natl. Acad. Sci. USA 53: 737–745 [DOI] [PMC free article] [PubMed] [Google Scholar]
- Ritossa F., Atwood K. C., Spiegelman S., 1966. A molecular explanation of the bobbed mutants of Drosophila as partial deficiencies of “ribosomal” DNA. Genetics 54: 819–834 [DOI] [PMC free article] [PubMed] [Google Scholar]
- Robbins L. G., 1981. The meiotic behavior of some single-cistron mutants in the zeste-white region of the Drosophila melanogaster X chromosome. Mol. Gen. Genet. 183: 214–219 [DOI] [PubMed] [Google Scholar]
- Robbins L. G., 1996. Specificity of chromosome damage caused by the Rex element of Drosophila melanogaster. Genetics 144: 109–115 [DOI] [PMC free article] [PubMed] [Google Scholar]
- Robbins L. G., Pimpinelli S., 1994. Chromosome damage and early developmental arrest caused by the Rex element of Drosophila melanogaster. Genetics 138: 401–411 [DOI] [PMC free article] [PubMed] [Google Scholar]
- Robbins L. G., Swanson E. E., 1988. Rex-Induced recombination implies bipolar organization of the ribosomal RNA genes of Drosophila melanogaster. Genetics 120: 1053–1059 [DOI] [PMC free article] [PubMed] [Google Scholar]
- Roiha H., Miller J. R., Woods L. C., Glover D. M., 1981. Arrangements and rearrangements of sequences flanking the two types of rDNA insertion in D. melanogaster. Nature 290: 749–753 [DOI] [PubMed] [Google Scholar]
- Sandler L., Braver G., 1954. The meiotic loss of unpaired chromosomes in Drosophila melanogaster. Genetics 39: 365–377 [DOI] [PMC free article] [PubMed] [Google Scholar]
- Sandler L., Novitski E., 1957. Meiotic drive as an evolutionary force. Am. Nat. 41: 105–110 [Google Scholar]
- Simeone A., La Volpe A., Boncinelli E., 1985. Nucleotide sequence of a complete ribosomal spacer of Drosophila melanogaster. Nucleic Acids Res. 13: 1089–1101 [DOI] [PMC free article] [PubMed] [Google Scholar]
- Spencer W. P., 1944. Iso-Alleles at the Bobbed Locus in Drosophila hydei Populations. Genetics 29: 520–536 [DOI] [PMC free article] [PubMed] [Google Scholar]
- Swanson E. E., 1987. The Responding Site of the Rex Locus of Drosophila melanogaster. Genetics 115: 271–276 [DOI] [PMC free article] [PubMed] [Google Scholar]
- Tartof K. D., 1971. Increasing the multiplicity of ribosomal RNA genes in Drosophila melanogaster. Science 171: 294–297 [DOI] [PubMed] [Google Scholar]
- Tartof K. D., 1973. Regulation of ribosomal RNA gene multiplicity in Drosophila melanogaster. Genetics 73: 57–71 [DOI] [PMC free article] [PubMed] [Google Scholar]
- Tartof K. D., 1974a Unequal mitotic sister chromatin exchange as the mechanism of ribosomal RNA gene magnification. Proc. Natl. Acad. Sci. USA 71: 1272–1276 [DOI] [PMC free article] [PubMed] [Google Scholar]
- Tartof K. D., 1974b Unequal mitotic sister chromatid exchange and disproportionate replication as mechanisms regulating ribosomal RNA gene redundancy. Cold Spring Harb. Symp. Quant. Biol. 38: 491–500 [DOI] [PubMed] [Google Scholar]
- Tautz D., Tautz C., Webb D., Dover G. A., 1987. Evolutionary divergence of promoters and spacers in the rDNA family of four Drosophila species. Implications for molecular coevolution in multigene families. J. Mol. Biol. 195: 525–542 [DOI] [PubMed] [Google Scholar]
- Tautz D., Hancock J. M., Webb D. A., Tautz C., Dover G. A., 1988. Complete sequences of the rRNA genes of Drosophila melanogaster. Mol. Biol. Evol. 5: 366–376 [DOI] [PubMed] [Google Scholar]
- Terracol R., 1987. Differential magnification of rDNA gene types in bobbed mutants of Drosophila melanogaster. Mol. Gen. Genet. 208: 168–176 [DOI] [PubMed] [Google Scholar]
- Terracol R., Prud’homme N., 1986. Differential elimination of rDNA genes in bobbed mutants of Drosophila melanogaster. Mol. Cell. Biol. 6: 1023–1031 [DOI] [PMC free article] [PubMed] [Google Scholar]
- Wellauer P. K., Dawid I. B., 1977. The structural organization of ribosomal DNA in Drosophila melanogaster. Cell 10: 193–212 [DOI] [PubMed] [Google Scholar]
- White R. L., Hogness D. S., 1977. R loop mapping of the 18S and 28S sequences in the long and short repeating units of Drosophila melanogaster rDNA. Cell 10: 177–192 [DOI] [PubMed] [Google Scholar]
- Williams S. M., Robbins L. G., 1992. Molecular genetic analysis of Drosophila rDNA arrays. Trends Genet. 8: 335–340 [DOI] [PubMed] [Google Scholar]
- Williams S. M., Kennison J. A., Robbins L. G., Strobeck C., 1989. Reciprocal recombination and the evolution of the ribosomal gene family of Drosophila melanogaster. Genetics 122: 617–624 [DOI] [PMC free article] [PubMed] [Google Scholar]
Associated Data
This section collects any data citations, data availability statements, or supplementary materials included in this article.