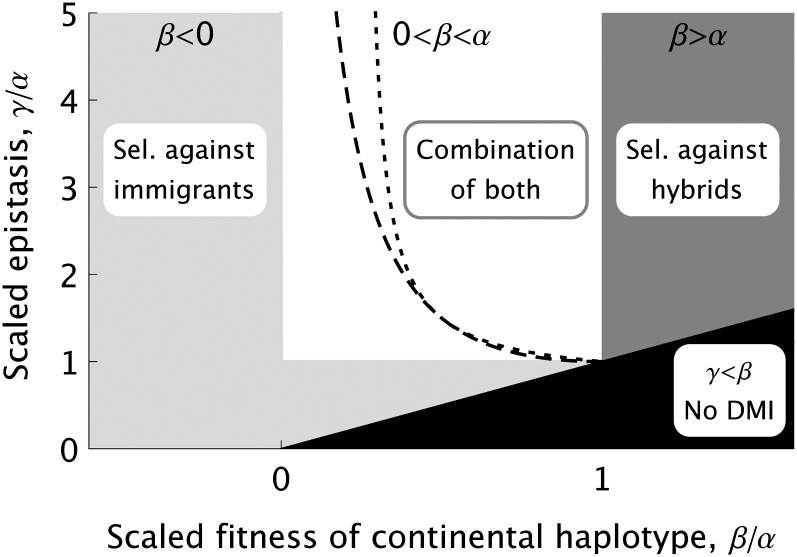
Figure 2 .
Parameter ranges corresponding to two different mechanisms for DMI evolution in the haploid model as a function of the heterogeneity of the environment (measured as β/α) and the strength of the incompatibility (measured as γ/α). In the intermediate parameter range (open area), both mechanisms contribute and we see a stepwise transition for various characteristic properties: (1) decrease/increase of population differentiation with increasing recombination rate for weak migration (left/right of dashed line) and (2) decrease/U-shape or increase of with increasing recombination rate (left/right of dotted line).

