Abstract
Finding specific small-molecule inhibitors of protein-protein interactions remains a significant challenge. Recently, attention has grown toward “hot-spot” interactions where binding is dominated by a limited number of amino acid contacts, theoretically offering an increased opportunity for disruption by small molecules. Inhibitors of the interaction between BRCT (C-terminal portion of BRCA1, a key tumor suppressor protein with various functions), and phosphorylated protein (Abraxas, BACH1, CtIP) implicated in DNA damage response and repair pathways, should prove useful in studies of BRCA1’s role in cancer and to potentially sensitize tumors to chemotherapeutic agents. We developed and miniaturized to 1536-well format and 3 μL final volume a pair of fluorescence polarization (FP) assays utilizing fluorescein- and rhodamine-labeled pBACH1 fragment. In order to minimize the effect of fluorescence artifacts and to increase the overall robustness of the screen, the 75,552 compound library members were each assayed against both the fluorescein- and rhodamine-labeled probe-protein complexes in separate but interleaved reactions. In addition, every library compound was tested over a range of concentrations, following the qHTS paradigm (Inglese et al, PNAS, 103, 1147 (2006)). Analyses of the screening results led to the selection and subsequent confirmation of 16 compounds active in both assays. Faced with a traditionally difficult protein-protein interaction assay, by performing two-fluorophore qHTS we were able to confidently select a number of actives for further studies.
INTRODUCTION
Protein-protein interactions (PPI) mediate a myriad of critical cellular processes, and have therefore recently grown in prominence as targets for drug development. Unlike enzyme active sites, which are often well-characterized and of limited size and complexity, the interfaces involved in protein-protein interactions are often large and ill-defined, and may include variable contact points[1]. Such fluid topologies reflect the lower affinity and transient nature of these interactions, and their roles in triggering a variety of signaling events in response to subtle changes in the concentrations and the ratios of multiple binding partners. It is not surprising, therefore, that such large and variable interaction space presents enormous challenges to those wishing to identify small molecules that disrupt these interactions in a potent, specific, and reproducible manner. Present-day screening compound libraries, while generally suitable for finding effectors for such “druggable” targets as enzymes and receptors, may not contain the chemotypes needed to disrupt protein-protein interactions[2]. In addition to the expansiveness and low definition of the interacting protein surfaces, technical issues pertaining to assay design and screening artifacts further complicate the identification of true PPI disrupters [3]. For example, colloidal aggregates spontaneously formed by certain compounds might reach the size and topology sufficient to perturb protein-protein interactions in a reproducible yet non-specific and biologically irrelevant manner[2, 4, 5].
It has been noted recently that in a number of protein-protein interaction systems, the major contribution to the change in free energy is from a limited number of amino acid contacts. These contacts have been commonly referred to as “hot spots” and at present targeting them for disruption by small molecules is considered to offer improved chances of inhibitor identification[6, 7]. Hot-spot interactions appear to be better defined and are operationally easier to study because limited-length peptides can frequently be designed to mimic at least one of the interacting partners. In the present study, we focus on the hot-spot interaction between the C-terminal domain of BRCA1 and the phosphorylated proteins (Abraxas/BACH1/CtIP)[8–11]. These BRCA1-phosphoprotein interactions have been implicated in a variety of cellular functions (cell cycle regulation, transcription activation/repression and ubiquitination to name a few) that are critical for the DNA damage response and repair signaling pathways[9, 10, 12–17].
Structural and biochemical studies between BRCT(BRCA1) and phosphorylated peptides have lead to the identification of a pSXXF as the binding motif on the peptide and mapped the binding site to a region at the interface of the two BRCT domains of BRCA1[12, 14, 18–24]. The BRCT-phosphoprotein interactions are transient and structural studies show that BACH1 and CtIP bind to the same site on the BRCT domains. This strongly suggests the need for temporal regulation of the BRCT-phosphoprotein interactions for the proper functioning of the DNA damage response and repair pathways. Therefore classical biochemical techniques have limited ability to dissect these signaling pathways and small molecules are emerging as a viable alternative. Small molecule inhibitors of the BRCT-phosphoprotein interactions should prove as useful chemical probes to uncouple the complex BRCA1 signaling and as potential hits that can be developed as leads to sensitize tumors to DNA damage based chemotherapeutic agents.
In this work, we describe the development and quantitative high throughput screening of a BRCT:phosphopeptide interaction assay. Inhibitors of BRCT-phosphopeptide binding were detected by a decrease in the fluorescence polarization (FP) of the fluorophore in a fluorescently labeled phosphorylated 10 amino acid peptide fragment of BACH1 complexed with BRCT. In order to minimize the effect of fluorescence artifacts and to increase the overall robustness of the screen, the compound library members were assayed in separate reactions with fluorescein- and rhodamine-labeled probe-protein complexes, respectively. Additionally, each compound was tested at a minimum of 7 concentrations following our previously-reported quantitative high-throughput screening (qHTS) paradigm[25]. Herein, we describe the development of a red-shifted FP probe, the miniaturization of fluorescein- and rhodamine-based assays to 3 uL volume in 1536-well format, the results of screening both assays across a >75,000 compound collection, and the preliminary characterization of actives identified.
MATERIALS AND METHODS
Reagents
Tween-20, EDTA, NaCl, NaN3, and DTT (dithiothreitol) were procured from Sigma-Aldrich. DMSO Certified ACS Grade was from Fisher. Unlabeled control peptide SRSTpSPTFNK was synthesized and HPLC-purified by the Tufts University Core Facility (Boston, MA). The screening assay was performed in 20 mM phosphate buffer pH 7.3 containing 150 mM NaCl, 1mM DTT, 1 mM EDTA, 0.02% NaN3 and 0.01% Tween-20.
Compound library
The 75,552 member library comprised two main subsets: 60,783 compounds from the NIH Molecular Libraries Small Molecule Repository (www.mli.nih.gov), prepared as 10 mM stock solutions in 384-well plates and delivered by Galapagos Biofocus DPI (South San Francisco, CA, http://mlsmr.glpg.com), and NCGC internal exploratory collection of 11,336 compounds which consisted of several commercially available libraries of known bioactives (1280 compounds from Sigma-Aldrich (LOPAC1280 library), 1120 compounds from Prestwick Chemical Inc. (Washington, DC), 980 compounds from Tocris (Ellisville, Missouri), 280 purified natural products from TimTec (Newark, DE), 1980 compounds from the National Cancer Institute (the NCI Diversity Set)), as well as collections from other commercial and academic collaborators (three 1000-member combinatorial libraries from Pharmacopeia (Cranbury, NJ), 1,121 compounds from Boston University Center for Chemical Methodology and Library Development, 96-member peptide library from Prof. Sam Gelman’s lab, University of Wisconsin, Madison, and 991 compounds from the University of Pittsburgh Center for Chemical Methodology and Library Development). The compound library (7 μL each in 1536-well Greiner polypropylene compound plate) was prepared as DMSO solutions at initial concentrations ranging between 2 and 10 mM. Plate-to-plate (vertical) dilutions and 384-to-1536 compressions were performed on Evolution P3 dispense system equipped with 384-tip pipetting head and two RapidStak units (Perkin-Elmer, Wellesley, MA). Additional details on the preparation of the compound library are provided in Inglese et al.[25]
Control plate
Titration of the unlabeled decapeptide SRSTpSPTFNK was delivered via pin transfer of 23 nL of solution per well from a separate source plate into the upper half of column 2 of each assay plate. The starting concentration of the control was 10 mM, followed by twofold dilution points in duplicate, for a total of eight concentrations, resulting in final assay concentration range from 76 μM to 0.59 μM, corresponding to the dilution of 23 nL into 3 μL.
qHTS protocol with assay interleaving
Three μL of reagents (100 nM FITC- or TAMRA-labeled peptide in columns 3 and 4 as negative control and 100 nM labeled peptide and BRCT (100 nM in the TAMRA assay and 250 nM in the FITC assay) mixture in columns 1, 2, 5–48) were dispensed into 1536-well Greiner black assay plate. Compounds and control (23 nL) were transferred via Kalypsys PinTool equipped with 1536-pin array (10 nL slotted pins, V&P Scientific, San Diego, CA).[26] The plate was incubated for 12 min at room temperature, and then read on ViewLux high-throughput CCD imager (Perkin-Elmer, Wellesley, MA) using FITC polarization filter sets for the fluorescein-based and BODIPY sets for the rhodamine-based assays, respectively. During dispense, reagent bottles were kept submerged into 4 °C recirculating chiller bath and all liquid lines were covered with aluminum foil to minimize probe and protein degradation. All screening operations were performed on a fully integrated robotic system (Kalypsys, San Diego, CA) containing one RX-130 and two RX-90 anthropomorphic robotic arms (Staubli, Duncan, SC). Library plates were screened starting from the lowest and proceeding to the highest concentration. The timing and order of assay plates passing through the screening system were adjusted such that each compound library plate was assayed against the fluorescein- and rhodamine-labeled assay systems at immediately adjacent time points. Vehicle-only plates, with DMSO being pin-transferred to the entire column 5–48 compound area, were included at uniform intervals of approximately every 50 plates in order to record any systematic shifts in assay signal.
Analysis of qHTS data
Screening data were corrected and normalized and concentration–effect relationships derived by using in-house developed algorithms. Percent activity was computed from the median values of the uninhibited, or neutral, control (48 wells located in column 1 and one-half of column 2) and the free-probe, or 100% inhibited, control (64 wells, entire columns 3 and 4), respectively. For assignment of plate concentrations and sample identifiers, ActivityBase (ID Business Solutions Ltd, Guildford, UK) was used for compound and plate registrations. An in-house database was used to track sample concentrations across plates. Plates containing DMSO only (instead of compound solutions) were inserted uniformly throughout the screen to monitor any systematic trend in the assay signal potentially resulting from issues with reagent dispensers or decrease in enzyme specific activity. Correction factors were generated from the DMSO plate data and applied to each assay plate to correct for such systematic errors. A four parameter Hill equation[27] was fitted to the concentration-response data by minimizing the residual error between the modeled and observed responses. Outliers could be identified and masked by modeling the Hill equation and asking if the any differences exceeded that expected from the noise in the assay.
Follow-up testing of primary screen actives
Screening actives selected for confirmatory testing were re-sourced as 10 mM initial stock solutions in DMSO. The samples were then serially diluted row-wise in 384-well plate in twofold steps for a total of 12 concentrations, ranging from 10 mM to 4.9 μM. Upon completion of the 12-point dilution, solutions from two 384-well plates were transferred to duplicate wells of 1536-well compound plate. The last two rows of the 1536-well plate did not contain any test compound and were reserved for placement of positive and negative controls. The assay protocol for confirmation was essentially the same as that described in the qHTS protocol section. A Flying Reagent Dispenser (FRD, Aurora Discovery, presently Beckman-Coulter) [28] was used to dispense reagents into the assay plates. Pin-transfer of 23 nL of compound solution into 3 μL of assay mixture resulted in final compound concentrations between 76 μM and 37 nM.
RESULTS
Assay Principle, Miniaturization, and Optimization
The assay was initially developed and optimized in 384-well format by following the FP change in the fluorescein label (hereinafter referred to as green)[29]. During these studies, the main parameters of the assay, such as buffer conditions, concentrations of probe and protein, DMSO and detergent tolerance, were tested and optimized. The assay was miniaturized to a final volume of 3 μL in 1536-well format by direct volume reduction. Additionally, in order to prevent peptide and protein absorption to the polystyrene wells due to the increased surface-to-volume ratio and to minimize the interfering effect of promiscuous inhibitors acting via colloidal aggregate formation[4, 5], we included detergent (0.01 % Tween-20) in the assay buffer.
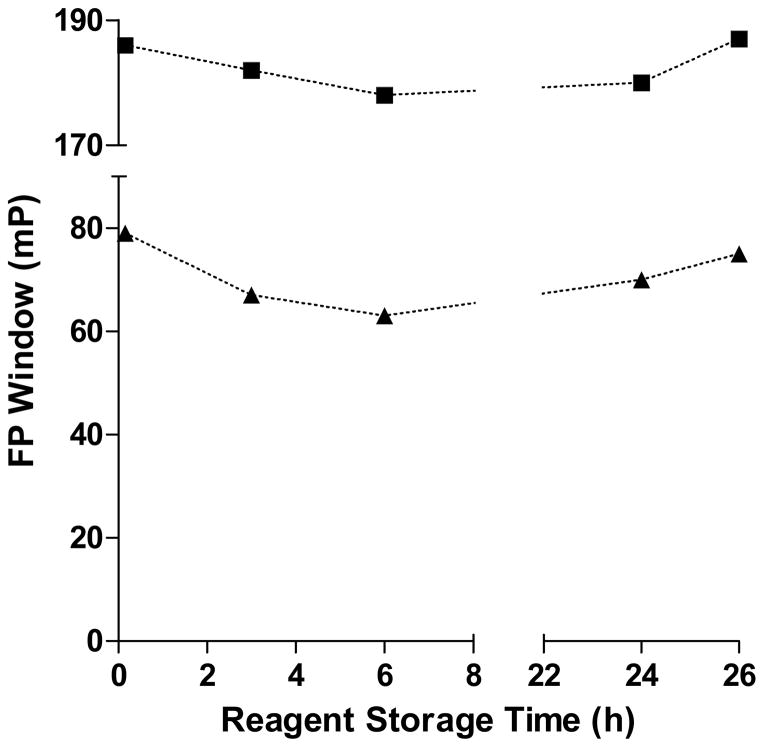
In parallel with the miniaturization of the original green assay, a red-shifted probe was explored. We wished to screen the present system against the two differently labeled protein-phosphopeptide complexes in order to increase the confidence in the actives found and to possibly maximize the chances of actives identification. Thus, a pBACH1 peptide of the same sequence was labeled with 5-carboxy tetramethyl rhodamine (TAMRA, hereinafter referred to as red) and subjected to the same assay optimization experiments. The FP dynamic range observed with the red-labeled peptide was higher, in the range of 170–190 mP, as frequently experienced with this fluorophore. Due to the enhanced signal, the protein concentration was decreased to 100 nM, same as that of the labeled probe, thus resulting in reagent savings and improving the response range of the assay (data not shown). All four major assay components (green and red free probes and protein complexes, respectively) were tested and were found to be stable for at least 24 hours when formulated as stock solution at their working concentrations (Figure 1). Such demonstrated stability permitted the implementation of an unattended overnight screening operation.
Figure 1. Screening reagents’ stability as a function of storage time.
Bottles containing complex and free probe stock solutions, respectively, were prepared and kept at 4 °C. At the selected time points, the bottles were connected to a liquid dispenser and the assay was performed as described in Methods. FP signal windows (solid triangles for green and solid squares for red assays, respectively) were computed as the average of 32 wells.
Interleaved dual-assay qHTS
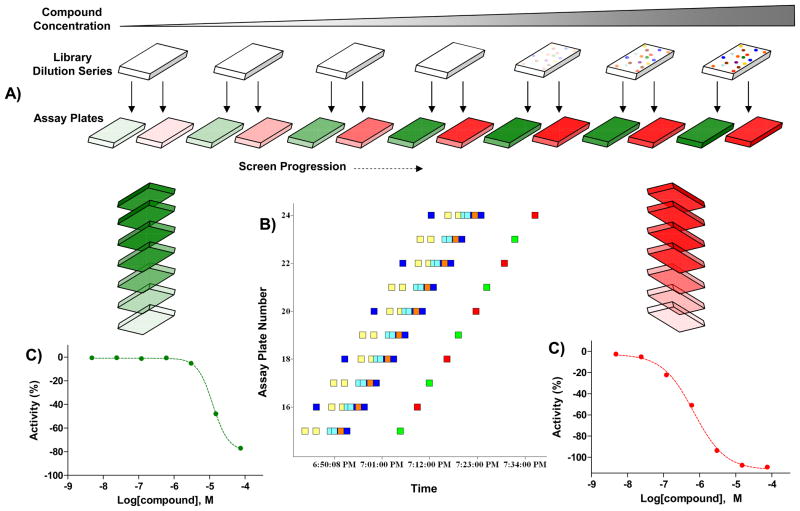
Given that both assay reagents and compounds in the screening collection may exhibit temporal variations in activity [30, 31], we optimized the screening protocol to test each compound sample in the two individual fluorophore assays as closely in time as possible. There was no specific way within the robotic software to ensure that assay plates were run in an alternating fashion between the green and red systems, or set up any explicit dependencies or contingencies between the two assays. Since the same pintool and plate reader was used for both assays, the only option remaining was to interleave plates from the two assays based upon time. We achieved this by adding an incubation step to only one of the two assay methods (i.e., robotic protocols), thus staggering the start times of the two assays and successfully achieving alternation of the two colors. Figure 2 represents a schematic of the fluorophore interleaving strategy to ensure testing of each library plate against green- and red-fluorescent complexes at adjacent time points.
Figure 2. Interleaving of dual-fluorophore screens.
From each compound library plate, samples were pin-transferred into green- and red-fluorophore assay plates in immediate succession. Shown are the schematic representation of interleaving (A) along with examples of assay plates passing through the screening system (Spotfire plot in panel B) and concentration-response curves derived from the greed and red screening assays respectively (C). The plots are color-coded to reflect the assay fluorophore.
Implementation of this innovative robotic protocol required addressing two potential bottlenecks. First, in order to prevent competition between the methods for the pin transfer station, the offset was applied to the second method only, so when the two methods were interleaved they would be evenly spaced due to the offset applied to the second method. Second, since the robot arms were also shared between the methods, competition for them could eventually lead to enough mistiming of one or both methods that they would no longer be cleanly cyclically interleaved. To prevent this, we added 6 extra assay plates to the end of each fluorophore screen into which DMSO rather than test compounds were pin-transferred. This technique is conceptually similar to time domain-based interpolation utilized in digital signal processing methods and sometimes referred to as a ‘zero pad’, in which a string of zeros is applied to the end of a time domain sequence to increase the resolution of the frequency domain sampling. In our case, the ‘zeroes’ used were the blank DMSO plates at the end of the screen, and the time domain sequence was the series of steps that each assay plate goes through during the screen. By adding in these blank plates, we maintained the system steady state and thereby allowed all compound plates to be screened in a consistently interleaved fashion.
qHTS Performance and Analysis
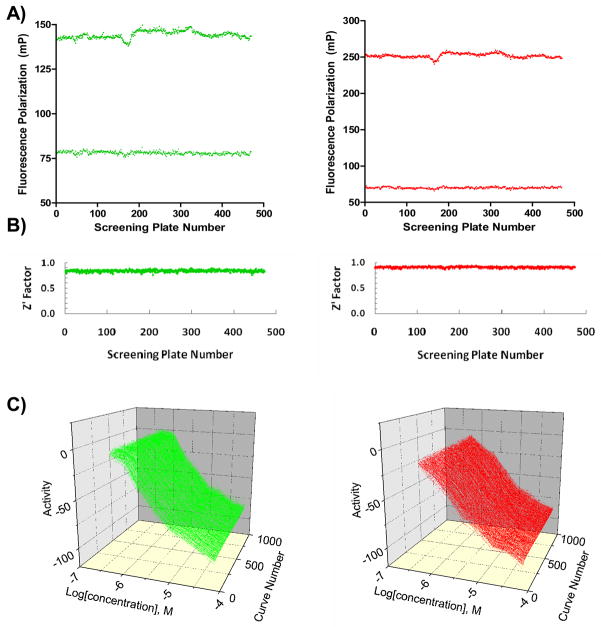
The screens against the green- and red-labeled systems utilized 470 and 473 assay plates, respectively, and all 943 plates were run interleaved in one uninterrupted robotic screening run (Figure 2). The assay signal windows, as expressed by the difference between mean FP values for the bound and unbound labeled peptide controls, were stable throughout the screen (Figure 3A). Both assay performed robustly, yielding an average Z′ factor[32] of 0.84 for the green and 0.91 for the red assay systems, respectively (Figure 3B). The intraplate decapeptide control titration curves remained nearly overlapping throughout the screen progression (Figure 3C), resulting in average IC50 of 4.2μM and 5.0μM for the green and red systems, respectively. During this qHTS experiment, the library members were tested in concentration-response of at least 7 points, with concentrations ranging from 0.97 nM to 76μM, and for each well and each assay system, FP as well parallel- and perpendicular-plane fluorescence intensity values were collected and stored in the database.
Figure 3. qHTS Performance.
Shown are the signal window (A), Z′ trend (B) and intraplate control titrations (duplicate curves per plate) (C) as a function of plate number. The plots are color-coded to reflect the assay fluorophore.
Unlike traditional HTS, qHTS provides concentration responses for all the compounds screened and allows determination of an AC50 value, defined as the half-maximal activity concentration, for each compound in the primary screen. Concentration response curves were assigned to one of four classes based on efficacy (response magnitude), presence of asymptotes, and goodness of fit of the curve to the data (r2)[25]. For the present screen, the activity associated with each well was computed from the FP values normalized against control wells. In addition, the fluorescence intensity values associated with each well were stored in the database and used to further scrutinize purported actives.
Overview of Actives
The green and red screens yielded a total of 47 active samples associated with varying quality concentration-response curves. Out of the 47, two samples represented a duplicate, being the same compound which existed in the collection as two batches from different vendors. A number of actives were associated with single-point inhibition at the top concentration and as such the sigmoidal dose-response curves fitted through the data were of the lowest quality and reproducibility. Table 2 provides a summary of the findings from both screens. The green screen yielded 21 complete curves and 26 single-point top concentration responses, while for the red screen the respective counts were 29 and 18. Out of the actives exhibiting complete concentration-response curves, 18 were shared between the two fluorophore assays. Examples of green and red concentration-response curves derived from the primary screen and the follow-up experiments (see Compound Follow-up) are shown in Figure 4. We note that while the collected fluorescence intensity data would have allowed us to summarily exclude actives exhibiting autofluorescence, we chose not to do so in this case due to the low number of active samples and the nature of the assay. The overall very low hit rate of approximately 0.06% is yet another reflection of the difficulty of finding inhibitors of protein-protein interactions.
Table 2.
Actives summary by concentration-response curve quality.
| Fluorophore | Complete Curves | Single-point Responses | Flat Response (Inactive) |
|---|---|---|---|
| Green | 21 | 26 | 75,505 |
| Red | 29 | 18 | 75,505 |
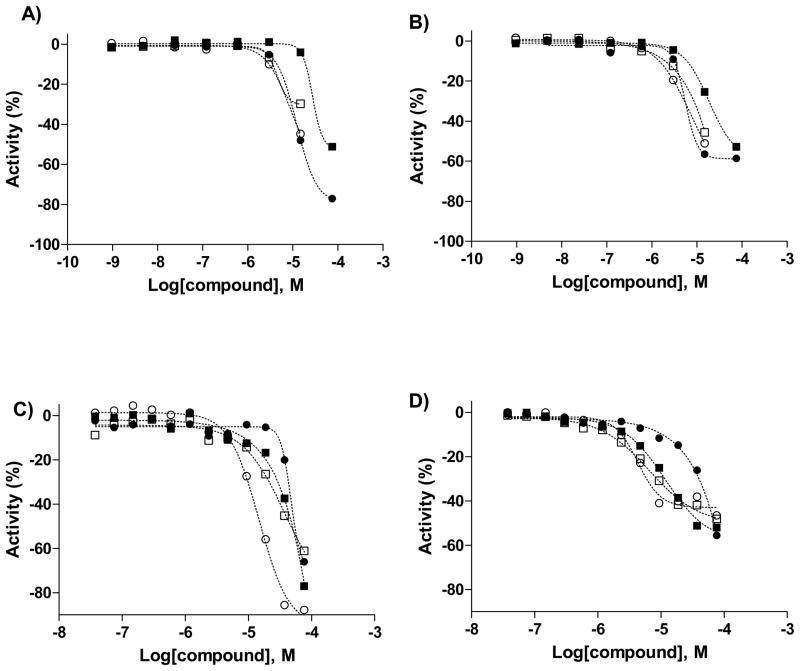
Figure 4. Examples of concentration-response curves.
Shown are curves derived from the primary screen (panel A for green and panel B for red, respectively) and the subsequent actives retesting (panel C for green and panel D for red, respectively). Compound data refers to NCGC00038539 (●), NCGC00094000 (■), NCGC00097324 (○), and NCGC00097325 (□).
Compound Follow-up
All 47 samples identified as active in the primary screen were subjected to confirmatory testing by using the same green and red assays. Unlike the interplate, or vertical, titrations employed in the qHTS experiments, the follow-up samples were arrayed in the traditional same-plate fashion[33]. Thus, all 47 samples, occupying one row per sample, were contained within two 1536-well plates. Each sample was tested as 12-point dilution series, developed at twofold steps in duplicate, to yield a total of 24 data points per compound. Unlabeled decapeptide control dilution (12 concentration points, in duplicate) was also included in the follow-up tests in order to ensure the integrity of the interacting BRCT and labeled pBACH1 peptide.
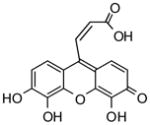
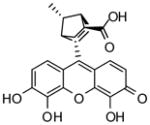
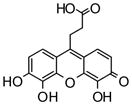
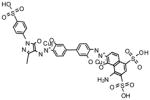
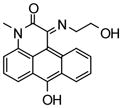
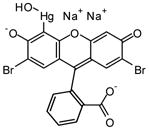
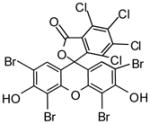
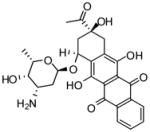
Out of the 47 samples re-tested, 39 showed similar activity in the green assay and 43 reproduced in the red assay, as compared with the original screening results. All of the samples which did not reproduce yielded flat concentration-response curves in both colors and were associated with single-point responses in one or both of the primary screens. As such they had been pre-flagged as low-confidence actives and their lack of reproducibility was therefore not unexpected. The structures and activities of compounds which exhibited reproducible effect in both the green and red assays are shown in Table 3. The IC50 potencies ranged from single-digit micromolar (IC50 of 3.2 μM in the green assay and 7.9 μM in the red assay for NCGC00094849) to several extrapolated values of over 100 μM (the highest compound concentration tested being 76μM). While some actives are relatively small in size, we note that the majority of molecules are relatively large, with one or more extended ring systems. Additionally, known bioactive fluorescent molecules and potential quenchers, such as mercurochrome (NCGC00094822) and Chicago Sky Blue (NCGC00024822), were present among the actives in both colors. Further, one compound showed weak activity (IC50>50 μM) in the green re-test assay but was inactive against the red system and five compounds were weak red-active but green-inactive. While such compounds might be true inactives for which the apparent single-color inhibition is a color-associated artifact of quenching or autofluorescence, the converse could be true, as well: these compounds might be real actives but the apparent lack of response in one color might be the result of light attenuation.
Table 3.
Structures and follow-up results (IC50 in μM) of dual-fluorophore active compounds.
| Green | Red | |
|---|---|---|
 NCGC00097323-01 |
14 | 6.6 |
 NCGC00097324-01 |
15 | 4.5 |
 NCGC00097325-01 |
49 | 6.7 |
 NCGC00097793-01 |
28 | 11 |
 NCGC00096888-01 |
66 | 64 |
 NCGC00031939-01 |
87 | 51 |
 NCGC00038539-01 |
61 | 70 |
 NCGC00055879-01 |
145* | 42 |
 NCGC00094822-01 |
8.5 | 4.6 |
 NCGC00094822-01 |
8.5 | 3.5 |
 NCGC00091490-01 |
17 | 3.0 |
 NCGC00093830-01 |
128* | 44 |
 NCGC00093976-01 |
6.1** | 11 |
 NCGC00094000-01 |
47 | 38 |
 NCGC00094195-01 |
78 | 54 |
 NCGC00025105-01 |
136* | 15 |
Notes.
, IC50 values extrapolated from curve-fitting that extend beyond the accuracy of the re-test assay which tested the compounds at top concentration of 76 uM. ND, not determined.
DISCUSSION
The BRCT-pBACH1 fluorescence polarization assay, previously described and tested in 384-well format[29], was hereby successfully miniaturized to 3 μL volume in 1536-well plate. A new element to the screening strategy was the development and implementation of a red-shifted FP assay which employed a TAMRA-labeled peptide of the same sequence. The two-assay, two-probe screening approach served to increase the confidence in the actives found. In order to minimize compound sample variability between the two screen occurrences, we designed and implemented an interleaved-assay strategy whereby the green and red screens were performed in one uninterrupted robotic run with each compound plate being tested against the green and red complexes in immediate succession. The assay interleaving presented here ensured that there were no differences in composition of the compound samples tested between the two assays.
The primary screen against the BCRT-pBACH1 complex was performed in quantitative high throughput screening (qHTS) format, with every compound tested over a range of concentrations, spanning from tens of micromolar to low nanomolar, to generate a complete concentration-response profile. Here, not only are potencies and efficacies assigned to each active compound but also false positives and negatives due to outliers associated with individual concentration responses are easily identified in the context of titration, thus eliminating the need for laborious and infrastructure-intensive cherry-picking, original-result replication, and dose-response characterization. Throughout the screen, the interleaved green and red assays performed in a robust manner, yielding Z′ values of over 0.8, which remained flat with the screen progression. The intra-plate control titration, which can be viewed as a combined internal standard for both the underlying assay biology and the reproducibility of compound transfer, yielded IC50 values which remained within a narrow range throughout the screen (Figure 3C). The minimum significant ratios (MSR) were 1.4 for the green and 1.2 for the red screens, respectively, thereby indicating overall high level of assay and screening system stability. The MSR screening assay parameter, introduced recently by Eastwood et al[34], serves as a measure of concentration-response curve reproducibility upon repeat testing and values below 3 are generally associated with reproducible IC50 values. Each library compound was tested at a minimum of seven concentrations and for each well and fluorophore-type assay, three measurements were collected for a combined total of ~4.3 million data points. The reliability and robustness of such screening datasets should make them valuable as depositions in recently established public databases, such as PubChem. Additionally, the presence of Tween-20 in the assay buffer minimized the interference from promiscuous colloidal aggregators[5].
Autofluorescence from library members is routinely listed as a source of false-positives in many assay formats, including FP. While clever detection schemes such as obtaining kinetic enzyme reaction progress data or performing pre-reads[3, 35, 36], as well as profiling the library for fluorescence properties, may allow one to minimize the effect of autofluorescence or at the very least to grasp its magnitude, there remain instances of genuinely active compounds being fluorescent at the same time. Given this fact and the unique challenges of finding actives in protein-protein interaction screens, we chose not to discard actives associated with elevated fluorescence intensity values. Indeed, one of our actives, idamycin (also known as idarubicin), has well-documented fluorescent properties[37] while also being known for its antibacterial and antitumor activity.
The total number of hits identified from the dual-fluorophore primary screen was low and this allowed the re-testing and retrospective analysis of essentially all actives without discrimination against those potentially caused by autofluorescence or quenching and without the application of cutoff filters against single-point responses. The compounds which did confirm were the ones exhibiting complete concentration-response curves from the primary screen which further validates the qHTS approach as a means of reliable actives identification. The application of both qHTS and dual-color screening assay represents a front-loading of sorts and ensures that for a difficult target, such as the one under study, combined with a certain assay format, enough measures are taken to both minimize the effect of false positives (thus avoiding extended, lengthy and costly cherrypicking) and to maximize the chances of actives identification. While orthogonal secondary assays will have to be performed in order to unequivocally establish the biological relevance of the confirmed actives, we note that among the compounds identified here are several which possess attractive features. On the one hand, known bioactives, such as idarubicin, are well-characterized with respect to toxicity and can thus be rapidly tested in various in vivo systems. On the other hand, less well characterized compounds such as NCGC00038539 might serve as starting points for potency optimization.
In summary, the application of dual-color concentration-response screen against the C-terminal domain of BRCA1 and the phosphorylated-peptide portion of the helicase BACH1 allowed fast and reliable identification of actives. The initial characterization of actives by retesting them against both the green and red assays confirmed the activity of most hits and should serve as a basis for secondary testing of select compounds. More generally, as this work is a result of the NIH Molecular Libraries Initiative created in part to support chemical probe development for novel and poorly characterized targets provided by the academic research community[38], the reported assay and screen strategy and implementation should serve as guidance to researchers wishing to perform HTS on similar targets.
Table 1.
BRCA1 Interleaved qHTS protocol.
| Step | Parameter | Value | Description |
|---|---|---|---|
| 1 | Reagent | 3 μL | Complex and free probe solutions |
| 2 | Library Compounds | 23 nL | 76 μM to 0.97 nM titration series |
| 3 | Controls | 23 nL | Decapeptide titration intraplate |
| 4 | Time, speed | 15 sec, 1000 rpm | Centrifugation |
| 5 | Incubation Time | 12 min | Compound interaction with targets |
| 6 | Assay Readout | Ex480 nm/Em540 nm and Ex525 nm/Em598 nm | ViewLux fluorescence polarization read |
|
| |||
| Step Notes | |||
|
| |||
| 1 | Black solid bottom plates, single-tip dispense, Green/Red complex in columns 1, 2, 5–48, Green/Red free probe in columns 3 and 4. | ||
| 2 | Pintool transfer of library into columns 5–48. | ||
| 3 | Pintool transfer of decapeptide SRSTpSPTFNK titration into upper half of column 2. | ||
| 4 | Plate centrifugation to remove bubbles. | ||
| 5 | Room temperature incubation in auxiliary hotel. | ||
| 6 | FP, as well as parallel and perpendicular light intensity values collected. | ||
Acknowledgments
This research was supported by the NIH Roadmap for Medical Research and the Intramural Research Program of the NHGRI, NIH.
Footnotes
AUTHOR CONTRIBUTIONS
AS, AY, AN, and JI designed research. AS and AY performed assay miniaturization, high-throughput screening, and confirmation experiments. LR performed secondary assays. AS, AJ, AY, JI, CA, LR, and AN analyzed the data. LR and AN contributed reagents. AS, AJ, JI, AN, and CA wrote the paper.
COMPETING INTERESTS STATEMENT
The authors declare no competing financial interests.
Publisher's Disclaimer: This is a PDF file of an unedited manuscript that has been accepted for publication. As a service to our customers we are providing this early version of the manuscript. The manuscript will undergo copyediting, typesetting, and review of the resulting proof before it is published in its final citable form. Please note that during the production process errors may be discovered which could affect the content, and all legal disclaimers that apply to the journal pertain.
References
- 1.Arkin MR, Randal M, DeLano WL, Hyde J, Luong TN, Oslob JD, Raphael DR, Taylor L, Wang J, McDowell RS, Wells JA, Braisted AC. Proc Nat Acad Sci USA. 2003;100:1603–8. doi: 10.1073/pnas.252756299. [DOI] [PMC free article] [PubMed] [Google Scholar]
- 2.Arkin MR, Wells JA. Nat Rev Drug Disc. 2004;3:301–17. doi: 10.1038/nrd1343. [DOI] [PubMed] [Google Scholar]
- 3.Inglese J, Johnson RL, Simeonov A, Xia M, Zheng W, Austin CP, Auld DS. Nat Chem Biol. 2007;3:466. doi: 10.1038/nchembio.2007.17. [DOI] [PubMed] [Google Scholar]
- 4.Feng BY, Shelat A, Doman TN, Guy RK, Shoichet BK. Nat Chem Biol. 2005;1:146–8. doi: 10.1038/nchembio718. [DOI] [PubMed] [Google Scholar]
- 5.Feng BY, Simeonov A, Jadhav A, Babaoglu K, Inglese J, Shoichet BK, Austin CP. J Med Chem. 2007;50:2385–90. doi: 10.1021/jm061317y. [DOI] [PubMed] [Google Scholar]
- 6.Bogan AA, Thorn KS. J Mol Biol. 1998;280:1–9. doi: 10.1006/jmbi.1998.1843. [DOI] [PubMed] [Google Scholar]
- 7.Tesmer JJ. Science. 2006;312:377–8. doi: 10.1126/science.1126903. [DOI] [PubMed] [Google Scholar]
- 8.Cantor SB, Bell DW, Ganesan S, Kass EM, Drapkin R, Grossman S, Wahrer DC, Sgroi DC, Lane WS, Haber DA, Livingston DM. Cell. 2001;105:149–60. doi: 10.1016/s0092-8674(01)00304-x. [DOI] [PubMed] [Google Scholar]
- 9.Kim H, Huang J, Chen J. Nat Struct Mol Biol. 2007;14:710–5. doi: 10.1038/nsmb1277. [DOI] [PubMed] [Google Scholar]
- 10.Wang B, Matsuoka S, Ballif BA, Zhang D, Smogorzewska A, Gygi SP, Elledge SJ. Science. 2007;316:1194–8. doi: 10.1126/science.1139476. [DOI] [PMC free article] [PubMed] [Google Scholar]
- 11.Yu X, Wu LC, Bowcock AM, Aronheim A, Baer R. J Biol Chem. 1998;273:25388–92. doi: 10.1074/jbc.273.39.25388. [DOI] [PubMed] [Google Scholar]
- 12.Manke IA, Lowery DM, Nguyen A, Yaffe MB. Science. 2003;302:636–9. doi: 10.1126/science.1088877. [DOI] [PubMed] [Google Scholar]
- 13.Yu X, Chen J. Mol Cell Biol. 2004;24:9478–86. doi: 10.1128/MCB.24.21.9478-9486.2004. [DOI] [PMC free article] [PubMed] [Google Scholar]
- 14.Yu X, Chini CC, He M, Mer G, Chen J. Science. 2003;302:639–42. doi: 10.1126/science.1088753. [DOI] [PubMed] [Google Scholar]
- 15.Liu Z, Wu J, Yu X. Nat Struct Mol Biol. 2007;14:716–20. doi: 10.1038/nsmb1279. [DOI] [PubMed] [Google Scholar]
- 16.Kim H, Chen J, Yu X. Science. 2007;316:1202–5. doi: 10.1126/science.1139621. [DOI] [PubMed] [Google Scholar]
- 17.Sobhian B, Shao G, Lilli DR, Culhane AC, Moreau LA, Xia B, Livingston DM, Greenberg RA. Science. 2007;316:1198–202. doi: 10.1126/science.1139516. [DOI] [PMC free article] [PubMed] [Google Scholar]
- 18.Lokesh GL, Muralidhara BK, Negi SS, Natarajan A. J Am Chem Soc. 2007;129:10658–9. doi: 10.1021/ja0739178. [DOI] [PubMed] [Google Scholar]
- 19.Varma AK, Brown RS, Birrane G, Ladias JA. Biochemistry. 2005;44:10941–6. doi: 10.1021/bi0509651. [DOI] [PubMed] [Google Scholar]
- 20.Williams RS, Lee MS, Hau DD, Glover JN. Nat Struct Mol Biol. 2004;11:519–25. doi: 10.1038/nsmb776. [DOI] [PubMed] [Google Scholar]
- 21.Botuyan MV, Nomine Y, Yu X, Juranic N, Macura S, Chen J, Mer G. Structure. 2004;12:1137–46. doi: 10.1016/j.str.2004.06.002. [DOI] [PMC free article] [PubMed] [Google Scholar]
- 22.Clapperton JA, Manke IA, Lowery DM, Ho T, Haire LF, Yaffe MB, Smerdon SJ. Nat Struct Mol Biol. 2004;11:512–8. doi: 10.1038/nsmb775. [DOI] [PubMed] [Google Scholar]
- 23.Shiozaki EN, Gu L, Yan N, Shi Y. Mol Cell. 2004;14:405–12. doi: 10.1016/s1097-2765(04)00238-2. [DOI] [PubMed] [Google Scholar]
- 24.Rodriguez M, Yu X, Chen J, Songyang Z. J Biol Chem. 2003;278:52914–8. doi: 10.1074/jbc.C300407200. [DOI] [PubMed] [Google Scholar]
- 25.Inglese J, Auld DS, Jadhav A, Johnson RL, Simeonov A, Yasgar A, Zheng W, Austin CP. Proc Nat Acad Sci USA. 2006;103:11473–8. doi: 10.1073/pnas.0604348103. [DOI] [PMC free article] [PubMed] [Google Scholar]
- 26.Cleveland PH, Koutz PJ. Assay Drug Dev Technol. 2005;3:213–25. doi: 10.1089/adt.2005.3.213. [DOI] [PubMed] [Google Scholar]
- 27.Hill AV. J Physiol (London) 1910;40:4–7. [Google Scholar]
- 28.Niles WD, Coassin PJ. Assay Drug Devel Technol. 2005;3:189–202. doi: 10.1089/adt.2005.3.189. [DOI] [PubMed] [Google Scholar]
- 29.Lokesh GL, Rachamallu A, Kumar GD, Natarajan A. Anal Biochem. 2006;352:135–41. doi: 10.1016/j.ab.2006.01.025. [DOI] [PubMed] [Google Scholar]
- 30.Cheng X, Hochlowski J, Tang H, Hepp D, Beckner C, Kantor S, Schmitt R. J Biomol Screen. 2003;8:292–304. doi: 10.1177/1087057103008003007. [DOI] [PubMed] [Google Scholar]
- 31.Kozikowski BA, Burt TM, Tirey DA, Williams LE, Kuzmak BR, Stanton DT, Morand KL, Nelson SL. J Biomol Screen. 2003;8:205–9. doi: 10.1177/1087057103252617. [DOI] [PubMed] [Google Scholar]
- 32.Zhang JH, Chung TD, Oldenburg KR. J Biomol Screen. 1999;4:67–73. doi: 10.1177/108705719900400206. [DOI] [PubMed] [Google Scholar]
- 33.Yasgar A, Shinn P, Michael S, Zheng W, Jadhav A, Auld D, Austin C, Inglese J, Simeonov A. JALA. 2007 doi: 10.1016/j.jala.2007.12.004. submitted. [DOI] [PMC free article] [PubMed] [Google Scholar]
- 34.Eastwood BJ, Farmen MW, Iversen PW, Craft TJ, Smallwood JK, Garbison KE, Delapp NW, Smith GF. J Biomol Screen. 2006;11:253–261. doi: 10.1177/1087057105285611. [DOI] [PubMed] [Google Scholar]
- 35.Simeonov A, Jadhav A, Sayed A, Wang Y, Nelson M, Thomas C, Inglese J, Williams D, Austin C. PLoS NTDS. 2007 in press. [Google Scholar]
- 36.White EL, Southworth K, Ross L, Cooley S, Gill RB, Sosa MI, Manouvakhova A, Rasmussen L, Goulding C, Eisenberg D, Fletcher TM., 3rd J Biomol Screen. 2007;12:100–5. doi: 10.1177/1087057106296484. [DOI] [PubMed] [Google Scholar]
- 37.Perez-Ruiz T, Martinez-Lozano C, Sanz A, Bravo E. Electrophoresis. 2001;22:134–8. doi: 10.1002/1522-2683(200101)22:1<134::AID-ELPS134>3.0.CO;2-X. [DOI] [PubMed] [Google Scholar]
- 38.Austin CP, Brady LS, Insel TR, Collins FS. Science. 2004;306:1138–9. doi: 10.1126/science.1105511. [DOI] [PubMed] [Google Scholar]


