Abstract
Purpose.
To understand molecular mechanisms underlying photobleaching of the RPE fluorophores responsible for fundus autofluorescence.
Methods.
ARPE-19 cells were allowed to accumulate the bisretinoid, A2E, and were irradiated at 430 nm. For some experiments, the cells were pretreated with vitamin E or sulforaphane and N-acetylcysteine; samples included A2E-free cells. The cells were analyzed by fluorescence microscopy and ultra–performance liquid chromatography-mass spectrometry (UPLC-MS) analysis. A2E free cells were also irradiated and analyzed. Cell death was quantified by double labeling with a membrane impermeable dye and 4′,6′-diamino-2-phenylindole (DAPI).
Results.
A2E that had accumulated in ARPE-19 cells exhibited irradiation-associated autofluorescence bleaching despite the absence of appreciable cell death. Chromatographic analysis with absorbance, fluorescence, and mass spectrometry detection revealed that irradiation of A2E was associated with A2E photoisomerization, photooxidation, and photodegradation. Pretreatment with vitamin E favored fluorescence recovery; this finding was consistent with a process involving photooxidation. A2E that was not cell-associated underwent irradiation-induced bleaching, but fluorescence recovery was not observed.
Conclusions.
Using cell-associated A2E as a model of RPE bisretinoid behavior, photobleaching and autofluorescence recovery was observed; these changes were similar to RPE autofluorescence reduction in vivo. The potential for autofluorescence recovery is dependent on light dose and antioxidant status. Fluorescence bleaching of bisretinoid involves photooxidative and photodegradative processes.
Fundus autofluorescence bleaching involves bisretinoid photooxidation and photodegradation, the extent of which is dependent on light dose.
Introduction
For the diagnosis and monitoring of retinal disease, fundus autofluorescence imaging has become an increasingly valuable modality. In a healthy retina, the inherent autofluorescence of the human retina originates from fluorophores in the RPE that accumulate as lipofuscin.1–3 Several characteristics of fundus autofluorescence, including its emission spectra, age-dependent intensities, and disease-related features, are all consistent with RPE lipofuscin being the source.3 The fluorescent constituents of RPE lipofuscin that have been isolated and characterized are diretinal pigments that form from inadvertent reactions of all-trans-retinal, the vitamin A–derived chromophore that forms consequent to photoisomerization of 11-cis-retinal. The lipofuscin bisretinoids of RPE that have been structurally characterized include A2E (λMAX 338, 439 nm); iso-A2E and other isomers (λMAX 339, 431 nm); A2-dihydropyridine-phosphatidylethanolamine (A2-DHP-PE, λMAX 333, 490 nm); all-trans-retinal dimer (λMAX 290, 428 nm); and all-trans-retinal dimer-phosphatidylethanolamine (λMAX 290, 510 nm); and A2-glycerophosphoethanolamine (GPE) (λMAX 339, 439 nm).4–7 It has been suggested that A2E is also excited by energy transfer from other blue light–absorbing lipofuscin fluorophores8; whether the latter agents are the other known bisretinoids has not been tested.
Fundus autofluorescence has been studied by spectrophotometry and by scanning laser ophthalmoscopy using a range of wavelengths. A more recent addition to these modalities is adaptive optics scanning laser ophthalmoscopy (AOSLO),9,10 with in vivo fluorescence capability. The superior resolution and contrast afforded by AOSLO are enabled by the detection and correction for higher-order optical aberrations in the eye. AOSLO imaging of the natural autofluorescence of the RPE permits viewing of individual cells within the RPE mosaic. However, initial studies in nonhuman primates revealed that exposure using power levels below that dictated by light safety standards, caused RPE cellular changes.9–11 Specifically, with 568-nm excitation and average powers of 55 and 150 μW (289 and 788 J/cm2, respectively), autofluorescence was diminished in the exposed area by as much as 42%, immediately after irradiation; after 6 days, cellular disruption was observed in the same location. Conversely, when light was delivered at 40-μW (210 J/cm2) power such that autofluorescence was decreased by only 20%, full recovery of autofluorescence was observed within hours and there was no sign of cellular damage. Similar bleaching was observed with 488-nm excitation.11 The AOSLO delivery method, per se, did not appear to be the cause of the cellular changes since scanning with the SLO without adaptive optics (AO) or illumination with a uniform field produced the same autofluorescence bleaching and RPE damage. It was significant that at the 55-μW exposure, damage to the RPE cell monolayer was observed without detectable changes in the photoreceptor cell. This finding pointed to RPE as the site of the original damage.10
More than one mechanism could explain the bleaching of autofluorescence that was observed in RPE cells that did not sustain visible injury. These processes could include photoisomerization, photooxidation, and/or photodegradation, all of which are characteristic of bisretinoids. Here study authors explored these mechanisms in relation to changes in autofluorescence.
Methods
Cell Cultures
ARPE-19 cells (American Type Culture Collection, Manassas, VA) were grown on 8-well plastic chamber slides (Nalge Nunc International, Rochester, NY) the bottoms of which were imprinted with a 2 × 2-mm ruled grid with each square measuring 2 × 2 mm2. The latter grid was used to record and relocate cell populations. For HPLC analysis, cells were grown in 35-mm dishes. Confluent cultures were allowed to accumulate A2E from a 10-μM concentration in the culture media. With this protocol, A2E accumulated in the lysosomal compartment of the cells to levels that were comparable to amounts present in vivo.12 In some experiments, cultures were treated with vitamin E or vitamin E acetate (Sigma-Aldrich, St. Louis, MO; 100 μM) for 24 hours prior to light exposure, or N-acetyl-L-cysteine (Sigma-Aldrich; 500 μM) and sulforaphane (LKT Laboratories, St. Paul, MN; 5 μM) for 48 hours.
Irradiation
Immediately before illumination, culture medium was replaced with phosphate-buffered saline containing calcium, magnesium, and glucose. Cells in 8-well chambers were exposed to light delivered for 25 seconds via the ×40 objective of an inverted fluorescence microscope (IX70 Olympus) with an FITC-appropriate filter set (460–490-nm band-pass excitation filter) and 100-W mercury lamp (18.5 mW/cm2; measured at 480 nm with a Newport optical power meter, model 840). The diameter of the exposed area was 0.49 mm. Follow-up imaging was performed immediately after irradiation and 2, 4, 6, 8, and 24 hours after exposure using a digital camera (Olympus S97809; Optronics, Goleta, CA) and acquisition software (PictureFrame; Optronics). Captured images were analyzed using ImageJ software to generate grayscale values. Values inside the illuminated area were expressed relative to non-irradiated values, with the latter equal to 1. Data from three repetitions per experiment and three experiments were averaged. Statistical analysis was by one-way analysis of variance followed by Newman-Keul Multiple Comparison Test (PRISM 5; GraphPad Software, La Jolla, CA).
For irradiation of 35-mm dishes, the entire dish of cells was irradiated for 4 minutes and 6 minutes at 430 nm ± 20 nm (1.4 mWcm−2) delivered from a halogen source. The excitation maximum of A2E is approximately 439 nm. The irradiated cells were harvested immediately or incubated for 1 hour, 8 hours, or 24 hours before collection.
Cell-free A2E (100 μM in 200 μL DPBS with 1% DMSO) was irradiated for 100 seconds at 430-nm intensity 70%. Subsequently, the mixture was incubated for 0, 1, 8, and 24 hours at room temperature in the dark, then dried under argon, and redissolved in 60 μL of methanol. UPLC analysis was performed with injection volume of 20 μL as described below.
Assaying Glutathione (GSH)
The content of GSH in non-irradiated and irradiated cells (6-minute exposure, 1 hour after irradiation) was measured using an assay kit (BioVision GSH; Mountain View, CA).
Cell Death Assay
The nuclei of dead cells were labeled with a membrane impermeable dye (Dead Red; Invitrogen, Carlsbad, CA) and the nuclei of all cells with 4′,6′-diamino-2-phenylindole (DAPI).13 Digital images were obtained using a microscope with Axiocam camera (Zeiss Axioplan II; Carl Zeiss Inc., Thornwood, NY). Subsequently, Dead Red and DAPI-stained nuclei were counted and nonviable cells expressed as a percentage of the total number of cells in a field. Means are based on five fields per illumination zone and three experiments. For statistical analysis, ANOVA followed by Newman-Keul multiple comparison or two-tailed unpaired t-test, were performed.
Ultra-Performance Liquid Chromatography-Mass Spectrometry (UPLC-MS) Analysis
A single quadrupole mass spectrometer (ACQUITY SQD; Waters Corporation, Milford, MA) coupled online to a Waters ACQUITY UPLC system (Waters Corporation) was utilized with photodiode array and fluorescence detectors, sample manager, and binary solvent manager. The mass spectrometer was equipped with ESCi multi-mode ionization and ion trap analyzer operating in full scan mode from mass to charge ratio (m/z) 200 ∼ 1200. For compound elution, a reverse phase column (X-Bridge C18; Waters Corporation; 2.5 μm, 30 × 50 mm) was used with a gradient of acetonitrile/methanol (1:1 mixture) in water with 0.1% formic acid (70%–85% acetonitrile/methanol, 0–60 minutes with a flow rate of 0.5 mL/min). Absorbance was detected at 430 nm and fluorescence emission at 600 nm.
Results
Autofluorescence Reduction and Bleaching Is Replicated in an In Vitro Cell Model
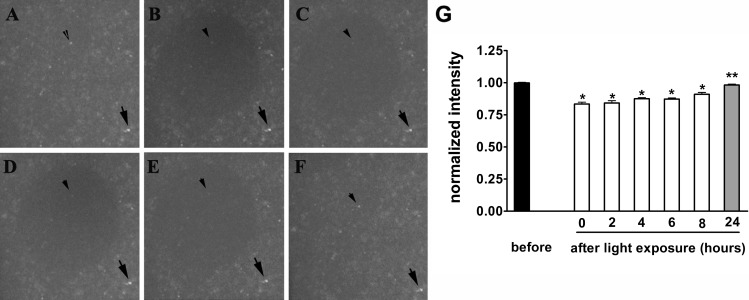
Study authors began by establishing a cell culture model that would mimic, at least in part, the in vivo RPE monolayer. To this end, ARPE-19 cells were allowed to accumulate the bisretinoid A2E and conditions of irradiation were determined that would not lead to cell death, but that resulted in clearly visible fluorescence bleaching. In preliminary experiments, cells were exposed for periods of time between 5 and 40 seconds (5, 10, 15, … 40 seconds); a gradual reduction in fluorescence intensity with increased exposure duration was observed. Specifically, the decrease was 8% (± 0.03) after a 5-second exposure and 25% (± 0.01) after a 40-second exposure. For subsequent experiments, study authors chose 25-second exposures. Accordingly, with focal exposures at 480 nm (18.5 mW/cm2) for 25 seconds, autofluorescence emitted from the A2E-containing cells was reduced by 16.4% immediately after light exposure (P < 0.001; three experiments; Fig. 1). Subsequently, fluorescence intensity steadily increased 2, 4, and 8 hours after irradiation but remained lower than values obtained before irradiation. By 24 hours post-exposure, fluorescence intensity had recovered to levels comparable to pre-irradiation values (P > 0.05). Under the conditions utilized, autofluorescence bleaching and recovery occurred in the absence of significant cell death (Fig. 2). These results showed that bisretinoids of retina such as A2E can exhibit autofluorescence reduction and recovery.
Figure 1. .
Fluorescence bleaching and recovery. Fluorescence microscopic images. ARPE-19 cells that had accumulated A2E were exposed to 480 nm light (25 seconds). (A) Before light exposure. (B) Immediately after exposure. (C) 2 hours after exposure. (D) 4 hours after exposure. (E) 8 hours after exposure. (F) 24 hours after exposure. (G) Arrows, fluorescent spot outside area of illumination; arrowhead, fluorescent spot inside area of illumination. Fluorescence measured as relative grey scale values. For normalization, the intensity values within the irradiated area were expressed relative to values in the surround. *P < 0.001 as compared with values before exposure. ** Not different (P > 0.05) as compared with values before exposure. Values are mean ± SEM of three replicates.
Figure 2. .
A2E bleaching in cultured ARPE-19 is not associated with cell death. ARPE-19 cells that had accumulated A2E were irradiated (480 nm, 25 seconds) over a circular field 0.8 mm in diameter. (A) Imaging immediately after irradiation demonstrates fluorescence bleaching. (B) After 24 hours, the nuclei of nonviable RPE were labeled with a membrane impermeable dye and all nuclei were stained with DAPI. (C) Counting of nuclei of nonviable cells within (RPE, A2E 18.5 mW/cm2) and outside (RPE A2E) the irradiated zone. Mean ± SEM; values are not significantly different (P > 0.05, two-tailed unpaired t-test). DAPI-labeled nuclei/field were (mean ± SEM): 806 ± 11 (RPE, A2E 18.5 mW/cm2) and 813 ± 9 (RPE, A2E) (P > 0.05, two-tailed unpaired t-test).
AF Reduction Was Associated with Decreased A2E Absorbance: UPLC Monitoring
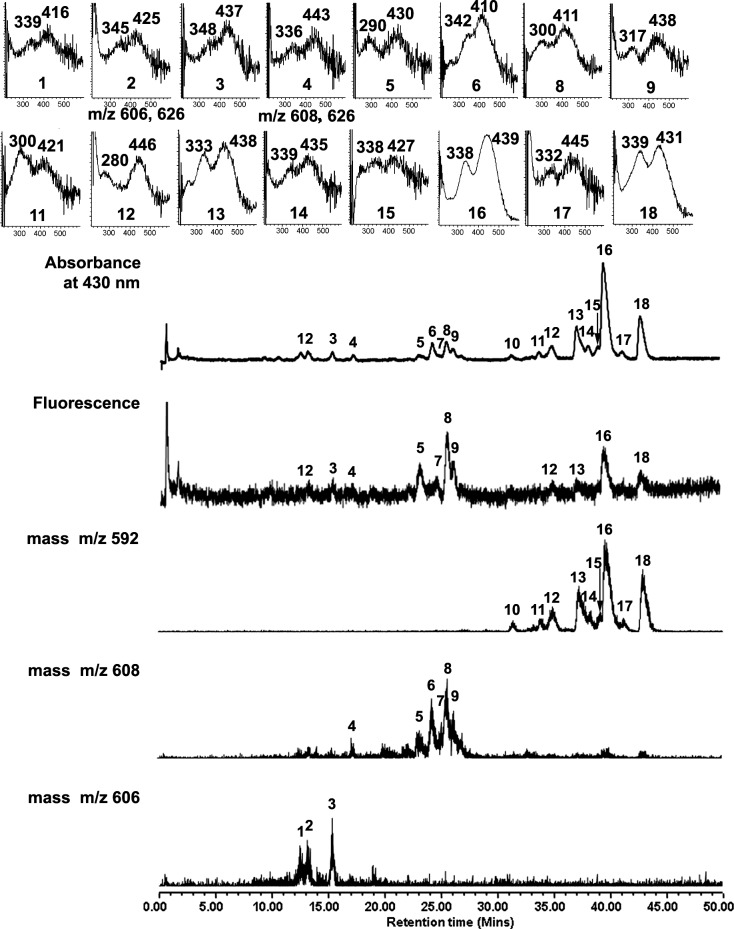
To better understand the photochemical and molecular correlates of the fluorescence variation observed when A2E is irradiated, A2E-containing ARPE-19 cells were exposed to light (430 nm) and analyzed by UPLC with absorbance, fluorescence, and mass spectrometric monitoring. Irradiation levels that would allow for fluorescence changes in the presence of minimal cell death were chosen. With a 6-minute irradiation, the percent of nonviable cells was 0.21 ± 0.2; 0.34 ± 0.3; and 0.58 ± 0.4 after 1, 8, and 24 hours, respectively (mean ± SEM) as compared with 0.11 ± 0.1 in non-irradiated cells. Since total DAPI-labeled nuclei per field were also not significantly lower (170 ± 4; 158 ± 11; 160 ± 7; 175 ± 3 with no irradiation and 1, 8, and 24 hours, respectively; P > 0.05), a 6-minute irradiation was considered as not leading to appreciable cell death. Eighteen (18) chromatographic peaks were analyzed including A2E, isoA2E, and other minor cis-isomers of A2E (retention time ∼30–45 minutes); and photooxidized forms of A2E (retention time ∼10–30 minutes; Fig. 3), all of which were identified on the basis of retention time, mass, and absorbance. In the following text, all-trans A2E refers to the all-trans isomer (E configuration) that is the most abundant isomer, as opposed to cis-isomers of A2E, and the photooxidized forms of A2E.
Figure 3. .
UPLC-ESI analysis of cell-associated A2E following irradiation (430 nm, 6 minutes). Chromatographic display demonstrating detection by absorbance, fluorescence, and mass. Absorbance was monitoring at 430 nm; fluorescence detected with 430-nm excitation and 600-nm emission. Selected ion monitoring at 592, 608, and 606. Insets above, UV-visible absorbances.
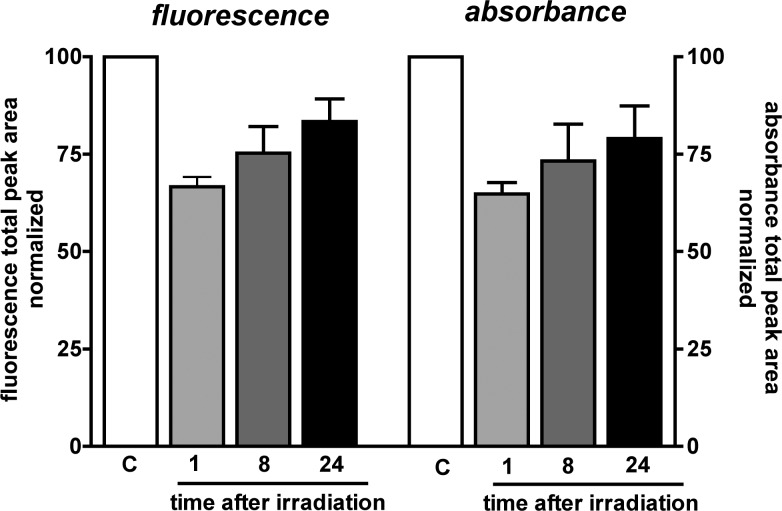
The decline and recovery of autofluorescence was evident when the areas of the 18 UPLC peaks attributable to all-trans-A2E, A2E isomers, and photooxidized A2E were calculated and summed. Shown in Figure 4 are total fluorescence and absorbance peak areas after peak separation attained by UPLC. Total fluorescence was decreased after irradiation. This reduction was always accompanied by a decline in total absorbance of compound (A2E, A2E isomers, photooxidized A2E). For instance, the mean decrease in absorbance was 35 ± 2.9% (mean ± SEM; four experiments) while fluorescence was diminished by a mean value of 33 ± 2.4% (mean ± SEM). After 24 hours of fluorescence had increased by 17 ± 4% (mean ± SEM) (relative to fluorescence at 1 hour after irradiation). This fluorescence recovery represented an attainment of fluorescence intensity that was 83 ± 6% (mean ± SEM) of the fluorescence exhibited by the non-irradiated A2E-containing cells. Full return of fluorescence intensity was not observed by UPLC quantitation.
Figure 4. .
Total fluorescence and absorbance, calculated as total chromatographic peak area (detection at 430 nm), of A2E in ARPE-19 cells without irradiation (control) at 1, 8, and 24 hours after irradiation (6 minutes). Mean ± SEM, four experiments.
Recovery of Autofluorescence after Bleaching Is Facilitated by Pretreatment of the Cells with Vitamin E and by Upregulated GSH
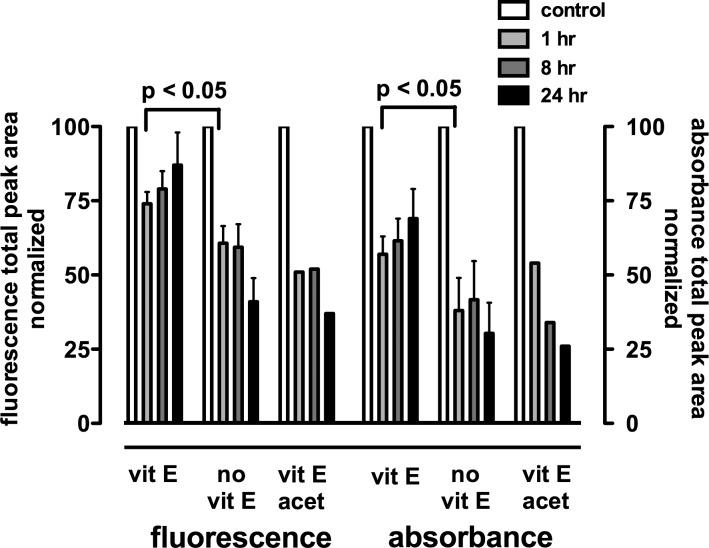
Pretreatment with vitamin E favored fluorescence recovery after irradiation-associated bleaching when compared with no vitamin E treatment or treatment with inactive vitamin E acetate used as an additional control. Shown in Figure 5 are experiments employing irradiation conditions wherein fluorescence recovery was not observed in the absence of vitamin E; however, prior vitamin E accumulation enabled fluorescence recovery. The potential for fluorescence recovery likely depended on the extent of the original absorbance decrease since the decrease in absorbance 1 hour after irradiation was significantly reduced (P < 0.05) by vitamin E treatment as compared with the corresponding untreated control.
Figure 5. .
Vitamin E pretreatment favors autofluorescence recovery following bleaching. Total fluorescence and absorbance were determined from total chromatographic peak area (430 nm monitoring) in non-irradiated (control) A2E-containing cells and A2E-containing cells analyzed 1, 8, and 24 hours after irradiation. Cells were allowed to accumulate vitamin E (vit E) or vitamin E acetate (vit E acet) 24 hours before irradiation (6 minutes) or were not pre-treated (no vit E). Mean ± SEM, three experiments.
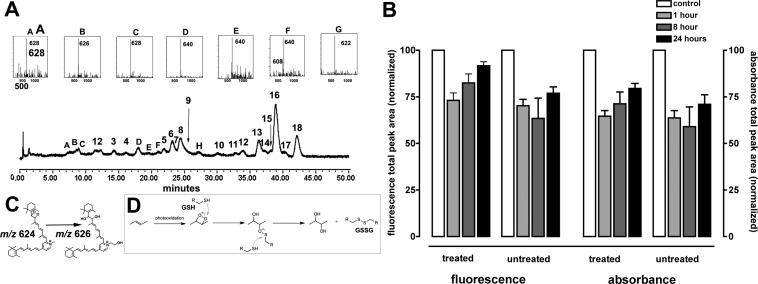
Study authors also treated the cells with the phytochemical sulforaphane and the glutathione (GSH) precursor, N-acetylcysteine. Sulforaphane is not directly involved in oxidation/reduction reactions, but instead potentiates the antioxidant capacity of the cell by inducing protective phase 2 enzymes such as glutathione-S-transferases (GSTs) NAD(P)H:quinone reductase (NQO1), epoxide hydrolase, g-glutamylcysteine synthetase, and UDP-glucuronosyl transferases.14 In these experiments, treatment with N-acetylcysteine and sulforaphane increased cellular GSH levels 2.5-fold (GSH, nM per mg protein: 30.9 ± 8.2 and 79.5 ± 18 [mean ± SEM] in untreated and treated A2E-containing cells, respectively). As a reducing agent, GSH aids in protecting cellular elements from damage mediated by reactive oxygen species. Participation of GSH in the response to irradiation is indicated by GSH utilization and depletion (GSH, nM per mg protein: 79.5 ± 18 and 49.7 ± 10 [mean ± SEM] in non-irradiated and irradiated A2E-containing cells, respectively). Although a protective effect of increased GSH on fluorescence and absorbance loss after irradiation was not detected, fluorescence recovery appeared to be facilitated (Fig. 6). Interestingly, with increased cellular GSH, study authors observed a somewhat different pattern of UPLC peaks; in particular, peaks A–G (Fig. 6A) were not present in the earlier chromatograms. It is suggested that the peak exhibiting m/z 626 may be indicative of diol-bearing A2E (Fig. 6C), the latter forming by donation of hydrogens from two GSH to an endoperoxide (peroxy-A2E; m/z 624) generated following singlet oxygen production by photosensitized A2E (Fig. 6D).15
Figure 6. .
Autofluorescence bleaching and recovery in A2E-containing cells that were treated with sulforaphane and N-acetylcysteine to enhance GSH levels before irradiation. (A) Chromatographic display demonstrating detection by absorbance and mass. Inset, Top: UV-visible absorbance spectra; Bottom: mass to charge ratio (m/z). (B) Total fluorescence and absorbance were determined from total chromatographic peak area (430 nm monitoring) in non-irradiated (control) A2E-containing cells and A2E-containing cells analyzed 1, 8, and 24 hours after irradiation (6 minutes). Cells were allowed to accumulate sulforaphane and N-acetylcysteine 24 hours before irradiation (treated) or were not pretreated (untreated). Mean ± SEM, three experiments. (C) The m/z 626 species could reflect a diol forming by proton donation from GSH to endoperoxide-bearing A2E (m/z 624). (D) Proposed mechanism for conversion of endoperoxide to diol with proton donation from GSH. GSSG, oxidized glutathione.
Quantitation of UPLC Peaks Reveals Post-Irradiation Changes
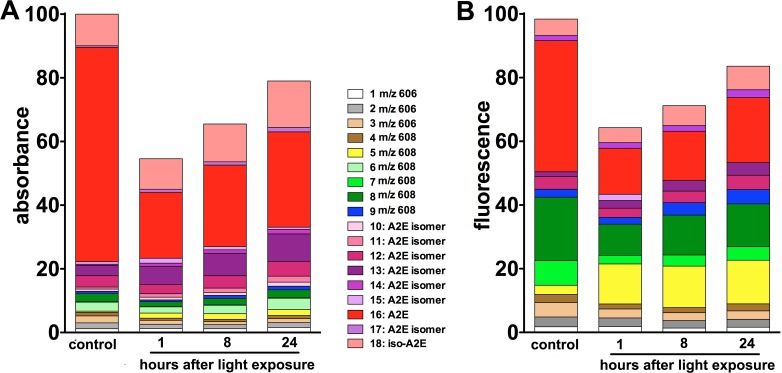
Measurement of UPLC peaks by integrating peak areas also revealed post-irradiation changes in the fluorescence emission and absorbance of individual peaks. In Figure 7, these complex data was presented as stacked columns wherein the height of each segment in the column reflects the contribution of that peak to total absorbance (Fig. 7A) and total fluorescence emission (Fig. 7B) measured in non-irradiated A2E-containing cells. It is readily apparent that the total amount of compound decreased after irradiation, as did the total fluorescence emission (note the height of the absorbance and fluorescence columns). Inspection of the absorbance and fluorescence columns, under conditions of no irradiation, reveals that all-trans-A2E is the most abundant compound (60% of the total), but its contribution to overall fluorescence is only 40%. In terms of individual compounds, some were diminished in amount after irradiation (note absorbance column; Fig. 7A); in particular, this group included all-trans-A2E. The contribution of all-trans-A2E to the fluorescence of the cells was also initially reduced from 41% in non-irradiated cells to 15%, one hour after irradiation. However, at 8 and 24 hours after irradiation, the fluorescence contribution had increased to 16% and 21%, respectively, relative to fluorescence in the absence of irradiation. Underlying this increase in all-trans-A2E fluorescence contribution was an increase in all-trans-A2E absorbance, the latter reflecting all-trans-A2E amount. Specifically, all-trans-A2E absorbance increased from a low of 21% one hour after irradiation to 26% and 30% eight and 24 hours after irradiation, respectively (relative to the non-irradiated condition). This increase in detectable levels of non-oxidized A2E (both all-trans and cis-isomers) contributed to the increase in fluorescence that was observed between 8 and 24 hours after irradiation.
Figure 7. .
Contribution of individual UPLC peaks to total (100%) fluorescence and absorbance. ARPE-19 cells that had accumulated A2E were irradiated (6 minutes). Y-axis units are percent relative to the total in non-irradiated samples. Each segment in a column represents a UPLC peak as identified in Figure 3. (A) UPLC peak contribution to total absorbance. (B) UPLC peak contribution to total fluorescence. The height of each segment reflects the contribution of that peak to total absorbance in the non-irradiated samples measured after 1, 8, and 24 hours. Individual compounds, all-trans-A2E (peak 16), A2E isomers (peaks 10–15 and 17, 18), and photoxidized forms of A2E (peaks 1–9) were quantified as peak areas. Representative of eight experiments.
Trans to Cis-Photoisomerization of A2E Generates Isomers Exhibiting Similar or Greater Fluorescence Efficiency
Chromatographic separation (UPLC conditions: C) also enabled the detection of seven (7) A2E photo-isomers (Fig. 3). Identification was made according to identical mass (m/z 592) and similar retention times and absorbance spectra. In all-trans-A2E, all double bonds are in the E configuration while iso-A2E has a single cis olefin at the C13–C14 bond. The other isomers have one or two cis double bonds at other positions.5 Since the mechanisms of fluorescence bleaching and recovery could theoretically involve interconversions amongst isomers differing in fluorescence intensity, fluorescence efficiencies per absorbed photon (fluorescence peak height/absorbance peak height) were calculated for A2E, isoA2E, and three of the other cis-isomers. For four additional isomers, fluorescence peaks were not sufficiently detectable. A2E, isoA2E, and peak 13 had similar fluorescence efficiencies (0.03 to 0.06). Peak 12 and peak 17 had greater efficiencies (0.09 ± 0.003 and 0.22 ± 0.03, respectively), but neither of these isomers were present in an abundance sufficient to account for autofluorescence recovery after bleaching (Fig. 7).
Irradiation Is Accompanied by Changes in Some Photooxidized Forms of A2E
Also detected were photooxidized forms of A2E that eluted earlier than all-trans-A2E as would be expected of compounds having increased polarity (Fig. 3). Note that even in control non-irradiated samples, oxidized A2E was present since with routine handling of the cultures, the cells were exposed to some light. The all-trans- and cis isomers of A2E were always present with two absorbance maxima, an absorbance in the visible range (all-trans-A2E: ∼ 439 nm) that is generated by the long arm of the molecule and a second absorbance (all-trans-A2E: ∼ 335 nm) for which the short arm of the molecule is responsible. As previously demonstrated, the photooxidized forms of all-trans-A2E exhibit hypsochromic shifts in absorbance (relative to A2E and A2E isomers) due to oxidation-associated loss of double bond conjugation(s) (Fig. 3). On the basis of mass (m/z) and shifts in absorbance spectra, some of these peaks could be identified as compounds exhibiting the addition of one oxygen atom (m/z 608) on either the short arm (hypsochromic shift of the shorter wavelength absorbance) or long arm (hypsochromic shift in the longer wavelength absorbance) of A2E. In the present experiments, several of the individual oxidized species (peaks 2 and 3) were reduced in amount 1 hour after irradiation and exhibited a corresponding decrease in fluorescence contribution (Fig. 7). Conversely, other m/z 608 compounds (peaks 7 and 8) carrying oxidations on the short (peak 8) or long (peak 7) arm (Fig. 3) underwent initial decreases in fluorescence contribution followed by increases (Fig. 7). Yet again, other oxidized species were more abundant 1, 8, and 24 hours after irradiation; this was the case for peaks 5 and 9. Particularly notable was peak 5 since it made a substantial contribution to post-irradiation fluorescence. Moreover, its contribution to fluorescence was considerable, relative to absorbance (compare Fig. 7A to 7B). On the basis of its mass (m/z 608) and absorbance spectrum (430, 290 nm), this peak could be attributed to a photooxidized species exhibiting the addition of one oxygen atom on the short arm of A2E.
Post-Irradiation Autofluorescence Recovery Is Not Observed in the Cell-Free Assay
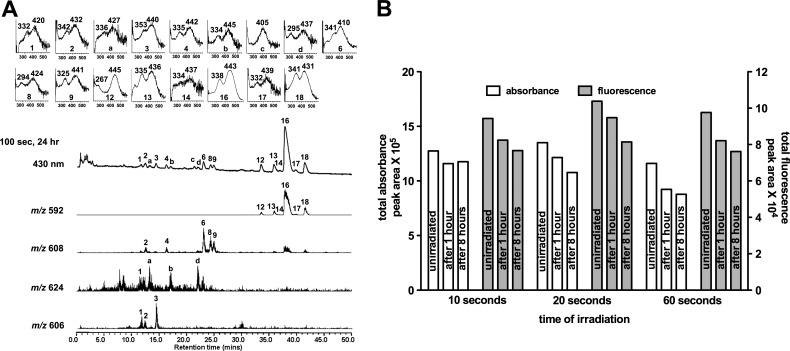
For comparison, study authors also irradiated cell-free A2E prepared in solvent and measured changes in absorbance and fluorescence. As opposed to the recovery of fluorescence after bleaching of cell-associated A2E, the fluorescence of cell-free A2E was always decreased immediately after irradiation and a subsequent upturn in fluorescence intensity was never observed (Fig. 8). Instead, at 1 and 8 hours after irradiation, total fluorescence and total absorbance continued to decline even as the samples were maintained in the dark. This failure of fluorescence recovery was consistent across a range of irradiation durations (10–60 seconds) that produced absorbance decreases from 8% to 23%. The chromatographic profiles of irradiated cell-associated A2E were also compared with A2E in solvent. Many of the same photoisomers and photooxidized derivatives of A2E were detected (Fig. 8). One striking difference between the cell-associated and cell-free experiments was an m/z 624 photooxidation species in the cell-free assay, but its absence when A2E was located in cells. The m/z 624 species is well known to form from the addition of 2 oxygens to A2E (m/z 592 + 2[16]) and presents with an endoperoxide at a carbon-carbon double bond.16 Under the cell-free conditions, the m/z 624 species was not detectable in the non-irradiated samples, but was prominent immediately after irradiation. Given the reactivity of endoperoxides, and the availability of many substrates in cells, it is reasonable to suggest that endoperoxide was depleted in the cells because of its reactivity.
Figure 8. .
UPLC-ESI analysis of cell-free A2E following irradiation (430 nm). (A) Chromatographic display demonstrating detection by absorbance, fluorescence, and mass; 100 seconds irradiation, 24 hours after irradiation. Absorbance was monitored at 430 nm; fluorescence detected with 430 nm excitation and 600 nm emission. Selected ion monitoring at 592, 606, 608, and 624 nm. Insets above: UV-visible absorbances. (B) Total absorbance and fluorescence following irradiation of cell-free A2E (10, 20, and 60 seconds) with analysis at 1 and 8 hours after irradiation. Individual compounds were quantified as peak area and summed. Data are representative of two experiments.
Discussion
SLO imaging of the inherent autofluorescence of the RPE cell monolayer can be accompanied by fluorescence bleaching, with return of autofluorescence intensity occurring depending on light intensities. This autofluorescence photobleaching can occur despite the use of light exposures two orders of magnitude below current safety standards. The central objective of the current study was to understand molecular mechanisms underlying the loss of autofluorescence and to begin to evaluate these events in relationship to risk of photodamage.
Through the development of an in vitro model, study authors have demonstrated that the bisretinoid A2E, after accumulation in ARPE-19 cells, exhibits irradiation-associated autofluorescence bleaching that is qualitatively similar to autofluorescence reduction in vivo. Depending on the conditions utilized, autofluorescence recovery was also observed in this model. It is difficult to directly compare the irradiances used in Morgan et al.9,10 with that used in the in vitro experiments presented here, since the retinal irradiances reported when bleaching was observed in the nonhuman primate were not corrected for transmittance of the eye. Another difference is that the bleaching observed in the in vivo experiments with non-human primates, involved the complex mixture of bisretinoids present in whole RPE lipofuscin11 while the study's culture model was based on A2E only. This distinction accounts for the differences in the effective wavelengths used to cause autofluorescence bleaching—488 and 568 nm in the case of the in vivo imaging, while 430 and 488 nm were used in the in vitro experiments. Absorbance of 568 nm light by A2E in whole lipofuscin would be minimal.5 Just the same, other known bisretinoids of lipofuscin having longer wavelength absorbances (e.g., all-trans-retinal dimer-phosphatidyl-ethanolamine, λMAX 290, 510 nm) can account for the photobleaching observed in response to 568 nm light.5 Nevertheless, correspondence between the two models is reflected in the observed percent fluorescence bleaching. Study authors found that with their cell model exposures conferring a bleach of approximately 16% permitted subsequent recovery of autofluorescence (Fig. 1) while the corresponding value in vivo was 20%.9–11 While only A2E was employed here, the other identified bisretinoids of RPE lipofuscin exhibit similar photoreactive properties5,16,17; thus these findings likely apply to the bisretinoids of RPE in general. These observations indicate that the behaviors of RPE bisretinoids can explain AOSLO-associated RPE autofluorescence bleaching.
What Processes Account for Bleaching of Autofluorescence following Irradiation of A2E-Containing Cells?
Study findings indicate that the processes of photoisomerization, photooxidation, and photodegradation were operating following irradiation in the experiments conducted. In the present experimental model, all fluorescence was emitted by A2E-related compounds, specifically A2E, A2E isomers, and photooxidized A2E. Total absorbance of these A2E-related compounds (A2E, A2E isomers, and photooxidized A2E), a value that reflects the abundance of compound, was reduced after irradiation (e.g., Fig. 7A, column height of control versus irradiated samples). At 24 hours post-irradiation, this reduction was 21%. Evidence for the involvement of photooxidation was forthcoming in experiments in which the A2E-containing cells were treated with the antioxidant vitamin E before irradiation. As expected given previous findings,13 vitamin E reduced the irradiation-associated loss of A2E; the most parsimonious explanation for this change is a protective effect of the antioxidant against photooxidation. A2E photooxidation follows from short-wavelength irradiation of A2E when the latter photosensitizes the formation of singlet oxygen and then quenches this reactive species; addition of oxygens at carbon-carbon double bonds results. Autofluorescence reduction in the A2E-containing cells, even under conditions that allowed fluorescence recovery, was associated with apparent A2E consumption, as measured by a decrease in absorbance (430-nm detection). Yet given that, an increase in the total amount of photooxidized A2E did not accompany irradiation in the experiments. A2E photooxidation alone could not account for the loss of compound. Since study authors have previously demonstrated that photooxidation of A2E leads to photodegradation,18 it was proposed that this photolytic process contributes to the consumption of A2E upon irradiation.
A mechanism involving deprotonation cannot account for the change in A2E fluorescence. Specifically, the alcohol moiety on the ethanolamine-derived tail of A2E has a pKa of 20 and thus would not deprotonate in the cytosol (∼pH 7.4) or in the lysosome (∼pH 5.3); and if it did, the fluorescence of A2E would not be affected. Note also that while the nitrogen atom of the pyridinium ring carries a positive charge, this is not due to the acquisition of a hydrogen ion (proton). Rather, A2E is a quaternary amine with the nitrogen covalently bound to four carbon atoms. The charge on the nitrogen is due to loss of an electron. This charge is permanent, independent of pH, and like other quaternary amines, the cation binds an anion (probably chloride) to form a salt.
Recovery of Autofluorescence following Photobleaching of A2E-Containing Cells
Despite the reduction in total A2E-related compound, fluorescence intensity was partially regained 24 hours after irradiation. For example, in the experiments illustrated in Figure 4, total fluorescence was only ∼15% less than the fluorescence intensity in the non-irradiated cells. To understand the mechanism by which fluorescence recovery occurred in this study's cell-based model, several possibilities were evaluated. For instance, heightened fluorescence contributions from photoisomers of A2E and/or photooxidized products were considered. Exposing A2E to light leads to photoisomerization, a nontoxic change in the configuration of the molecule. Several isomers have been detected5 (Fig. 3). However, while differences in fluorescence efficiencies were observed for some isomers, the abundance of these isomers was not sufficient to fully account for autofluorescence recovery.
Photooxidized A2E was a significant source of autofluorescence after irradiation. Specifically, oxidized A2E (peaks 1–9) accounted for 13% of the absorbance and 45% of the fluorescence in the control cells, and 18% of the absorbance and 53% of the fluorescence 24 hours after irradiation. Some particular species of photooxidized A2E—for instance, peaks 5 and 9—were important contributors to fluorescence post-irradiation.
However, increased fluorescence emission from photooxidized species of A2E cannot fully explain autofluorescence recovery. Instead, study authors were surprised to find that the greatest contributor to the partial return of autofluorescence was the observed increase in measurable levels of A2E. The possibility was considered that reverse oxidation of A2E would recoup A2E levels, allowing for increased cellular autofluorescence. However, as shown in Figure 7, although total fluorescence increased at 8 and 24 hours after irradiation, there was no corresponding decrease in the total amount of measurable oxidized species of A2E. Moreover, a survey of the literature failed to reveal an enzyme system or other mechanism that could remove oxygens from a compound such as A2E. Study authors are currently investigating other mechanisms that could explain these findings. Note that it was not possible to exclude the possibility that previously unknown fluorescent compounds were produced by photooxidation/photodegradation and that fluorescent emission from these species contributed to autofluorescence recovery.
Study findings indicate that autofluorescence bleaching during fluorescence ophthalmoscopy could have deleterious consequences, depending on the extent of bleaching, which in turn is related to light dose. Risks of imaging at these light levels should be weighed against the benefits of obtaining such images. The autofluorescence changes likely involve the photooxidation and photodegradation of RPE bisretinoids, a process that is not necessarily benign.18
Footnotes
Disclosure: K. Yamamoto, None; J. Zhou, None; J.J. Hunter, None; D.R. Williams, None; J.R. Sparrow, None
Supported by National Institutes of Health Grants EY004367 (DRW), EY12951 (JRS), and P30EY019007, and a Research to Prevent Blindness grant to the Department of Ophthalmology.
References
- 1. Delori FC, Dorey CK, Staurenghi G, Arend O, Goger DG, Weiter JJ. In vivo fluorescence of the ocular fundus exhibits retinal pigment epithelium lipofuscin characteristics. Invest Ophthalmol Vis Sci. 1995;36:718–729 [PubMed] [Google Scholar]
- 2. von Ruckmann A, Fitzke FW, Bird AC. In vivo fundus autofluorescence in macular dystrophies. Arch Ophthalmol. 1997;115:609–615 [DOI] [PubMed] [Google Scholar]
- 3. Delori FC, Keilhauer C, Sparrow JR, Staurenghi G. Origin of fundus autofluorescence Holz FG, Schmitz-Valckenberg S, Spaide RF, Bird AC. Atlas of Fundus Autofluorescence Imaging. Berlin Heidelberg: Springer-Verlag; 2007:17–29 [Google Scholar]
- 4. Sakai N, Decatur J, Nakanishi K, Eldred GE. Ocular age pigment “A2E”: an unprecedented pyridinium bisretinoid. J Am Chem Soc. 1996;118:1559–1560 [Google Scholar]
- 5. Sparrow JR, Gregory-Roberts E, Yamamoto K, et al. The bisretinoids of retinal pigment epithelium. Prog Retin Eye Res. 2012;31:121–135 [DOI] [PMC free article] [PubMed] [Google Scholar]
- 6. Weng J, Mata NL, Azarian SM, Tzekov RT, Birch DG, Travis GH. Insights into the function of Rim protein in photoreceptors and etiology of Stargardt's disease from the phenotype in abcr knockout mice. Cell. 1999;98:13–23 [DOI] [PubMed] [Google Scholar]
- 7. Maeda A, Golczak M, Maeda T, Palczewski K. Limited roles of Rdh8, Rdh12, and Abca4 in all-trans-retinal clearance in mouse retina. Invest Ophthalmol Vis Sci. 2009;50:5435–5443 [DOI] [PMC free article] [PubMed] [Google Scholar]
- 8. Haralampus-Grynaviski NM, Lamb LE, Clancy CMR, et al. Spectroscopic and morphological studies of human retinal lipofuscin granules. Proc Natl Acad Sci U S A. 2003;100:3179–3184 [DOI] [PMC free article] [PubMed] [Google Scholar]
- 9. Morgan JI, Dubra A, Wolfe R, Merigan WH, Williams DR. In vivo autofluorescence imaging of the human and macaque retinal pigment epithelial cell mosaic. Invest Ophthalmol Vis Sci. 2009;50:1350–1359 [DOI] [PMC free article] [PubMed] [Google Scholar]
- 10. Morgan JI, Hunter JJ, Masella B, et al. Light-induced retinal changes observed with high-resolution autofluorescence imaging of the retinal pigment epithelium. Invest Ophthalmol Vis Sci. 2008;49:3715–3729 [DOI] [PMC free article] [PubMed] [Google Scholar]
- 11. Hunter JJ, Morgan JI, Merigan WH, Sliney DH, Sparrow JR, Williams DR. The susceptibility of the retina to photochemical damage from visible light. Prog Retin Eye Res. 2012;31:28–42 [DOI] [PMC free article] [PubMed] [Google Scholar]
- 12. Sparrow JR, Parish CA, Hashimoto M, Nakanishi K. A2E, a lipofuscin fluorophore, in human retinal pigmented epithelial cells in culture. Invest Ophthalmol Vis Sci. 1999;40:2988–2995 [PubMed] [Google Scholar]
- 13. Sparrow JR, Vollmer-Snarr HR, Zhou J, et al. A2E-epoxides damage DNA in retinal pigment epithelial cells. Vitamin E and other antioxidants inhibit A2E-epoxide formation. J Biol Chem. 2003;278:18207–18213 [DOI] [PubMed] [Google Scholar]
- 14. Dinkova-Kostova AT, Massiah MA, Bozak RE, Hicks RJ, Talalay P. Potency of Michael reaction acceptors as inducers of enzymes that protect against carcinogenesis depends on their reactivity with sulfhydryl groups. Proc Natl Acad Sci U S A. 2001;98:3404–3409 [DOI] [PMC free article] [PubMed] [Google Scholar]
- 15. Yoon KD, Yamamoto K, Zhou J, Sparrow JR. Photo-products of retinal pigment epithelial bisretinoids react with cellular thiols. Mol Vis. 2011;17:1839–1849 [PMC free article] [PubMed] [Google Scholar]
- 16. Jang YP, Matsuda H, Itagaki Y, Nakanishi K, Sparrow JR. Characterization of peroxy-A2E and furan-A2E photooxidation products and detection in human and mouse retinal pigment epithelial cells lipofuscin. J Biol Chem. 2005;280:39732–39739 [DOI] [PubMed] [Google Scholar]
- 17. Dillon J, Wang Z, Avalle LB, Gaillard ER. The photochemical oxidation of A2E results in the formation of a 5,8,5′,8′-bis-furanoid oxide. Exp Eye Res. 2004;79:537–542 [DOI] [PubMed] [Google Scholar]
- 18. Wu Y, Yanase E, Feng X, Siegel MM, Sparrow JR. Structural characterization of bisretinoid A2E photocleavage products and implications for age-related macular degeneration. Proc Natl Acad Sci U S A. 2010;107:7275–7280 [DOI] [PMC free article] [PubMed] [Google Scholar]


