

Abstract
Background
The incidence of coronary heart disease (CHD) is higher in Northern than that in Southern China, however differences in traditional CHD risk factors do not fully explain this. No study has examined the differences in subclinical atherosclerosis that may help explain the differences in incidence. This study examined these differences in subclinical atherosclerosis using coronary computed tomography (CT) for calcification between the Northern and Southern China.
Methods
We selected a random sample of participants in a large multi-center ongoing epidemiologic study for coronary calcium scanning in one northern city (North) (Beijing, n = 49) and in two southern cities (South) (Shanghai, n = 50, and Guangzhou, n = 50). Participants from the three field centers (mean age 67 years) underwent coronary risk factor evaluation and cardiac CT scanning for coronary calcium measurement using the Multi-Ethnic Study of Atherosclerosis scanning protocol.
Results
Adjusted log-transformed coronary artery calcium score in North China (Beijing) was 3.1 ± 0.4 and in South China (Shanghai and Guangzhou) was 2.2 ± 0.3 (P = 0.04). Mean calcium score for the northern city of Beijing was three times higher than that of the southern city of Guangzhou (P = 0.01) and 2.5 times higher than for the southern city of Shanghai (P = 0.03).
Conclusions
The extent of subclinical atherosclerosis is significantly higher in the northern city of Beijing than that in the two southern cities of Guangzhou and Shanghai, even after adjusting for standard cardiac risk factors. This finding suggests that standard risk factors do not fully explain north south differences in clinical CHD incidence.
Keywords: coronary calcium, CT scanning, atherosclerosis, epidemiology, China
1. Introduction
Multiple epidemiological studies have shown a large difference in the prevalence and incidence of coronary heart disease (CHD) between northern and southern China,[1]–[3] similar to that found between various parts of Europe.[4] Northern China has consistently been shown to have higher prevalence and incidence of cardiovascular disease when compared to southern China. Since this large geographical difference in the prevalence of CHD has not been explained using traditional CHD risk factors, its unknown causes are of potential interest for all of humanity. Unknown environmental or genetic factors may explain these differences but significant ascertainment bias may also be an explanation. Since coronary artery calcium is a well-documented measure of subclinical atherosclerosis that has been shown to directly predict the risk of future CHD events,[5] including in Chinese Americans,[6] it is of interest to determine if coronary calcium prevalence in northern China is higher than in southern China. We therefore applied cardiac computed tomography (CT) to determine if north-south differences in coronary artery calcium reflects the differences seen in CHD prevalence.
2. Methods
This research utilized three samples from the China multi-center collaborative study of cardiovascular epidemiology (MUCA).[1] The selection method for the MUCA study has been previously described.[1],[2] The MUCA study was expanded to fourteen cohorts in 1991. Its purpose was to examine the incidence of cardiovascular disease in different geographic regions of China and among different ecological environments (rural/urban). The Beijing MUCA cohort consisted of urban residents of Beijing. The Guangzhou MUCA cohort consisted of urban shipyard workers. The Shanghai MUCA cohort consisted of urban residents of that city. We randomly chose 50 participants from these three MUCA cohorts who were among the cluster samples (1000 in each cluster sample) who had complete risk factor data. The random sample was chosen so as to have 50% women with all subjects older than 60 years. A study physician contacted the participants by phone or by visiting their homes to explain the study. Persons with prior history of myocardial infarction, stroke, angina leading to hospitalization or treatment with anti-anginal medications were excluded. The participants gave written informed consent to travel to one of three locations to obtain a non-contrast CT scan of their hearts. The study was approved by the human subjects committees of the University of California, Irvine and Fu Wai Research Institute and Hospital.
Between August 2004 and January 2005, the MUCA investigators collected risk factor data from the participants in the three cities. Risk factor data included history of diabetes and smoking, measures of height and weight, blood pressure, fasting serum total and high density lipoprotein cholesterol. There were sixteen participants older than 75 years of age, all of whom were in the Guangzhou cohort, who did not have risk factor data collected at that earlier time. We collected their risk factor data in January 2007 on the date they underwent CT scanning. Details of these measurements are contained in reference 1.
Between November 2006 and January 2007, we used General Electric 64 slice CT scanners in all three locations to examine the 150 participants. We scanned participants over a hydroxyapatite phantom[7] in order to allow calibration of image attenuation. The technologist instructed the subject on the importance of breath holding and immobility during scanning. As soon as scanning was complete, the technologist will view the first and last reconstructed image on his/her monitor. The technologist set gantry rotation time at 0.5 s, ECG trigger at 50%, kVp at 120 and mA at between 200 and 250 depending on participant size. Scans were reconstructed with a field of view of 35 centimeters and a slice thickness of 2.5 mm. A radiologist read all scans using the MESA/CARDIA protocol.[8] The calcium measure reported here is the Agatston calcium score.[9]
As has been done in MESA[6] and other studies,[10]–[12] we log transformed coronary calcium scores and added one in order to allow processing of a non-normally distributed variable with many zero scores. Log transformed coronary calcium score, LN score = LN (calcium score +1). We used Chi-square tests for discrete variables and one-way analysis of covariance and variance tests for continuous variables to test for differences in demographic and risk factors between the three cities and between the northern city of Beijing and the two southern cities of Shanghai and Guangzhou and between participants with and without coronary calcification. For analyses of variance or covariance that were statistically significant (P < 0.05), multiple comparison t-tests were performed with a Bonferoni adjustment to test for significance between specific cities. SAS v9.1 (SAS Inst, Cary NC) was used for all analyses.
3. Results
One hundred and forty nine participants had evaluable CT scans (49 from Beijing, 50 from Shanghai, 50 from Guangzhou). Seventy five (25 from each city) were women. Mean age was 67.0 ± 4.1 years.
Table 1 contains the results for demographics and risk factors in the three cities. Beijing residents had higher body mass index, and lower total cholesterols than in the other cities. There were more present and former smokers in Beijing.
Table 1. Demographics and risk factor means or prevalence by city.
| Beijingn = 49, mean ± SE | Guangzhoun = 50, mean ± SE | Shanghain = 50, mean ± SE | P-value* | |
| Gender (Female) | 51% | 50% | 50% | 0.99 |
| Age (years) | 67.3 ± 4.2 | 66.8 ± 3.8 | 66.8 ± 4.4 | 0.83 |
| BMI (kg/m2) | 25.2 ± 4.1 | 23.4 ± 3.0 | 24.1 ± 3.9 | 0.05 |
| WC (cm) | 87.5 ± 11.6 | 81.8 ± 8.6 | 83.0 ± 11.2 | 0.02 |
| SBP (mmHg) | 138.9 ± 21.4 | 138.6 ± 18.6 | 140.2 ± 19.3 | 0.91 |
| DBP (mmHg) | 78.0 ± 11.1 | 80.9 ± 10.0 | 88.1 ± 10.9 | <0.01 |
| GLU (mg/dL) | 113.9 ± 54.8 | 111.0 ± 46.8 | 91.7 ± 22.3 | 0.02 |
| TG (mg/dL) | 157.6 ± 113.0 | 154.0 ± 92.8 | 138.7 ± 81.1 | 0.59 |
| TC (mg/dL) | 193.4 ± 31.0 | 211.9 ± 36.4 | 203.6 ± 35.6 | 0.03 |
| HDL-C (mg/dL) | 46.0 ± 9.6 | 49.2 ± 15.0 | 50.4 ± 12.1 | 0.20 |
| Smoking status | 0.008 | |||
| Never | 50% | 64% | 84% | |
| Former | 18.4% | 14% | 4% | |
| Current | 32.7% | 22% | 12% | |
| Hypertension | 59.2% | 62% | 66% | 0.78 |
| Diabetes | 26.5% | 16% | 12% | 0.15 |
*Compare across groups. BMI: Body mass index; WC: Waist circumference; SBP: Systolic blood pressure; DBP: Diastolic blood pressure; GLU: Glucose; TG: Triglycerides; TC: Total cholesterol; HDL-C: High density lipoprotein cholesterol.
Table 2 shows results for coronary artery calcium score and log (calcium score +1) when adjusted for age, gender and risk factors. The calcium score for the 149 patients was 102.2 ± 22.2 (mean ± SE) and for Beijing participants was about three times higher than that of Guangzhou (185.5 ± 60.4 vs. 52.1 ± 16.9, P = 0.01). Mean calcium score for Beijing participants was about 2.5 time higher than for Shanghai participants (185.5 ± 60.4 vs. 70.8 ± 21.3, P = 0.03). Mean calcium scores were significantly different across the 3 cities (P = 0.03). Calcium scores ranged from 0 to 2572.9, with a median value of 5.8, 25th percentile value of 0, and 75th percentile value of 77.3. Beijing participants had higher median calcium score than the Guangzhou participants (median [interquartile range]: 21.0 [208.4] vs. 2.1 [51.8]; P < 0.01), Shanghai participants (median [interquartile range]: 21.0 [208.4] vs. 1.5 [58.4]; P < 0.01). Since calcium scores lower than ten can be reflective of false positives from measurement error,[13],[14] we stratified participants into two groups (0–10 and ≥ 11). When stratifying the calcium scores into two groups (0–10, ≥ 11), there was a significant difference between the northern city of Beijing and the two southern cities in the prevalence of scores of > 11 (P = 0.02). From multivariable analysis, log transformed coronary calcium scores remained about fifty percent higher in Beijing than in either of the two southern cities after covariate adjustment (Beijing: 3.08 ± 0.37, Guangzhou: 2.03 ± 0.39, Shanghai: 2.32 ± 0.44) (P = 0.03 and P = 0.04, respectively).
Table 2. Coronary calcium measures by city and region (North vs. South).
| Beijing (north) n = 49 | Guangzhou n = 50 | Shanghai n = 50 | Guangzhou + Shanghai (south) n = 100 | Total n = 149 | |
| Total Score | |||||
| Mean (SE) | 185.5 (60.4) | 52.1 (16.9) | 70.8 (21.3 ) | 61.5 (13.6) | 102.2 (22.2) |
| Median | 21.0 | 2.1 | 1.5 | 1.5 | 5.8 |
| 25th percentile | 0.0 | 0.0 | 0.0 | 0.0 | 0.0 |
| 75th percentile | 208.4 | 51.8 | 58.4 | 51.8 | 77.3 |
| Inter-quartile range | 208.4 | 51.8 | 58.4 | 51.8 | 77.3 |
| Range | 0.0–2572.9 | 0.0–560.0 | 0.0–736.6 | 0.0–736.6 | 0.0–2572.9 |
| Stratification by score n (%) | |||||
| 0–10 | 20 (40.8) | 31 (62.0) | 30 (60.0) | 61(61.0) | 81(54.5) |
| ≥ 11 | 29 (59.2) | 19 (38.0) | 20 (40) | 39 (39.0) | 68 (45.6) |
| LN score (SE) | 3.08 (0.37) | 2.03 (0.39)* | 2.32 (0.44) | 2.15 (0.34)* |
*P (LN score, vs. Beijing): Beijing-Guangzhou = 0.03, Beijing-Guangzhou+Shanghai = 0.04. Adjusted for age, gender, smoking status, body mass index, diabetes, total cholesterol and systolic blood pressure.
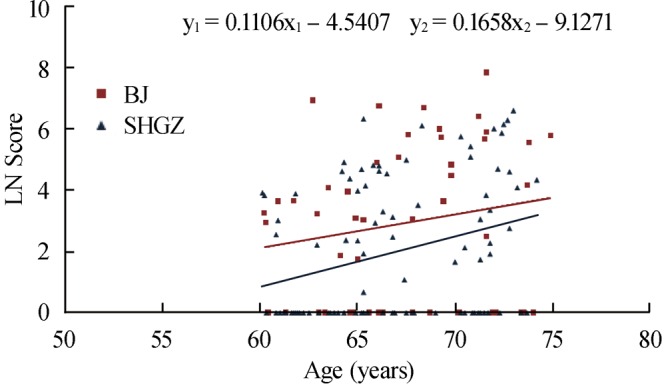
Figure 1 shows calcium scores plotted on a logarithmic vertical axis against age on the horizontal axis in the 149 participants. The scores for the northern Beijing participants are higher than those for the southern Guangzhou and Shanghai participants (P = 0.02).
Figure 1. Scores of coronary-artery calcification in 149 participants with and without coronary calcification, between the Northern city of Beijing and the two Southern cities of Shanghai and Guangzhou, according to Age. Coronary-artery calcification was assessed by electron-beam computed tomography. The scale on the y axis is natural logarithmic. BJ: Beijing; SHGZ: Shanghai + Guangzhou.
4. Discussion
Our results indicate that subclinical atherosclerosis is significantly higher in the northern city of Beijing than that in the two southern cities of Guangzhou and Shanghai. This difference is not accounted for by age, gender or standard coronary risk factors. To our knowledge, this is the first application of coronary computed tomographic imaging to study coronary calcium prevalence and extent in mainland China.
The prevalence and annual incidence of coronary heart disease has repeatedly been proven to demonstrate a North-South gradient with northern regions showing much higher prevalence and incidence than southern regions. For example, as shown in Table 3, the World Health Organization (WHO) China Multinational Monitoring of trends and determinants in cardiovascular disease (MONICA) study,[3] the China Multi-Center Collaborative Study of Cardiovascular Epidemiology (MUCA) and the PRC-USA[1] studies demonstrate this north-south difference in heart disease incidence.
Table 3. Coronary heart disease death incidence in northern and southern Provinces/Cities/Regions from China MONICA[3] and MUCA[1] Study (per 100000 population).
| Northern Provinces/Cities/Regions |
Southern Provincets/Cities/Regions |
|||||
| China MONICA[3] | MUCA PRC-USA[1] | China MONICA[3] | MUCA PRC-USA[1] | |||
| Beijing | 135 | 97 | Shanghai | 31 | 26 | |
| Xinjiang | 163 | Guangdong | 101 | 30 | ||
| Inner Mongolia | 119 | Henan | 70 | |||
| Heilongjiang | 133 | 108 | Jiangsu | 14 | 1 | |
| Jilin | 73 | Anhui | 12 | |||
| Liaoning | 84 | Jiangxi | 51 | |||
| Shandong | 203 | Fujian | 87 | |||
| Hebei | 97 | Sichuan | 32 | 10 | ||
| Shanxi | 57 | Shaanxi | 45 | |||
| Hebei | 81 | Guangxi | 33 | |||
| Zhejiang | 4 | |||||
| Mean | 126 | 86 | 50 | 13 | ||
Risk factor patterns, especially hypertension, lipids and obesity, are rapidly changing in China resulting in rising incidence of coronary heart disease. Traditional epidemiologic methods require many years to obtain disease incidence data. New methods are needed to rapidly assess populations. Western researchers have shown that coronary calcification, which can be rapidly and relatively inexpensively, assessed using computed tomography, is strongly related to coronary heart disease incidence.[11],[15] The Multi-ethnic study of atherosclerosis investigators found that this methodology is predictive of future CHD events in Chinese-Americans.[6] The use of coronary calcium as a surrogate endpoint for CHD prevalence, an alternative to the determination of CHD incidence using follow-up for events has potential to efficiently evaluate relationships between new risk factors and coronary heart disease. The rapidly changing epidemiology of heart disease in China[16] lends itself well to the use of this methodology for studying differences in atherosclerosis in its diverse populations.
Another advantage of the assessment of sub-clinical atherosclerosis as opposed to the traditional longitudinal approach in evaluating population risk is the freedom from ascertainment bias. Longitudinal studies that utilize event ascertainment are difficult in situations where many events are not scrutinized by comparable medical establishments. This is true in different geographic areas of China. For example in Western rural areas, many if not most myocardial infarctions occur at home and are not observed by the medical establishment while in eastern urban areas, hospitalization, electrocardiography and ascertainment of cardiac enzymes are more usual.
As this was a pilot study, an important limitation is the limited sample size of only 50 participants in each group. Moreover, we have examined only one measure of sub-clinical atherosclerosis; it is possible findings may differ had other measures (e.g., carotid intimal medial thickness) been utilized or had other cities in Northern and Southern China been included. Also, we did not have measures of socioeconomic status or other possible confounders (e.g., dietary and other lifestyle factors) that might distinguish the three different sub-cohorts possibly explaining the differences in subclinical atherosclerosis. Additionally, a potential limitation of this study is the time interval between the recording of risk factor and coronary calcification data. Since a major purpose of this study was to determine the feasibility of coronary calcium assessment in epidemiology studies, the timing of data collection of risk factors is of lesser importance. In fact, at least in younger adults, risk factors measured up to 15 years prior to scanning were shown to predict the presence of calcium as well as concurrently measured risk factors, despite changes in risk factor levels over time.[17]
We conclude that the use of coronary calcium scanning as a surrogate for CHD prevalence can be validly applied in epidemiologic studies of Chinese populations and that the prevalence of coronary calcium reflects the findings of large north-south differences in CHD that are not fully explained by standard risk factors. Further investigation into reasons why atherosclerosis may be more common in Northern vs. Southern areas of China is needed.
Acknowledgments
This study was supported by grants from the University of California, Irvine and the China California Heart Watch. We appreciate the technical assistance of Chris Dailing, Nan Zhuang and Shan Shan Chen and the time and effort of our research participants toward making this study possible.
References
- 1.Zhou B, Zhang H, Wu Y, et al. Ecological analysis of the association between incidence and risk factors of coronary heart disease and stroke in Chinese Populations. CVD Prevention. 1998;1:207–216. [Google Scholar]
- 2.People's Republic of China-United States Cardiovascular and Cardiopulmonary Epidemiology Research Group An epidemiological study of cardiovascular and cardiopulmonary disease risk factors in four populations in the People's Republic of China. Baseline Report From the P.R.C.-U.S.A. Collaborative Study. Circulation. 1992;85:1083–1096. doi: 10.1161/01.cir.85.3.1083. [DOI] [PubMed] [Google Scholar]
- 3.Zhao D. The epidemiology of coronary heart disease in 16 provinces of China (MONICA Project) Zhong Hua Liu Xing Bing Xue Za Zhi. 1993;14:10–13. [PubMed] [Google Scholar]
- 4.Keys A. Harvard University Press; Cambridge, USA: 1980. Seven countries: a multivariate analysis of death and coronary heart disease; pp. 1–381. [Google Scholar]
- 5.Greenland P, Bonow RO, Brundage BH, et al. ACCF/AHA 2007 clinical expert consensus document on coronary artery calcium scoring by computed tomography in global cardiovascular risk assessment and in evaluation of patients with chest pain: a report of the American College of Cardiology Foundation Clinical Expert Consensus Task Force (ACCF/AHA Writing Committee to Update the 2000 Expert Consensus Document on Electron Beam Computed Tomography) developed in collaboration with the Society of Atherosclerosis Imaging and Prevention and the Society of Cardiovascular Computed Tomography. J Am Coll Cardiol. 2007;49:378–402. doi: 10.1016/j.jacc.2006.10.001. [DOI] [PubMed] [Google Scholar]
- 6.Detrano R, Guerci AD, Carr JJ, et al. Coronary calcium as a predictor of near-term coronary heart disease events in major American ethnic groups: The Multi-Ethnic Study of Atherosclerosis (MESA) N Engl J Med. 2008;358:1336–1345. doi: 10.1056/NEJMoa072100. [DOI] [PubMed] [Google Scholar]
- 7.Nelson JC, Kronmal RA, Carr JJ, et al. Measuring coronary calcium on CT images adjusted for attenuation differences. Radiology. 2005;235:403–414. doi: 10.1148/radiol.2352040515. [DOI] [PubMed] [Google Scholar]
- 8.Carr JJ, Nelson JC, Wong ND, et al. Calcified coronary artery plaque measurement with cardiac CT in population-based studies: standardized protocol of Multi-Ethnic Study of Atherosclerosis (MESA) and Coronary Artery Risk Development in Young Adults (CARDIA) study. Radiology. 2005;234:35–43. doi: 10.1148/radiol.2341040439. [DOI] [PubMed] [Google Scholar]
- 9.Agatston AS, Janowitz WR, Hildner FJ, et al. Quantification of coronary artery calcium using ultrafast computed tomography. J Am Coll Cardiol. 1990;15:827–832. doi: 10.1016/0735-1097(90)90282-t. [DOI] [PubMed] [Google Scholar]
- 10.Greenland P, LaBree L, Azen SP, et al. Coronary artery calcium score combined with Framingham score for risk prediction in asymptomatic individuals. JAMA. 2004;291:210–215. doi: 10.1001/jama.291.2.210. [DOI] [PubMed] [Google Scholar]
- 11.Arad Y, Goodman K, Roth M, et al. Coronary calcification, coronary disease risk factors, C-reactive protein, and atherosclerotic cardiovascular disease events: the St. Francis Heart Study. J Am Coll Cardiol. 2005;46:158–165. doi: 10.1016/j.jacc.2005.02.088. [DOI] [PubMed] [Google Scholar]
- 12.O'Malley PG, Taylor AJ, Jackson JL, et al. Prognostic value of coronary electron-beam computed tomography for coronary heart disease events in asymptomatic populations. Am J Cardiol. 2000;85:945–948. doi: 10.1016/s0002-9149(99)00906-6. [DOI] [PubMed] [Google Scholar]
- 13.Carr JJ, Crouse JR, 3rd, Goff DC, Jr, et al. Evaluation of Subsecond Gated Helical CT for Quantification of Coronary Artery Calcium and Comparison with Electron Beam CT. Am J Roentgenol. 2000;174:915–921. doi: 10.2214/ajr.174.4.1740915. [DOI] [PubMed] [Google Scholar]
- 14.Wexler L, Brundage B, Crouse J, et al. Coronary artery calcification: pathophysiology, epidemiology, imaging methods, and clinical implications. A statement for health professionals from the American Heart Association. Circulation. 1996;94:1175–1192. doi: 10.1161/01.cir.94.5.1175. [DOI] [PubMed] [Google Scholar]
- 15.Fernandez-Friera L, Garcia-Alvarez A, Bagheriannejad-Esfahani F, et al. Diagnostic value of coronary artery calcium scoring in low-intermediate risk patients evaluated in the emergency department for acute coronary syndrome. Am J Cardiol. 2011;107:17–23. doi: 10.1016/j.amjcard.2010.08.037. [DOI] [PubMed] [Google Scholar]
- 16.Blumenthal D, Hsiao W. Privatization and its discontents–The evolving Chinese health care system. N Engl J Med. 2005;353:1165–1170. doi: 10.1056/NEJMhpr051133. [DOI] [PubMed] [Google Scholar]
- 17.Loria CM, Liu K, Lewis CE, et al. Early adult risk factor levels and subsequent coronary artery calcification: the CARDIA Study. J Am Coll Cardiol. 2007;49:2013–2020. doi: 10.1016/j.jacc.2007.03.009. [DOI] [PubMed] [Google Scholar]