Abstract
Allergy to fungi has been linked to a wide range of illnesses, including rhinitis and asthma. Therefore, exposure to fungi in home environment is an important factor for fungal allergy. The present study was aimed to investigate types of airborne fungi inside and outside the homes of asthmatic children and control subjects (nonasthmatic children). The dominant fungi were evaluated for their quantitative distribution and seasonal variation. The air samples were collected from indoors and immediate outdoors of 77 selected homes of children suffering from bronchial asthma/allergic rhinitis using Andersen volumetric air sampler. The isolated fungal genera/species were identified using reference literature, and statistical analysis of the dominant fungi was performed to study the difference in fungal concentration between indoor and immediate outdoor sites as well as in between different seasons. A total of 4423 air samples were collected from two indoor and immediate outdoor sites in a 1-year survey of 77 homes. This resulted in the isolation of an average of 110,091 and 107,070 fungal colonies per metric cube of air from indoor and outdoor sites, respectively. A total of 68 different molds were identified. Different species of Aspergillus, Alternaria, Cladosporium, and Penicillium were found to be the most prevalent fungi in Delhi homes, which constituted 88.6% of the total colonies indoors. Highest concentration was registered in autumn and winter months. Total as well as dominant fungi displayed statistically significant differences among the four seasons (p < 0.001). The largest number of isolations were the species of Aspergillus (>40% to total colony-forming units in indoors as well as outdoors) followed by Cladosporium spp. Annual concentration of Aspergillus spp. was significantly higher (p < 0.05) inside the homes when compared with outdoors. Most of the fungi also occurred at a significantly higher (p < 0.001) rate inside the homes when compared with immediate outdoors. Asthmatic children in Delhi are exposed to a substantial concentration of mold inside their homes as well as immediate outdoor air. The considerable seasonal distributions of fungi provide valuable data for investigation of the role of fungal exposure as a risk for respiratory disorders among patients suffering from allergy or asthma in Delhi.
Keywords: Asthma, Delhi, indoor fungi, prevalence, respiratory allergy, seasonal variation
A global rise in the prevalence of asthma and other allergic ailments is being observed all over the world. Approximately 300 million people worldwide currently have asthma, with estimates suggesting that figure increases globally by 50% every decade.1 Prevalence is high (>10%) in developed countries and rates are increasing in developing regions as they become more westernized. The most striking increases are seen among children, with prevalence rates of >30% in some areas.1 In India, the magnitude of childhood asthma varies from 5 to 20%.2,3 Environmental factors such as indoor and outdoor air pollution, tobacco smoke, and early exposure to inhalant allergens play significant roles in the development of respiratory disorders.4 Recently, there has been increased attention toward the influence of the prevalence of fungi present indoors on the risk factors associated with asthma. Allergic sensitization to fungi has also been suspected to result in symptoms of allergy and asthma, including fatal asthma episodes.5,6 The knowledge of season and concentration of various fungi is one of the essential factors for effective diagnosis and management of allergic diseases7 as the associations between seasonal variations in fungal levels and exacerbating asthma have been reported earlier.8 Few studies on exposure to fungi in home environment have been reported.6,9,10 In India little is known about the distribution of fungi inside the homes where people spend 12–16 hours daily, although quantitative prevalence of fungi in occupational sites have been studied.11–13 The present study was aimed to examine the spectrum and concentration of airborne fungal flora inside and in the immediate vicinity of the homes of asthmatic children in the Delhi metropolis and to investigate the seasonal distributions of dominant fungi using standardized volumetric methods.
METHODS
Subjects
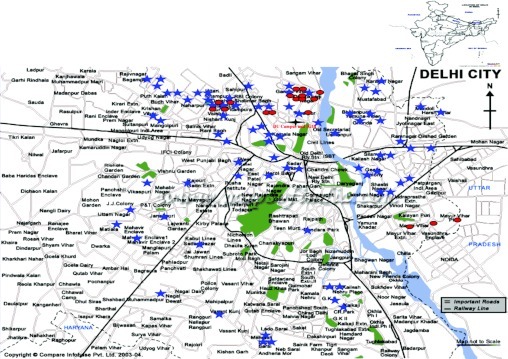
One hundred patients diagnosed with bronchial asthma (BA)/allergic rhinitis (AR) visiting the Clinical Research Center of V.P. Chest Institute, Delhi, were recruited for this study. The age group was restricted from 3 to 16 years. Parental informed consent was obtained for voluntary participation as per the guidelines of the Institutional Ethical Committee. All of the homes were located in Delhi city and its metropolitan area. The compliance rate was not 100% because of either shifting of the houses/other reasons. Therefore, a total of 77 patients' homes were investigated for indoor fungal concentration. Most patients belonged to the north zone (53/77) of Delhi because the health center was situated in this zone itself. Sixteen (16/77) homes were located in east Delhi. Five of 77 and 2 of 77 homes were situated in the west and south zones of Delhi, respectively, and only 1 home was located in central Delhi. Besides patients, 18 controls (nonasthmatic/healthy volunteers) were also included for fungal survey (Fig. 1). The control homes were randomly selected from the general population in the age group of 5–16 years.
Figure 1.
Map of Delhi showing locations of the homes selected for aerobiological sampling. Black cross, Delhi University Campus and Institute of Genomics and Integrative Biology (IGIB); blue star, homes of the patients in Delhi selected for sampling; pink circle, homes of nonasthmatic/healthy volunteers.
A standard questionnaire validated previously by Singh et al.14 was used to record medical history and housing conditions. The questionnaires were administered to those clinically diagnosed as having BA, AR, or both BA with AR as per the guidelines of the American Thoracic Society and Allergic Rhinitis and Its Impact on Asthma guidelines.15,16 Clinical history regarding respiratory dysfunction (breathlessness, cough, wheezing, etc.), family history, personal history, time and duration of the symptom, and duration of stay in the house were carefully recorded under the supervision of clinicians.
Collection of Air Samples
The aim of the study was to investigate qualitative and quantitative prevalence of fungi in the homes of asthma patients and compare them with that in healthy controls. Because the sample collection was not initiated at the same time of year in all of the homes, samplings were continued for 2 years to cover all of the patients.
Air samples were collected from the home of each patient for 1 year at 15-day intervals using a six-stage volumetric air sampler (Anderson Sampler Inc., Atlanta, GA).17 The sampler contained Petri plates filled with Sabourauds Agar Media (with Rose Bengal Dye) and was placed at human height during the collection. In each home one sample was collected from the patient's bedroom, one from the living room/other room, and one from the immediate outdoor environment (balcony, terrace, etc.). The sampling period was 5 minutes between 10:00 A.M. and 12:00 P.M. After sampling, the exposed Petri plates were incubated at 28 ± 2°C for ≥3–4 days until the colonies were visible to examine.
Isolation and Identification
The exposed Petri plates were observed after 3–4 days and the isolated colonies were identified and counted. The various fungal colonies were identified through visual, low and high power microscopy (Ziess Axioskop, Göttingen, Germany), and culture techniques to the lowest taxonomic rank possible. The color of the colonies, shape and size of the spores, and the pattern of the sporulation provided clues for identification. The identification was facilitated by using standard books and monographs18–20 and standard reference preparations. The number of colonies per plate of each fungal genus/species was counted. Skin-prick test and fungal-specific IgE antibodies were performed with dominant indoor fungi in patients to establish clinical relevance to fungal concentration indoors and outdoors (to be published separately).
Data Analysis
The results were expressed as number of colony-forming units (CFU) per cubic meter by using the formula,
 |
Although all of the CFUs were isolated and identified to the nearest taxonomic rank possible, only dominant and frequently occurring types were analyzed for their seasonal and annual variations. Colony counts converted to monthly rates by multiplying number of CFUs by a factor of 15 as sampling was performed at the 15-days interval, thus obtaining the fungal load of each month.
Statistical Analysis
The aerobiological results were subjected to statistical analysis using Prism II software (Graph Pad Prism, San Diego, CA). The value of p < 0.05 was considered significant. The total colony concentration of predominant fungal genera/species of each home was calculated. The average concentration of the two indoor sites of each home was taken while comparing the fungal concentration inside the homes and immediately outside the homes. Average fungal concentration of all the patients' homes was taken to determine total fungal concentration in 1 year. Percent contribution of each mold was also computed by taking the average of all 77 patients. Seasonal distribution of dominant fungi was also investigated. Paired t-test (Wilcoxon matched-pairs test) was used to compare any significant difference between indoor and outdoor mold concentration in different months and seasons. The relative concentration of total as well as dominant fungi in different seasons was analyzed by ANOVA. If the data were not found normally distributed, nonparametric test (Kruskal-Wallis test) was applied to calculate the significance of concentration between the seasons.
RESULTS
A total of 3146 air samples were collected from the bedroom (1573) and outdoor environment (1573) of homes, and 1277 samples were collected from living/other rooms (in cases where the occupant was living in a single room, only one indoor sample was collected and was considered as bedroom).
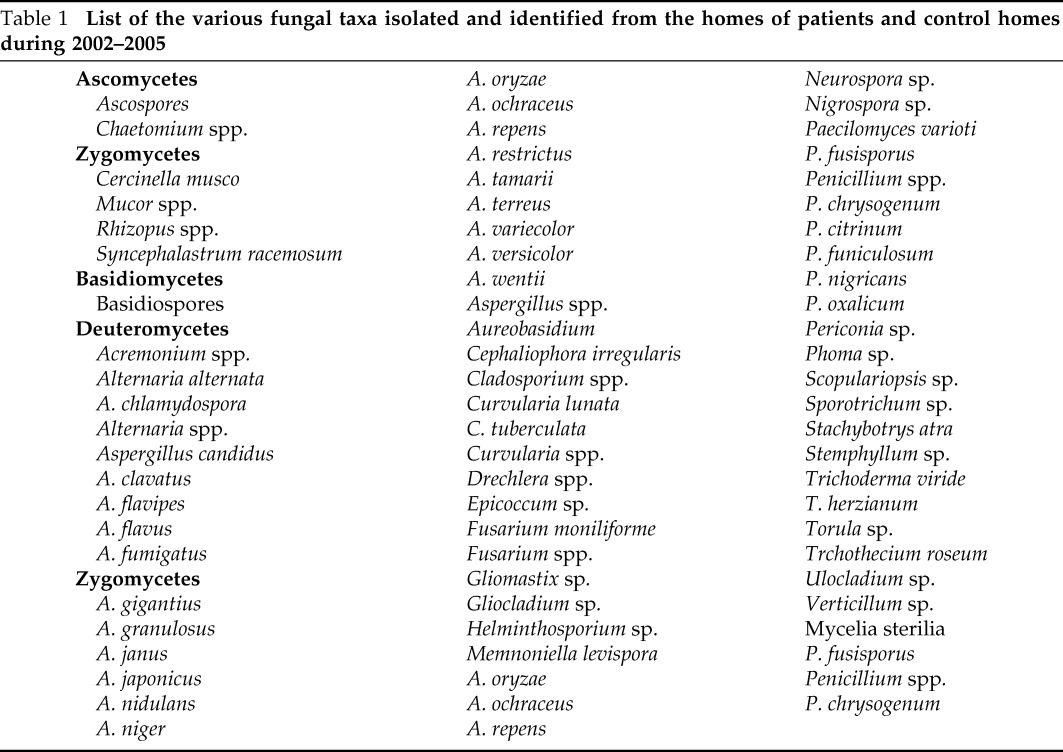
Altogether, 68 different fungi including sterile mycelia were identified from all the homes. The various fungi observed are listed in Table 1. Overall, 35 genera were isolated. Twenty species of Aspergillus and five species of Penicillium were identified (the species that could not be identified were grouped into Aspergillus spp or Penicillium spp). For the present study, the 10 dominant fungal genera and 5 species of Aspergillus that were most relevant to allergy were evaluated.
Table 1.
List of the various fungal taxa isolated and identified from the homes of patients and control homes during 2002–2005
Fungal Concentrations
Overall Concentration.
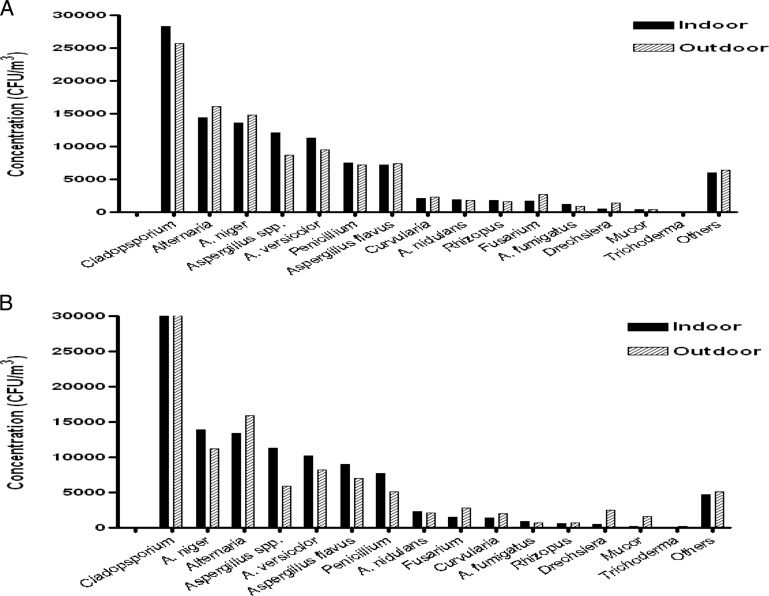
One-year average concentration inside and outside the homes of patients for dominant fungi is presented graphically in Fig. 2 A. Concentration of fungi other than dominant genera is represented as “others.”
Figure 2.
(A) Indoor and immediate outdoor annual concentration of dominant fungal colonies (in CFU/m3) in patients' homes (n = 77). (B) Indoor and immediate outdoor annual concentration of dominant fungal colonies (in CFU/m3) in control homes (nonasthmatic/healthy volunteers; n = 18).
In patients' homes, the average annual concentration of total fungi was 110,091 and 107,070 CFU/m3 in indoor and outdoor environments, respectively. The concentration range of culturable fungi was 2107–7608 CFU/m3 inside the home and 1994–6535 CFU/m3 immediately outside the home in a year. Highest average annual concentration inside the homes was recorded for the genus Aspergilllus with 47,254 and 43,138 CFU/m3 immediately outside the homes followed by Cladosporium (indoors, 28,309 CFU/m3; outdoors, 24,749 CFU/m3) and Alternaria (indoors, 14,424 CFU/m3; outdoors, 16,056 CFU/m3). Annual concentrations of Cladosporium, Aspergillus species, Aspergillus versicolor, Aspergillus nidulans, Aspergillus fumigatus, Penicillium, and Rhizopus exceeded in indoor environment when compared with outside air. However, a statistically significant difference was observed only in Aspergillus spp (p < 0.05). On the contrary, an opposite pattern was observed for Fusarium, Alternaria, Drechslera, Aspergillus flavus, and Aspergillus niger and statistical significance was exhibited only by Fusarium and Drechslera (p < 0.05).
In control homes (nonasthmatic/healthy volunteers), a similar spectrum of fungi was observed as in the homes of asthma patients. The annual concentration of total fungi was 107,850 and 103,532 CFU/m3 in indoor and outdoor environments, respectively, and that of dominant fungi is represented graphically in Fig. 2 B.
Indoor concentration of Mucor (p < 0.01), Rhizopus (p < 0.01), and Curvularia (p < 0.01) was significantly higher in the patients' homes when compared with the concentration in the homes of control subjects. In immediate outdoor environment all the species of Aspergillus displayed higher concentration in patients' homes when compared with control homes. In addition to these, Penicillium and Rhizopus also reflected higher concentration, but statistical significance was not observed.
Seasonal Concentration.
Significant differences (p < 0.001) in fungal concentration among different seasons existed. Mean concentration of fungi in indoors was higher in winter (December–February, 33.2%) and autumn (September–November, 27.8%) and lower during the rain (June–August, 16.0%; Fig. 3). The concentration of all dominant fungi except A. fumigatus also displayed statistically significant variation among the four seasons.
Figure 3.
Total fungal concentration (CFU/m3) showing significant seasonal variations (p < 0.001) analyzed in four different seasons of the year recorded from indoor air of patients' homes. Summer (March–May); rain (June–August); autumn (September–November); winter (December–February).
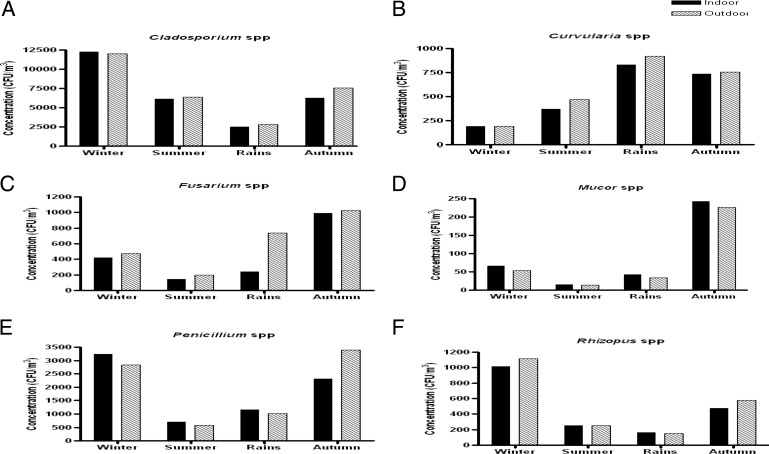
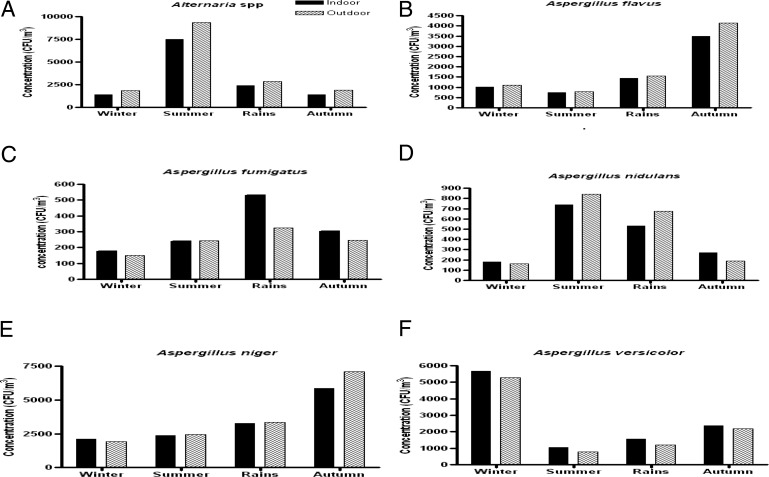
The indoor and outdoor contribution of Alternaria spp. was higher in the summer (7524 and 9331 CFU/m3, respectively) whereas it was significantly lower in the winter (1403 CFU/m3 indoors and 1900 CFU/m3 outdoors). Cladosporium was more predominant in winters (12,264 CFU/m3 indoors and 12,001 CFU/m3 outdoors) but least common in rain (2523 and 2823 CFU/m3 indoors and outdoors, respectively). Penicillium displayed high concentration in autumn and winter (2311–3246 CFU/m3 indoors and 2831–3403 CFU/m3 outdoors) and a low concentration in summer. The four species of Aspergillus genera displayed much variation in their seasonal concentrations. A. flavus and A. niger were predominant during autumn (3488 and 5843 CFU/m3, respectively, indoors). A. fumigatus and A. nidulans displayed high concentration in late summer and early rain (239–530 CFU/m3 and 530–738 CFU/m3, respectively, inside the homes) and were comparatively lower in winters. More than 50% of annual concentration of A. versicolor was isolated in winters. Rhizopus was more commonly isolated in winters and Mucor and Fusarium was more isolated in the autumn season (Figs. 4 and 5).
Figure 4.
Fungal colony concentration (CFU/m3) of dominant fungi showing significant seasonal variations in four different seasons of the year recorded from indoor air of patients' homes. (a) Alternaria spp. (p < 0.001); (b) Aspergillus flavus (p < 0.001); (c) Aspergillus fumigatus (p > 0.05); (d) Aspergillus nidulans (p < 0.001); (e) Aspergillus niger (p < 0.001); (f) Aspergillus versicolor (p < 0.001).
Figure 5.
Fungal colony concentration (CFU/m3) of dominant fungi showing significant seasonal variations in four different seasons of the year recorded from indoor air of patients' homes. (a) Cladosporium spp. (p < 0.001); (b) Curvularia spp. (p < 0.001); (c) Fusarium spp. (p < 0.001); (d) Mucor spp. (p < 0.001); (e) Penicillium spp. (p < 0.001); (f) Rhizopus spp. (p < 0.001).
Percent Occurrence and Percent Contribution
The frequency of occurrence (number of times a particular fungus has been isolated from the total number of samples analyzed expressed in percent) of the dominant types varied from 7.8 (Mucor) to 86.6% (A. niger) throughout the year inside the homes. Most of the fungi occurred at significantly higher frequency rates (p < 0.001) indoors compared with outdoors except Cladosporium, Drechslera, and Mucor (p > 0.05). This is in contrast to the concentration of fungi, which did not show a significant difference between indoor and outdoor concentration. Indoor environment of patients homes displayed a significantly higher percent occurrence of the dominant fungi when compared with control homes (nonallergic/healthy volunteers) except for A. versicolor and Drechslera in which statistical significance was not observed despite the fact that percent occurrence was higher in the patients' indoor environments (Table 2).
Table 2.
Comparison of percent occurrence of dominant fungi between patients and control (nonallergic/healthy volunteers) indoors (I) and immediate outdoors (O)
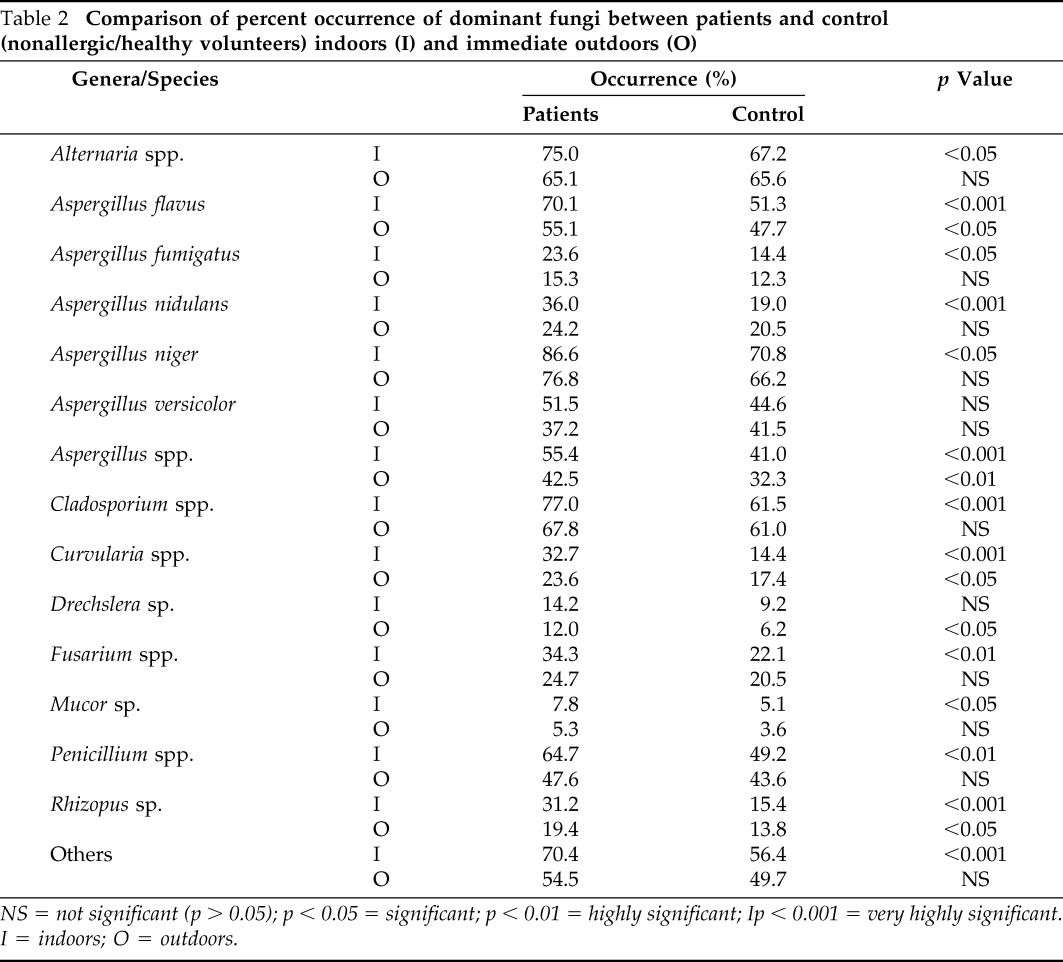
NS = not significant (p > 0.05); p < 0.05 = significant; p < 0.01 = highly significant; Ip < 0.001 = very highly significant.
I = indoors; O = outdoors.
Percent contribution of the dominant fungi is summarized in Table 3. The culturable fungi most commonly encountered were species of Aspergillus, Cladosporium, Alternaria, and Penicillium, which represented as high as 88.6 and 86.3% of total CFU in indoor and outdoor air, respectively. Aspergillus had the maximum fungal concentration percentage and accounted for 43.1% in the indoor environment and 40.4% in the immediate outdoor environment. Cladosporium spp was the next major contributor both inside and outside the homes followed by Alternaria spp. and Peniciilium spp. Among the different species of the genus Aspergillus, A. niger (12.4%) was the most predominant species inside the homes followed by A. versicolor (10.3%), A. flavus (6.6%), A. nidulans (1.7%), and A. fumigatus (1.1%). Other dominant fungal genera contributed no more than 1.9% in the indoor environment and 2.1% in the outdoor environment (Table 3).
Table 3.
Percent contribution of dominant fungi to total colony-forming units in patients and control (nonallergic/healthy volunteers) homes
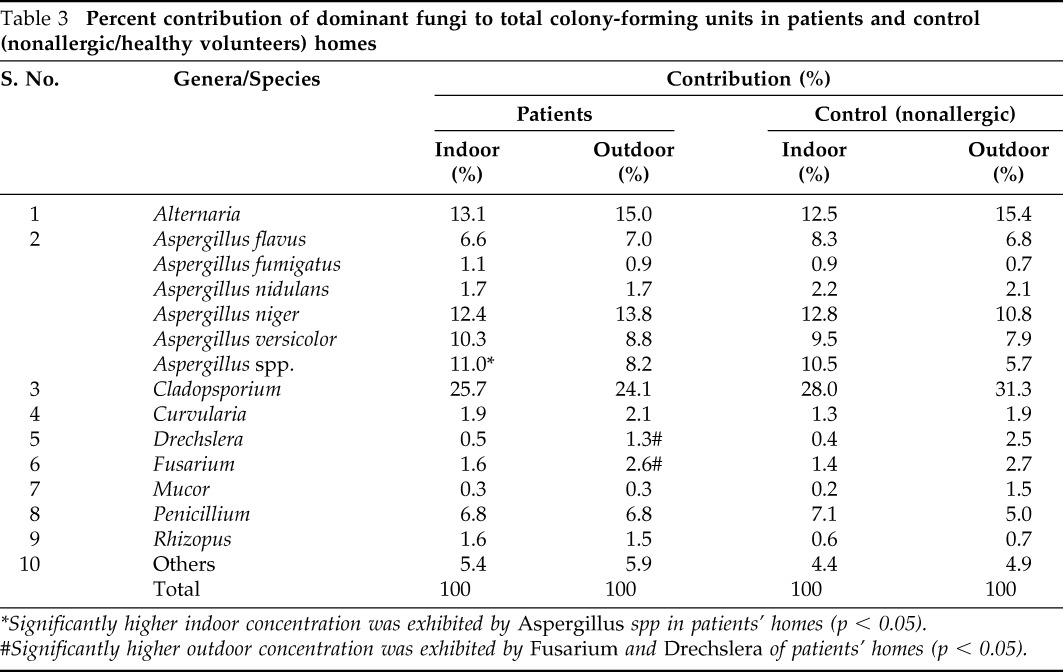
*Significantly higher indoor concentration was exhibited by Aspergillus spp in patients' homes (p < 0.05).
#Significantly higher outdoor concentration was exhibited by Fusarium and Drechslera of patients' homes (p < 0.05).
Concentration of fungi in two different sampling locations selected inside the homes revealed that most of the species of Aspergillus and Penicillium represented a higher concentration in the bedroom when compared with the living room, whereas the reverse pattern was observed for Cladosporium, Curvularia, Drechslera, Fusarium, and Mucor. However, statistical significance was not observed in any of them (p > 0.05) (data not presented).
House-to-House Variation
The dominant fungi reflected extreme variations in the concentration in different homes with a minimum of 41.9 to >100% coefficient of variation (CoV) inside the homes. Indoor-to-outdoor ratio (I/O) of the annual concentration of the total as well as dominant fungi are presented in Table 4. This analysis was important because not all of the homes displayed similar indoor/outdoor distribution of fungi as evident from aforementioned results of CoV between the different homes. Only 5.2% of the homes showed the I/O ratio of total fungi >1.5 but none of them had ≥2.0. However, when the dominant fungi were analyzed, I/O ratio of A. fumigatus, A. nidulans, A. versicolor, and Aspergillus species was >2 in 20.8% (16/77), 18.2% (14/77), 25.9% (20/77), and 19.5% (15/77) of the homes, respectively, and the I/O ratio of Penicillium was in 13% (10/77) of the homes. Alternaria represented I/O greater than two in only one home (1.3%).
Table 4.
Indoor to outdoor (I/O) ratio of the concentration of fungi (CFU/m3) identified in patients' homes
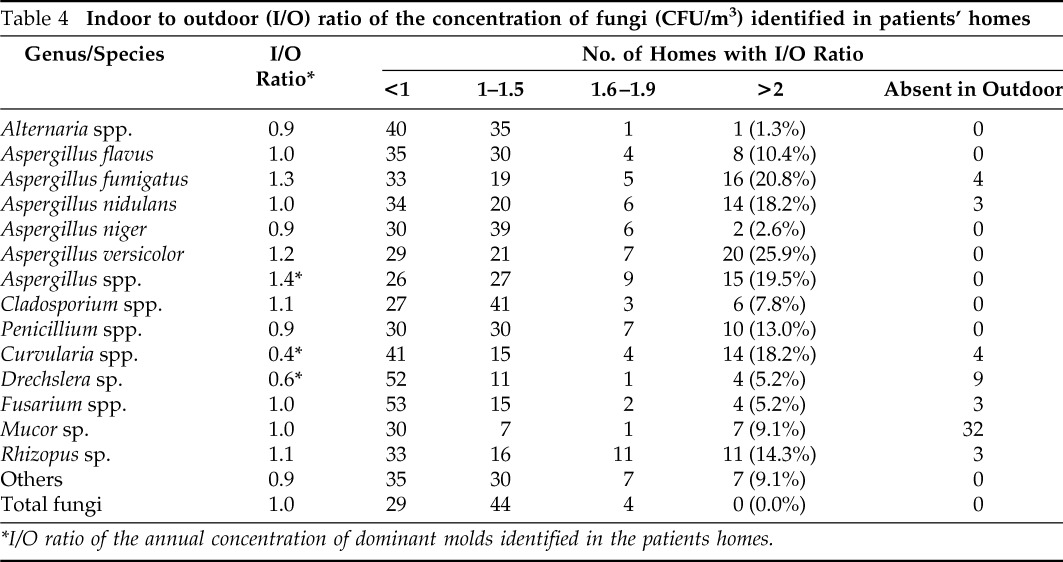
*I/O ratio of the annual concentration of dominant molds identified in the patients homes.
DISCUSSION
Recently, a rise in the percent of children suffering from various respiratory disorders has been observed.1 It has been observed that respiratory allergic patients suffer from acute asthmatic attacks more frequently during the changing season and weather conditions.21 Fungi are potent aeroallergens and atmospheric surveys have reported that seasonal variations in fungal concentrations could be the prime cause of clinical allergy and asthma.8 Previous studies at various places in India including Delhi have focused only on occupational environments; therefore, the present aerobiological study is the first to be performed in Delhi (India), emphasizing on qualitative and quantitative prevalence of the clinically significant aerospora inside and outside the homes.
The studies performed in different countries provide variable results of total fungal concentration and distribution of fungi because it basically depends on media and sampling method used, season of the year, geographical location, and living conditions as well as fungal growth substrates in different countries.22 We have collected 1-year quantitative data on tropical fungi from each home and fungal concentrations were high when compared with other studies.8,23–25 Shelton et al.26 recorded the medium concentration of 500 CFU/m3 in the United States. Takahashi27 observed a concentration range of 13–2750 CFU/m3 from the city of Yokohama, Japan. de Ana et al.28 isolated a total of 11,843 fungal colonies per cubic meter ranging from 0 to 1666 CFU/m3 in different homes of allergic patients from Barcelona, Spain. The higher concentration could be caused by tropical vegetation in and around Delhi and conducive temperature and humidity.
Among the 35 fungal genera isolated, the prevalent fungal groups from all of the homes were different species of Aspergillus, Penicillium, Alternaria, and Cladosporium. Nonsporing isolates and yeast were also frequently isolated but they were grouped into “others.” Some of these fungi have been reported as the most common airborne fungi in different environments in other studies also12,23,26–30 and have been considered to be the potent allergens in aerospora of many indoor and outdoor environments contributing to the increase in respiratory diseases in children as well as adults.31–33 Aspergillus was the most diverse genera in terms of number of species identified in the present study. A. niger, A. flavus, A. fumigatus, A. versicolor, A. nidulans, and Aspergillus variecolor were more common than other species. Aspergillus was also the most dominant fungal group in the present study. A similar result was also found by Singh et al.29 and Pandit et al.12 in Delhi, India. Khan et al.,30 from Kuwait have also found Aspergillus species to be the predominant component of the aerospora. Fungal genera other than four fungi were Fusarium, Curvularia, Drechslera, Mucor, and Rhizopus. In Penicillium genera, Penicillium citrinum, Penicillium chrysogenum, Penicillium oxalicum, and Penicillium nigricans were the most frequent species.
We scored significant seasonal variations in indoor as well as outdoor culturable airborne fungi. Aspergillus and Penicillium are more prevalent in autumn and winter, whereas Cladosporium was more prevalent in winter and summer. Such seasonal distributions have also been reported in the homes of United States10,25 and Spain.28 In the United States,25 an unexpectedly high fungal spore concentration has been observed during winter. Alternaria is most predominant in dry weather (summer), as observed by other workers in other parts of the world.28,34 In occupational environments such as the bakery and sugar industry, definite sources of fungal growth are present, even then seasonal patterns in fungal concentration have been reported,13,35 which indicates that patients are definitely exposed to fungi according to their seasonality. Therefore, it becomes important to include seasonal variations in fungi in any study model because the concentration of any fungi taken at one time can not be representative of the level throughout the year.9 Different species of Aspergillus had marked seasonality, but variations are observed in particular seasonal predominance. For example, A. fumigatus and A. nidulans, being xerophilic fungi, are prevalent in summer, whereas, A. flavus and A. niger are predominant in autumn. These variations are in conformity with studies performed elsewhere.27,36–38
The highest concentration of Alternaria is 137 CFU/m3 inside the homes and 169 CFU/m3 immediately outside the homes in the month of April (summer; the values are calculated for CFU/m3 per sampling). Both of these values exceed 100 CFU/m3, which have been related to hyperresponsiveness of airways in children sensitive to Alternaria, the allergens of which contribute to severe asthma in regions where exposure to the fungus is high.39
According to the Wilcoxon signed-rank test, the indoor and outdoor CFU levels integrated over the entire test period are not significantly different, although indoor presence of fungi is slightly higher, but overall, no statistical difference was observed between indoor and outdoor fungal levels, except for Aspergillus spp., which is considered primarily to be an indoor allergen.40 It has been proposed that indoor air spora is representative of that present in the outdoor environment as in present study airborne fungi observed indoors paralleled with those outdoors, although quantitative variations may exist that may be caused by the presence of indoor fungal source, dampness in home, or use of air conditioners and humidifiers, etc. In India, and especially in middle class families, use of air conditioners and humidifiers is not very common. Similar results have also been seen in the homes of mold-sensitive children with asthma in a U.S. city6 and in Taiwanese school children,41 where the concentration of airborne fungi encountered indoors generally paralleled with those found outdoors as observed in the present study.
We observed higher levels of fungal concentration in the homes of patients when compared with that in control (nonallergic) homes in indoor air. However, except in a few cases (Mucor spp., Rhizopus spp., and Curvularia spp), statistical difference in their concentration is found lacking. The lack of quantitative difference in airborne fungi between patients and control homes could be because of the fact that genetically predisposed children are more likely to suffer from respiratory trouble.
All of the fungi occurred (percent occurrence) at significantly higher rates inside the homes when compared with immediately outside the homes. It was also observed that significantly higher rates of percent occurrence of the dominant fungi was present in the homes of patients when compared with that in nonasthmatic/healthy volunteer homes, which is in contrast to mold concentration where statistical significance was not observed. It is a common observation that once the air infiltrates inside the home, the spores do not find an escape route to the outside air. These spores get settled in the dust and become airborne whenever there is any human disturbance. Regular removal of dust by vacuuming or wiping also removes the infiltrated spores, but lack of such activities might be responsible for longer persistence of spores inside the patients' homes. The level of fungal spores inside the homes has been analyzed in New York, and it is found that characteristic of housing (habitat) might predict higher or lower concentrations of spores in the dust.42
The I/O ratio is another indicator for evaluating the difference between indoor and outdoor fungal levels as well as house-to-house variation of dominant fungi because indoor and outdoor distribution of fungi was not similar in all of the homes as evident from the CoVs observed. Most of the dominant genera have few homes with I/O ratio >2 excluding Aspergillus (18–26%), Penicillium (13%), Curvularia (18.2%), and Rhizopus (14.3%). Some of the dominant genera are also observed to be absent in immediate outdoors. For example Mucor is not recovered from immediate outdoors from 32 homes, indicating its immediate source inside the homes.
Li et al. have examined the homes of 46 asthmatic children and observed that Aspergillus and Penicillium are more prevalent indoors when compared with outdoors with I/O ratios >2.41–43 Asthmatic children living in such houses have been studied in detail in the United States for their respiratory dysfunction and sensitivity to these fungi (unpublished data). Earlier work from our laboratory has established the role of Aspergillus and other fungi in patients of different occupational settings.44,45 Important pollen and fungal aeroallergens from India have recently been reviewed by Singh and Shipra.46
There is similarity in the fungal composition in different environmental studies, but there are great variations of the concentration as well as percent contributions of fungi. This indicates that the concentration percentages of fungal groups are influenced by the sampling methodology and environmental conditions.47 There can be plausible correlation between the seasonal changes in the symptoms of asthma and fungal spore counts because marked seasonal fluctuations are observed in various fungi as shown by the studies in other countries.7,48,49 Prevalence of sensitization is also essential to evaluate the effect of exposure, which will be included in additional publications. It is important to be aware of the fungal flora in places where asthmatic people reside for proper diagnosis and management of the disease and, therefore, proper investigations and valid approaches are of immense clinical importance to evaluate the relationships between the health symptoms and microfungal concentration.
ACKNOWLEDGMENTS
The authors thank the Indian Council of Medical Research (ICMR), New Delhi, for financial assistance and the subjects who volunteered for the study. They also thank Vinod Kr. Singh and Ramesh Kr. Verma for their help in collection of air samples.
Footnotes
The authors have no conflicts to declare pertaining to this article
REFERENCES
- 1. Masoli M, Fabian D, Holt S, Beasley R. Global Initiative for Asthma (GINA) program: The global burden of asthma: Executive summary of the GINA Dissemination Committee report. Allergy 59:469–478, 2004 [DOI] [PubMed] [Google Scholar]
- 2. Chhabra SK, Gupta CK, Chhabra P, Rajpal S. Prevalence of bronchial asthma in school children in Delhi. J Asthma 35:291–296, 1998 [DOI] [PubMed] [Google Scholar]
- 3. Paramesh H. Epidemiology of asthma in India. Ind J Pediatr 69:309–312, 2002 [DOI] [PMC free article] [PubMed] [Google Scholar]
- 4. O'Driscoll BR, Hopkinson LC, Denning DW. Mold sensitization is common amongst patients with severe asthma requiring multiple hospital admissions. BMC Pulm Med 5:4, 2005 [DOI] [PMC free article] [PubMed] [Google Scholar]
- 5. Katz Y, Verlerger H, Barr J, et al. Indoor survey of moulds and prevalence of mould atopy in Israel. Clin Exp Allergy 29:186–192, 1999 [DOI] [PubMed] [Google Scholar]
- 6. O'Conner GT, Walter M, Mitchell H, et al. Airborne fungi in the homes of children with asthma in low-income urban communities: The Inner-City Asthma Study. J Allergy Clin Immunol 114:599–606, 2004 [DOI] [PubMed] [Google Scholar]
- 7. Beaumont F, Kauffman HF, Sluiter HJ, de Vries K. Sequential sampling of fungal air spores inside and outside the homes of mould sensitive, asthmatic patients: A search for a relationship to obstructive reactions. Ann Allergy 55:740–746, 1985 [PubMed] [Google Scholar]
- 8. Dharmage S, Bailey M, Raven J, et al. Mouldy houses influence symptoms of asthma among atopic individuals. Clin Exp Allergy 32:714–720, 2002 [DOI] [PubMed] [Google Scholar]
- 9. Gent JF, Ren P, Belanger K, et al. Levels of household mold associated with respiratory symptoms in the first year of life in a cohort at risk of asthma. Environ Health Perspect 110:A781–A786, 2002 [DOI] [PMC free article] [PubMed] [Google Scholar]
- 10. Lee T, Grinshpun SA, Martuzevicius D, et al. Relationship between indoor and outdoor bio-aerosols collected with a button inhalable aerosol sampler in urban homes. Indoor Air 16:37–47, 2006 [DOI] [PMC free article] [PubMed] [Google Scholar]
- 11. Singh A, Singh AB. Airborne fungi in a bakery and the prevalence of respiratory dysfunction among workers. Grana 33:349–358, 1994 [Google Scholar]
- 12. Pandit T, Singh S, Singh AB. Prevalence of culturable and nonculturable airborne fungi in a grain store in Delhi. Aerobiologia 11:177–182, 1995 [Google Scholar]
- 13. Adhikari A, Sen MM, Gupta-Bhattacharya S, Chanda S. Incidence of allergenically significant fungal aerosol in a rural bakery of West Bengal, India. Mycopathologia 149:35–45, 2000 [DOI] [PubMed] [Google Scholar]
- 14. Singh AB, Malik P, Prakash D, Gupta CK. Biological standardization of pollen allergens from India. Asia Pac J Allergy Immunol 10:103–109, 1992 [PubMed] [Google Scholar]
- 15. American Thoracic Society Lung function testing: Selection of reference values and interpretative strategies. Am Rev Respir Dis 144:1202–1218, 1991 [DOI] [PubMed] [Google Scholar]
- 16. Bousquet JC, Auwenberge PV, Khaltaev N. Allergic rhinitis and its impact on Asthma. J Allergy Clin Immunol 108: S147–S334, 2001 [DOI] [PubMed] [Google Scholar]
- 17. Andersen AA. New sampler for collection, seizing and enumeration of viable airborne particles. J Bacteriol 76:471–484, 1958 [DOI] [PMC free article] [PubMed] [Google Scholar]
- 18. Thom C, Raper KB. Manual of Aspergilli. The Williams and Wilkins Co., Baltimore, MD, 1945 [Google Scholar]
- 20. Subramaniam CV. Hypomycetes. Indian Council of Agricultural Research, New Delhi, India, 1971 [Google Scholar]
- 20. Barnett HL. Illustrated Genera of Imperfect Fungi, ed. II Burgess Publishing Co., Minneapolis, MN, 1969 [Google Scholar]
- 21. Priftis KN, Paliatsos AG, Panagiotopoulou-Gartagani P, et al. Association of weather conditions with childhood admissions for wheezy bronchitis or asthma in Athens. Respiration 73:783–790, 2006 [DOI] [PubMed] [Google Scholar]
- 22. Das S, Gupta-Bhattacharya S. Enumerating outdoor aeromycota in suburban West Bengal, India, with reference to respiratory allergy and meteorological factors. Ann Agric Environ Med 15:105–112, 2008 [PubMed] [Google Scholar]
- 23. Adhikari A, Sen MM, Gupta-Bhattacharya S, Chanda S. Airborne viable, non-viable, and allergenic fungi in a rural agricultural area of India: A 2-year study at five outdoor sampling stations. Sci Total Environ 326:123–141, 2004 [DOI] [PubMed] [Google Scholar]
- 24. Li C-S, Hsu L-Y. Airborne fungus allergen in association with residential characteristics in atopic and control children in a subtropical region. Arch Environ Health 52: 72–79, 1997 [DOI] [PubMed] [Google Scholar]
- 25. Ren P, Jankun TM, Belanger K, et al. The relation between fungal propagules in indoor air and home characteristics. Allergy 56:419–424, 2001 [DOI] [PubMed] [Google Scholar]
- 26. Shelton B, Kirkland KH, Flanders WD, Morris GK. Profiles of airborne fungi in buildings and outdoor environments in the United States. Appl Environ Microbiol 68:1743–1753, 2002 [DOI] [PMC free article] [PubMed] [Google Scholar]
- 27. Takahashi T. Airborne fungal colony-forming units in outdoor and indoor environments in Yokohama, Japan. Mycopathologia 139:23–33, 1997 [DOI] [PubMed] [Google Scholar]
- 28. de Ana SG, Torres-Rodríguez JM, Ramírez EA, et al. Seasonal distribution of Alternaria, Aspergillus, Cladosporium, and Penicillium species isolated in homes of fungal allergic patients. J Investig Allergol Clin Immunol 16:357–363, 2006 [PubMed] [Google Scholar]
- 29. Singh A, Ganguli M, Singh AB. Fungal spores are an important component of library air. Aerobiologia 11:231–237, 1995 [Google Scholar]
- 30. Khan ZU, Khan MA, Candy R, Sharma PN. Aspergillus and other moulds in the air of Kuwait. Mycopaphologia 146:25–32, 1999 [DOI] [PubMed] [Google Scholar]
- 31. Sanchez H, Bush RK. A review of Alternaria alternata sensitivity. Rev Iberoam Micol 18:56–59, 2001 [PubMed] [Google Scholar]
- 32. Helbling A, Reimers A. Immunotherapy in fungal allergy. Curr Allergy Asthma Rep 3:447–453, 2003 [DOI] [PubMed] [Google Scholar]
- 33. Lin RY, Williams KD. Hypersensitivity to molds in New York City in adults who have asthma. Allergy Asthma Proc 24:13–18, 2003 [PubMed] [Google Scholar]
- 34. Bush RK, Prochnau JJ. Alternaria-induced asthma. J Allergy Clin Immunol 113:227–234, 2004 [DOI] [PubMed] [Google Scholar]
- 35. Singh AB, Chatterji M, Singh BP, Gangal SV. Airborne viable fungi in library: Before and after agitation of books. Ind J Aerobiol 3:32–38, 1990 [Google Scholar]
- 36. Beaumont F, Kauffman HF, Sluiter HJ, de Vries K. A volumetric-aerobiologic study of seasonal fungus prevalence inside and outside of asthmatic patients living in Netherlands. Allergy 53:486–492, 1984 [PubMed] [Google Scholar]
- 37. Pei-Chih W, Huey-Jen S, Chia-Yin L. Characteristic of indoor and outdoor airborne fungi at suburban and urban homes in two seasons. Sci Total Environ 253:111–118, 2000 [DOI] [PubMed] [Google Scholar]
- 38. Jacob B, Ritz B, Gehring U, et al. Indoor exposure to molds and allergic sensitization. Environ Health Perspect 110:647–653, 2002 [DOI] [PMC free article] [PubMed] [Google Scholar]
- 39. Downs SH, Mitakakis TZ, Marks GB, et al. Clinical importance of Alternaria exposure in children. Am J Respir Crit Care Med 164:455–459, 2001 [DOI] [PubMed] [Google Scholar]
- 40. Horner WE, Helbling A, Salvaggio JE, Lehrer SB. Fungal allergens. Clin Microbiol Rev 8:161–179, 1995 [DOI] [PMC free article] [PubMed] [Google Scholar]
- 41. Su HJ, Wu PC, Lin CY. Fungal exposure of children at homes and schools: A health perspective. Arch Environ Health 56:144–149, 2001 [DOI] [PubMed] [Google Scholar]
- 42. Chew GL, Rogers C, Burge HA, et al. Dustborne and airborne fungal propagules represent a different spectrum of fungi with differing relations to home characteristics. Allergy 58:13–20, 2003 [DOI] [PubMed] [Google Scholar]
- 43. Li CS, Hsu LY, Chou CC, Hsieh KH. Fungus allergens inside and outside the residences of atopic and control children. Arch Environ Health 50:38–43, 1995 [DOI] [PubMed] [Google Scholar]
- 44. Singh A, Parkash D, Singh AB. Sensitization to different species of Aspergillus in bakery workers and general atopic population. Asian Pac J Allergy Immunol 16:5–15, 1998 [PubMed] [Google Scholar]
- 45. Sharma D, Datta BK, Singh AB, Shome BR. Aerobiological, biochemical and immunological studies on some of the dominant Aspergillus spp. of South Assam (India). Aerobiologia 23:201–210, 2007 [Google Scholar]
- 46. Singh AB, Shipra S. Aeroallergens in clinical practice of allergy in India. ARIA Asia Pacific Workshop Report. Asian Pac J Allergy Immunol 26:1–12, 2008 [PubMed] [Google Scholar]
- 47. Fang Z, Ouyang Z, Hu L, et al. Culturable airborne fungi in outdoor environments in Beijing, China. Sci Total Environ 350:47–58, 2005 [DOI] [PubMed] [Google Scholar]
- 48. Malling HJ. Diagnosis and immunotherapy of mould allergy. IV. Relation between asthma symptoms, spore counts, and diagnostic tests. Allergy 41:342–350, 1986 [DOI] [PubMed] [Google Scholar]
- 49. Khot A, Burn R. Seasonal variation and time trend of death from asthma in England and Wales 1960–82. BMJ 289:233–234, 1984 [DOI] [PMC free article] [PubMed] [Google Scholar]


