Abstract
Oxidative stress induces not only senescence but also autophagy in a variety of mammalian cells. However, the relationship between these two has not been well established and thus, was investigated in the present study using WI38 human diploid fibroblasts (WI38 cells) as a model system. Our results showed that exposure of WI38 cells to H2O2 induced both senescence and autophagy. Downregulation of autophagy protein 5 (Atg5) with Atg5 siRNA inhibited not only autophagy but also senescence induced by H2O2. Further studies showed that Atg5 regulates H2O2-induced senescence primarily by up-regulating the expression of p21 at the level of post-transcription. In addition, we examined the mechanisms by which H2O2 induces autophagy in WI38 cells. Our results revealed that H2O2 increases autophagy independent of the mammalian target of rapamycin (mTOR) negative feedback pathway. Instead, the induction of autophagy by H2O2 depends on the induction of intracellular production of reactive oxygen species (ROS) and activation of the p38 mitogen-activated protein kinase α (p38 MAPKα) pathway.
Keywords: Oxidative stress, Reactive oxygen species, Autophagy, Senescence, p21, p38 mitogen-activated protein kinase α
1. Introduction
Autophagy is a conserved mechanism from yeast to humans for the maintenance of cellular homeostasis through cytoplasmic and organelle turnover (Donati et al., 2001; Cuervo et al., 2005; Mizushima et al., 2008). Its activity increases when cells are exposed to oxidative stress (Azad et al., 2009; Dewaele et al., 2010). However, the mechanisms by which oxidative stress increases autophagy have not been well established (Azad et al., 2009). In addition, exposure to oxidative stress also induces senescence (Toussaint et al., 2000; Lu and Finkel, 2008). The relationship between these two cellular responses to oxidative stress has not been defined. For example, it is not known if autophagy and senescence can be induced by oxidative stress through a common molecular pathway. Neither is it known whether oxidative stress-induced autophagy plays a role in the induction of senescence and vice versa.
It was recently shown that autophagy mediates oncogenic stress-induced senescence by promoting the transition of mitotic arrest to the establishment of senescence phenotypes (Young et al., 2009). The induction of autophagy by oncogenic stress is attributed to the downregulation of the mammalian target of rapamycin (mTOR) pathway which can negatively regulate autophagy. In contrast, it has been shown that reactive oxygen species (ROS) can activate the mTOR pathway (Blagosklonny, 2008). Therefore, it has yet to be determined whether oxidative stress-induced autophagy also plays a role in the induction of senescence through inhibition of the negative feedback of mTOR.
Exposure of normal human diploid fibroblasts such as WI38 cells to H2O2 has been widely used as a model to investigate oxidative stress-induced senescence (Chen, 2000; Chen and Ames, 1994; Toussaint et al., 2000). Therefore, in this study we used this model to investigate the role of autophagy in oxidative stress-induced senescence and the mechanisms by which exposure to oxidative stress such as H2O2 induces autophagy. Our results suggest that oxidative stress-induced autophagy and senescence are intricately related and may share a common pathway for their induction.
2. Materials and methods
2.1. Reagents and antibodies
SB203580 (4-[4-fluorophenyl]-2-[4-methylsulfinylphenyl]-5-[4-pyridyl] 1H-imidazole or SB), a p38MAPKα specific inhibitor, was purchased from LC Laboratories (Woburn, MA). MTT ((4,5-dimethylthiazolyl-2)-2,5-diphenyltetrazolium bromide), 3-Methyladenine (3-MA), an autophagy inhibitor, N-acetylcysteine (NAC), and 5-bromo-2′-deoxyuridine (BrdU) were obtained from Sigma (St. Louis, MO). The antibodies against Beclin-1 (clone EPR1773Y), Ulk3, and LC3b (MAP1LC3b) were purchased from Abcam (Cambridge, MA). The antibodies against p21Cip1/WAF1 (p21), p16Ink4a (p16), phosphorylated p70S6K (p-p70S6K), and β-actin were obtained from Santa Cruz (Santa Cruz, CA). The antibodies against phosphorylated p38 MAPKα (p-p38 MAPKα), 4E-BP1 (p-4E-BP1) and AKT (S473) (p-AKT) and Atg5 antibody were ordered from Cell Signaling Company (Boston, MA). The antibody against BrdU was purchased from Biolegend (San Diego, CA). The goat anti-rabbit IgG-HRP, rabbit anti-goat IgG-HRP, rabbit anti-mouse IgG-HRP, and FITC- or Cy3-conjugated goat anti-rabbit IgG were purchased from Invitrogen (Carlsbad, CA).
2.2. Cell culture
WI38 cells were originally obtained from the Cell Bank of Chinese Academy of Sciences, and cultured in a complete medium (Dulbecco’s Modified Eagle Medium, DMEM, supplemented with 10% fetal bovine serum, 100 U/ml penicillin, and 100 μg/ml streptomycin) in a humidified incubator at 37 °C and 5% CO2. The cells at early passages (between 20 and 28 passages) were used in all experiments to avoid complications of replicative senescence as WI38 cells have a mean life span about 45–60 passages. For the induction of premature senescence, WI38 cells at about 80% confluence were exposed to 250 μM H2O2 diluted in DMEM supplemented with 10% FBS for 2 h and then were washed twice with DMEM to remove H2O2. They were cultured in a fresh complete medium for 24 h before being subcultured for various durations as specified in individual experiments.
2.3. Cell viability assay
The viability of cells was assessed by the MTT assay as previously described (Marks et al., 1992).
2.4. Analysis of ROS production
The stock solution (10 mM) of ROS detecting probe 2′, 7′-dichlorfluorescein-diacetate (DCFH-DA) (Sigma-Aldrich, St. Louis, MO) was prepared in ethanol. The stock solution was diluted with a staining solution (5 mg/ml BSA in 1×PBS) to a final concentration of 1 μg/ml. Analysis of ROS production was performed according to the method reported previously (Carter et al., 1994). The oxidation of DCFH by ROS was determined by measuring the mean fluorescent intensity of DCF in a minimum of 10,000 cells using a FACS Caliber flow cytometer (Becton Dickinson, San Jose, CA) at λex=488 nm and λem=525 nm.
2.5. Knocking down Atg5 and p21 by siRNA
Signal Silence® Atg5 siRNA, p21 siRNA and control siRNA were purchased from Cell Signaling (Boston, MA), transfection reagent HiPerFect was obtained from Qiagen (Alameda, CA). The siRNA transfection was carried out according to the protocol provided by Qiagen. At 72 h after transfection, the efficiency of siRNA to down-regulate the expression of Atg5 and p21 was determined by Western blot analysis.
2.6. Senescence-associated β-galactosidase (SA-β-gal) staining
SA-β-gal activity was determined using an SA-β-gal staining kit (Cell Signaling Technology, Boston, MA) according to the manufacturer’s instructions. Senescent cells were identified as blue-stained cells by standard light microscopy. A minimum of 500 cells was counted in 10 random fields to determine the percentage of SA-β-gal-positive cells.
2.7. LC3b immunofluorescence staining
The cells were fixed with 4% paraformaldehyde and permeabilized with 0.3% Triton using a standard protocol described previously (Straface et al., 2007). Incubation with the primary antibody against LC3b was performed at 4 °C overnight before incubation with FITC- or CY3-conjugated secondary antibody. The images were captured using a Nikon Fluorescence Microscope with an F-601-AF camera (Nikon, Japan) and displayed with the Adobe Photoshop CS5 software.
2.8. BrdU incorporation assay
DNA synthesis was determined by measuring BrdU incorporation into DNA as previously described (Maruyama et al., 2002).
2.9. Western blot analysis
The protein extracts from WI38 cells were subjected to Western blot analysis as described previously (Wang et al., 2004).
2.10. Analysis of IL-6 and IL-8 ELISA
The supernatants of WI38 cells subjected to various treatments were collected for the analysis of IL-6 and IL-8 by the ELISA kits purchased from R&D (Waltham, MA) according to the protocol provided by the manufacturer.
2.11. Real-time reverse transcription-polymerase chain reaction (RT-PCR)
Total RNA was extracted using the RNeasy Mini Kit (Qiagen Sciences, Germantown, MD) according to the manufacturer’s instructions. First-strand cDNA was synthesized from total RNA using a Super Script II first-strand synthesis system (Invitrogen) according to the manufacturer’s protocols. The sequences of PCR primers used in the assays are listed in Table 1, except that of glyceraldehyde 3 phosphate dehydrogenase (GAPDH) primers which were a gift from the Department of Immunology of Tongjing Medical College, China. Quantitative polymerase chain reaction (qPCR) was subsequently performed using SYBR Green®Real-time PCR Master Mix (Toyobo Co, Japan). The threshold cycle (Ct) value for each gene was normalized to the Ct value of GAPDH. The relative mRNA expression was calculated using the comparative CT (2−ΔΔCt) method as previously described (Wang et al., 2006).
Table 1.
Primers.
| Genes | Forward | Reverse |
|---|---|---|
| Ulk3 | TGAAGGAGCAGGTCAAGATGAGG | GCTACGAACAGATTCCGACAGTCC |
| Beclin-1 | TGTCACCATCCAGGAACTCA | CTGTTGGCACTTTCTGTGGA |
| LC3b | ACGCATTTGCCATCACAGTTG | TCTCTTAGGAGTCAGGGACCTTCAG |
| P21 | CTG GAG ACT CTC AGG GTC GAA | CCA GGA CTG CAG GCT TCC |
2.12. Transmission electron microscopy
Cells with or without H2O2 treatment were collected and processed using the classical method described previously (Young et al., 2009). Ultra-thin sections (85 nm) were prepared for each sample and analyzed on a JEM-10CX II transmission electron microscope (JEOL, Japan) at 60 kV.
2.13. Statistical analysis
At least three biological replicates were done for each experiment. Data are expressed as means±SD and were analyzed using the Statistical Package for Social Sciences (SPSS) software (Version 13.0) by ANOVA. In the event that ANOVA justified post hoc comparisons between group means, these were conducted using the Student–Newman–Keuls test for multiple comparisons. For experiments in which only single experimental and control groups were used, the difference between groups was examined by unpaired Student’s t test. A probability of P ≤ 0.05 was considered significant.
3. Results
3.1. Exposure of WI38 cells to H2O2 induces not only senescence but also autophagy
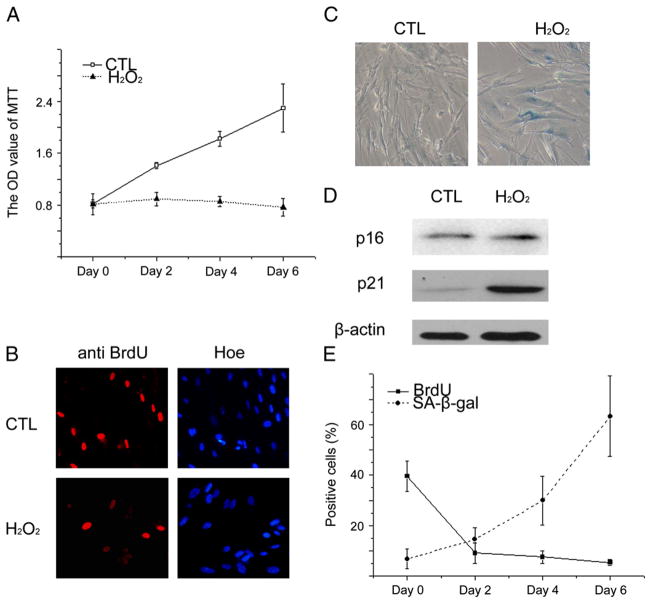
WI38 cells were exposed to H2O2 for 2 h at a concentration of 250 μM as they reached about 80% confluence. At day 6 after exposure to H2O2, the majority of the cells ceased to proliferate and synthesize DNA (Fig. 1A, B) and exhibited phenotypic changes that resembled those observed in the cells undergoing replicative senescence, including increased SA-β-gal activity, flattened cell morphology, and enlarged cell size (Fig. 1C). In addition, p21 expression was increased, but the expression of p16 was not significantly elevated by the treatment with H2O2 (Fig. 1D), as shown in a previous report (Wang et al., 2004). Moreover, it was found that the cells ceased to incorporate BrdU within 2 days after exposure to H2O2, whereas SA-β-gal activity, a widely accepted biomarker of senescence, in H2O2-treated cells increased gradually to the peak levels 6 days after the exposure (Fig. 1E). These findings suggest that cells become senescent at a later time point after being growth arrested by the exposure to H2O2.
Fig. 1.
H2O2 induces senescence in WI38 cells. WI38 cells were treated either with vehicle (10% FBS DMEM) as a control (CTL) or with 250 μM H2O2 for 2 h. After H2O2 treatment, they were cultured in a complete medium for various durations before being assayed as described below. (A) Cell growth was determined by the MTT assay at day 0, 2, 4 or 6 after H2O2 treatment. The data are presented as means±SE of OD value at 562 nm (n=3). (B) Analysis of DNA synthesis in control cells (CTL) or the cells 6 days after H2O2 treatment by BrdU incorporation assay. Representative photomicrographs of BrdU staining were shown. The blue staining represents the nucleic staining by Hoechst and the red staining represents specific BrdU staining with anti-BrdU antibody. (C) Representative photomicrographs of SA-β-gal staining in control cells (CTL) or the cells 6 days after H2O2 treatment. The cells stained in blue represent SA-β-gal positive senescent cells. (D) Analysis of p21 and p16 expression in control cells (CTL) or the cells 6 days after H2O2 treatment by Western blot. Representative images of p21 and p16 Western blots are shown. The β-actin blot is included as a loading control. (E) Dynamic changes in the percentage of BrdU and SA-β-gal positive cells after H2O2 treatment are shown. The data are presented as means±SD from three independent experiments.
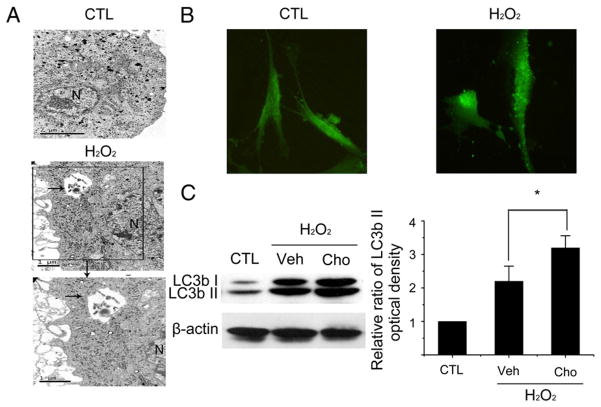
Next, we examined the ability of H2O2 to induce autophagy in WI38 cells after they become senescent by transmission electron microscopy and LC3b immunofluorescence staining to detect autophagosomes and LC3b distribution, respectively, because both of them have been widely used as markers of autophagy. It was found that H2O2-induced senescent cells exhibited more autophagosomes and LC3b puncta compared to control cells without H2O2 treatment (Fig. 2A, B). The increase in LC3bII in H2O2-treated cells is not caused by the dysfunction of lysosomes, because treatment with Choloroquine (a lysosome inhibitor) caused a further accumulation of LC3bII protein in the senescent cells (Fig. 2C). These results demonstrate that exposure to H2O2 not only induces senescence but also increases autophagy in WI38 cells.
Fig. 2.
H2O2 increases autophagy. WI38 cells were either treated with vehicle (10% FBS DMEM) as a control (CTL) or with 250 μM H2O2 for 2 h. After H2O2 treatment, they were cultured in a complete medium for 6 days before being assayed as described below. (A) Representative transmission electron microscopic photomicrographs of a control cell (CTL) and a cell treated with H2O2. The arrow points to an autophagosome in the cytoplasma of the H2O2-treated cells. N=nucleus. (B) Representative photomicrographs of LC3b immunofluorescent staining (green) to show the distribution of LC3b in control cells (CTL) or cells treated with H2O2. (C) Analysis of LC3b I and II expression in control cells (CTL) or cells treated with H2O2 plus vehicle (Veh, PBS) or Choloroquine (Cho, 50 μM). Vehicle or Choloroquine were added to the cultures of H2O2-treated cells 4 h before they were harvested for Western blot analysis. Representative Western blot images of LC3b I and II are shown on the left. The β-actin blot is included as a loading control. The relative ratios of LC3b II optical densities between CTL and H2O2-treated cells are presented on the right as means±SD (n=3). *P ≤ 0.05.
3.2. Autophagy regulates the induction of senescence by H2O2
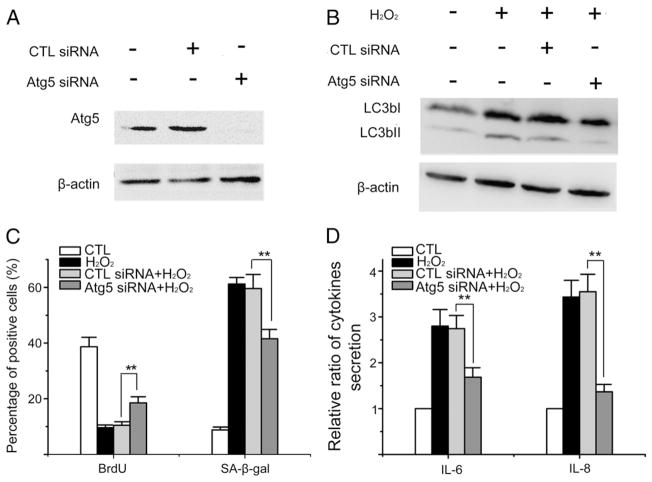
To determine the role of autophagy in H2O2-induced senescence, we downregulated the expression of Atg5 in WI38 cells prior to their exposure to H2O2 using Atg5 specific siRNA (Fig. 3A), because Atg5 is essential for the formation of autophagosomes (Klionsky et al., 2008). It was found that knockdown of Atg5 prevented LC3bII accumulation induced by H2O2, confirming that Atg5 downregulation inhibits oxidative stress-induced autophagy (Fig. 3B). In addition, downregulation of Atg5 expression also inhibited the induction of senescence by oxidative stress, as the cells pretreated with Atg5 siRNA exhibited increased BrdU incorporation, decreased SA-β-gal activity, and reduced secretion of IL-6 and IL-8 compared to cells treated with control siRNA after exposure to H2O2 (Fig. 3C, D). These data demonstrate that suppression of autophagy inhibits the induction of senescence by H2O2 and thus suggest that autophagy plays an important role in regulation of ROS-induced senescence.
Fig. 3.
Knocking down Atg5 attenuates H2O2-induced autophagy and senescence. (A) WI38 cells were transfected with vehicle, control siRNA (CTL siRNA) or Atg5 siRNA as described in Materials and methods. Levels of Atg5 were determined by Western blot 3 days after the transfection to validate the efficiency and specificity of Atg5 knocking down. A representative Western blot image of Atg5 is shown. The β-actin blot is included as a loading control. (B)–(D) WI38 cells were transfected with vehicle, control siRNA or Atg5 siRNA as described above. Three days after the transfection, they were exposed to 250 μM H2O2 for 2 h. Cells without siRNA transfection and H2O2 treatment were included as a control (CTL). Six days after H2O2 treatment, they were harvested for the analyses of LC3b I and II expression by Western blots and senescence induction by BrdU and SA-β-gal stainings. In addition, the supernatants of the cell cultures were collected for the analysis of IL6 and IL8 secretion by ELISA. (B) Representative Western blot images of LC3b I and II are shown. The β-actin blot is included as a loading control. (C) Percentage of BrdU and SA-β-gal positive cells are shown. (D) Relative ratios of IL6 and IL8 secretion compared to untreated control cells (CTL) are shown. The data are presented in (C) and (D) as means±SD from three independent experiments. **P ≤ 0.01.
3.3. Autophagy regulates the induction of senescence by H2O2 through p21
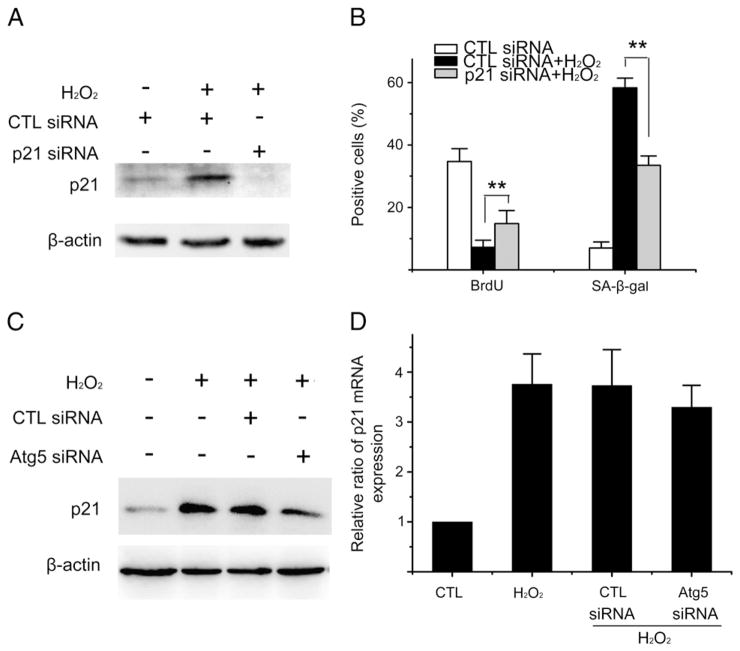
Since the induction of cellular senescence in WI38 cells by H2O2 was associated with an increased expression of p21 but not p16, we investigated whether autophagy regulates oxidative stress-induced senescence through p21. First, we examined the role of p21 in ROS-induced senescence by downregulating p21 with p21 siRNA (Fig. 4A). It was found that downregulation of p21 inhibited the induction of senescence by H2O2 as more p21 siRNA-treated cells incorporated BrdU and showed less SA-β-gal staining than control siRNA-treated cells after exposure to H2O2 (Fig. 4B). Interestingly, knocking down Atg5 reduced the levels of p21 protein in H2O2-treated cells (Fig. 4C) but had no significant effect on the expression of p21 mRNA induced by oxidative stress (Fig. 4D). This finding suggests that autophagy may regulate H2O2-induced senescence in part by upregulating the expression of p21 at the level of post-transcription.
Fig. 4.
Atg5 regulates H2O2-induced senescence in part via upregulation of p21. (A) and (B) WI38 cells were transfected with control siRNA (CTL siRNA) or p21 siRNA as described in Materials and methods. Three days after the transfection, they were exposed to 250 μM H2O2 for 2 h. Cells with CTL siRNA transfection but without H2O2 treatment were included as a control. Six days after H2O2 treatment, they were harvested for the analyses of p21 expression by Western blots and senescence induction by BrdU and SA-β-gal stainings. (A) A representative Western blot image of p21 is shown. The β-actin blot is included as a loading control. (B) Percentage of BrdU and SA-β-gal positive cells are shown. The data are presented in (B) as means±SD from three independent experiments. **P ≤ 0.01. (C) and (D) WI38 cells were transfected with vehicle, control siRNA (CTL siRNA) or Atg5 siRNA as described above. Three days after of the transfection, they were exposed to 250 μM H2O2 for 2 h. Cells without siRNA transfection and H2O2 treatment were included as a control (CTL). Six days after H2O2 treatment, they were harvested for the analyses of p21 expression by Western blot and qRT-PCR. (C) A representative Western blot image of p21 is shown. The β-actin blot is included as a loading control. (D) The relative ratios of p21 mRNA ΔCT values between the CTL and H2O2-treated cells are presented as means±SD (n=3).
3.4. H2O2 increases autophagy in WI38 cells independent of the negative feedback regulation of the mTOR pathway
A recent study showed that autophagy was elevated during oncogenic stress-induced senescence in correlation with negative feedback in the mTOR pathway (Young et al., 2009). Therefore, we examined whether oxidative stress can increase autophagy by downregulating the same pathway via analysis of the levels of p-p70S6K, p-4E-BP1 and p-AKT (s473), because p70S6K and 4E-BP1 are the downstream targets of mTOR complex 1 (mTORC1) and p-AKT (S473) is a phosphorylated product of mTOR complex 2 (mTORC2) (Zoncu et al., 2011). As one would expect, exposure of WI38 cells to H2O2 increased the activity of autophagy in a time-dependent manner as the cells showed gradual increases in the levels of not only LC3bII but also Beclin-1 (Atg6) and Ulk3 (Atg1) after H2O2-treatment (Fig. 5). Both Beclin-1 and Ulk3 have been implicated in the formation of the autophagosomes during autophagy (Klionsky et al., 2007). However, to our surprise, the levels of p-AKT (S473) were not changed by the treatment of the cells with H2O2 whereas those of p-p70S6K and p-4E-BP1 exhibited mixed alterations after oxidative stress exposure (Fig. 5). These findings indicate that unlike oncogenic stress (Young et al., 2009), oxidative stress may increase autophagy independent of downregulation of the mTOR pathway.
Fig. 5.
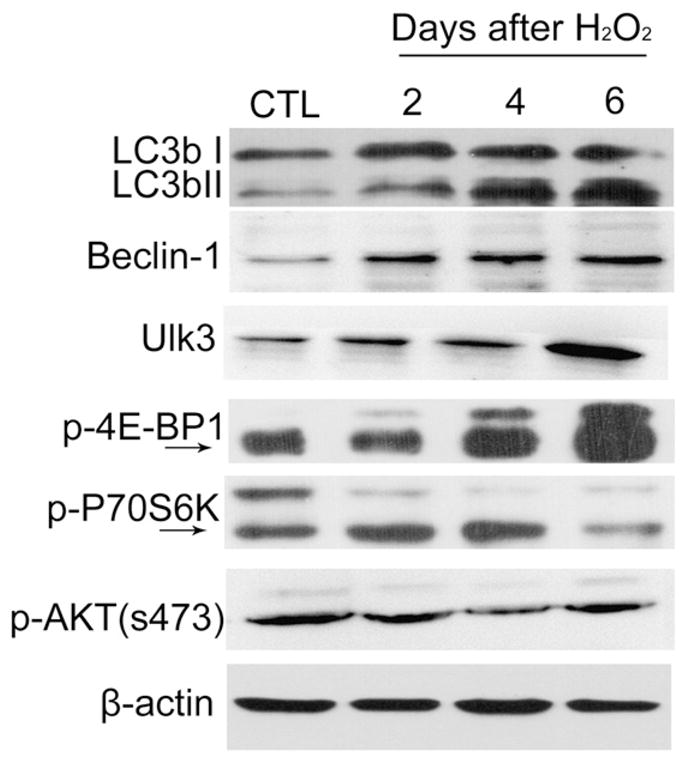
H2O2 does not inhibit the mTOR pathways to increase autophagy. WI38 cells were either treated with vehicle (10% FBS DMEM) as a control (CTL) or with 250 μM H2O2 for 2 h. After H2O2 treatment, they were cultured in a complete medium for 2, 4, or 6 days. Levels of selective autophagic proteins (LC3b I and II, Beclin-1, and Ulk3), the mTORC1 phosphorylated products p-p70S6K and p-4E-BP1, and the mTORC2 phosphorylated product p-AKT (s473) were analyzed by Western blots. Representative images from the Western blots are shown. The β-actin blot is included as a loading control.
3.5. Induction of intracellular ROS production mediates H2O2-induced autophagy
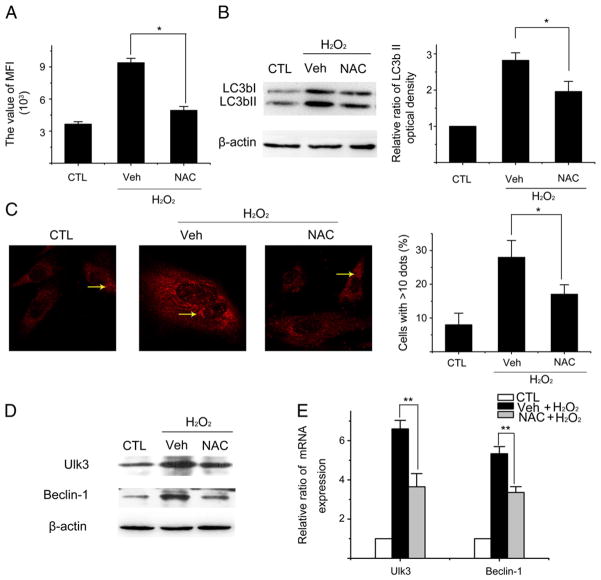
It has been well-established that increased production of intracellular ROS plays an important role in mediating the induction of not only senescence but also autophagy by a variety of stimuli (Chen et al., 2007; Essick and Sam, 2010; Scherz-Shouval and Elazar, 2007). Therefore, we examined the role of intracellular produced ROS in H2O2-induced autophagy. First, we examined whether exposure of WI38 cells to H2O2 for 2 h induces a persistent increase in intracellular production of ROS by the analysis of DCF FMI using a flow cytometer. As shown in Fig. 6A, even 6 days after H2O2 treatment WI38 cells still produced elevated levels of ROS, which could be attenuated by NAC, an effective antioxidant. More importantly, NAC treatment after H2O2 exposure inhibited the accumulation of LC3bII (Fig. 6B, C) and expression of Ulk3 and Beclin-1 (Fig. 6D, E). These findings suggest that increased production of intracellular ROS is primarily responsible for the induction of autophagy induced by an exogenous oxidative stress such as H2O2 treatment.
Fig. 6.
Induction of intracellular ROS production mediates H2O2-induced elevation of autophagy. WI38 cells were either treated with vehicle (10% FBS DMEM) as a control (CTL) or with 250 μM H2O2 for 2 h. After H2O2 treatment, they were cultured in a complete medium with vehicle (Veh) or NAC (100 mM) for 6 days before being assayed as described below. (A) Intracellular production of ROS measured by flow cytometry. The values of DCF MFI are presented as means±SD (n=3). (B) Levels of LC3b I and II analyzed by Western blots. A representative image of LC3b I and II Western blots is shown on the left. β-actin blot is included as a loading control. Relative radios of LC3b II and I optical densities between CTL and H2O2-treated cells are shown on the right as means±SD from three experiments. (C) Representative photomicrographs of LC3b immunofluorescent staining (red) are shown on the left to demonstrate the formation of LC3b puncta pointed by the yellow arrows. Percentage of cells with more than 10 LC3b puncta are presented on the right as means±SD (n=3). (D) Levels of Ulk3 and Beclin-1 analyzed by Western blots. Representative images of the Western blots are shown. The β-actin blot is included as a loading control. (E) Levels of Ulk3 and Beclin-1 mRNA measured by qRT-PCR. The relative ratios of Ulk3 and Beclin-1 mRNA ΔCT values between CTL and H2O2-treated cells are presented as means±SD (n=3). *P ≤ 0.05 and **P ≤ 0.01.
3.6. Activation of p38 MAPKα mediates induction of autophagy and p21 by H2O2
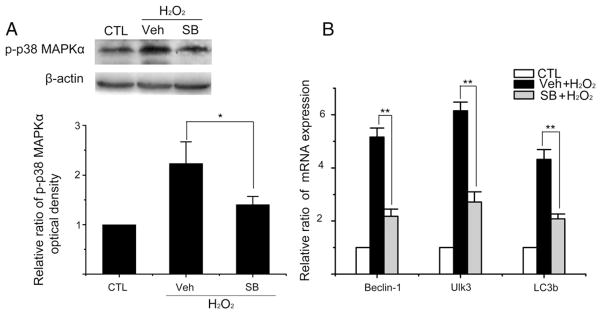
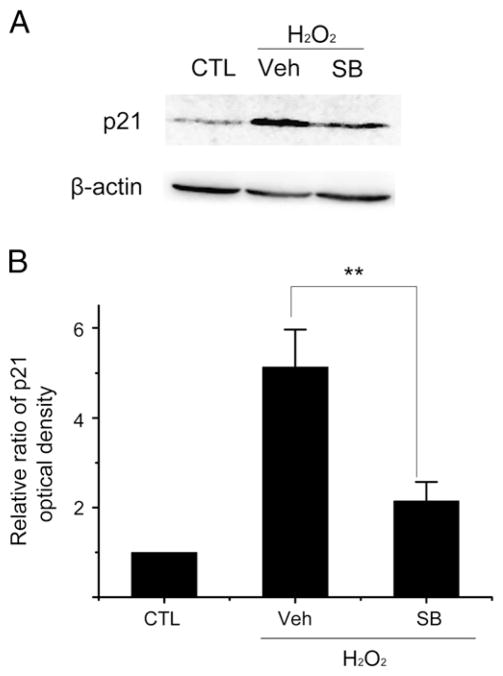
It has been shown that activation of p38 MAPKα mediates diverse stimuli-induced cellular senescence including that induced by oxidative stress (Iwasa et al., 2003). However, the role of p38 MAPKα in oxidative stress-induced autophagy has not been well defined and therefore, was studied. As shown in Fig. 7A, exposure of WI38 cells to H2O2 activated p38 MAPKα. The activation was significantly inhibited by the specific p38 MAPKα inhibitor SB (Fig. 7A). In addition, inhibition of p38 MAPKα activity by SB reduced the expression of Beclin-1, Ulk3 and LC3b mRNA induced by H2O2 (Fig. 7B). Furthermore, the expression of p21 induced by H2O2 treatment was also attenuated by SB (Fig. 8). These findings suggest that p38 MAPKα can mediate not only ROS-induced senescence but also oxidative stress-induced autophagy.
Fig. 7.
Activation of p38 MAPKα mediates the induction of Beclin-1, Ulk3 and LC3b mRNA by H2O2. WI38 cells were either treated with vehicle (10% FBS DMEM) as a control (CTL) or with 250 μM H2O2 for 2 h. After H2O2 treatment, they were cultured in a complete medium with vehicle (Veh) or SB203580 (SB, 10 μM) for 6 days before being assayed as described below. (A) Analysis of p38 MAPKα activation by Western blot. A representative p-p38 MAPKα Western blot image is shown on the upper panel. The β-actin blot is included as a loading control. The relative ratios of p-p38 MAPKα optical densities between CTL and the H2O2-treated groups are presented as means±SD (n=3) on the lower panel. (B) Levels of Ulk3, Beclin-1 and LC3b mRNA were measured by qRT-PCR. The relative ratios of Ulk3, Beclin-1 and LC3b mRNA ΔCT values between CTL and H2O2-treated cells are presented as means±SD (n=3) *P ≤ 0.05, **P ≤ 0.01.
Fig. 8.
Activation of p38 MAPKα mediates the induction of p21 by H2O2. WI38 cells were treated as described in Fig. 7 legend. Levels of p21 were determined by Western blot. (A) A representative p21 Western blot image is shown. The β-actin blot is included as a loading control. (B) The relative ratios of p21 optical densities between CTL and the H2O2-treated cells are presented as means±SD (n=3). **P ≤ 0.01.
4. Discussion
Our results show that exposure of cells to oxidative stress induces not only senescence but also autophagy. More importantly, we found that autophagy can regulate the induction of senescence by ROS. Similar findings were also observed recently in the cells subjected to oncogenic stress (Young et al., 2009). These findings suggest that autophagy and senescence are common cellular responses to stress. They are intricately connected through mechanisms which have not been completely understood. One possible mechanism by which autophagy may regulate senescence induction is upregulation of p21 as shown in the present study, because it has been well established that p21 can act at the down-stream of p53 to mediate the induction of senescence by a variety of stress, particularly that induced by DNA damage (Macip et al., 2002; Passos et al., 2010). Interestingly, autophagy regulates p21 expression not at the level of transcription but post-transcriptionally, because we found that inhibition of autophagy by downregulating Agt5 reduced oxidative stress-induced increases in p21 protein but had no significant effect on the elevated expression of p21 mRNA induced by H2O2 treatment. Post-transcriptional regulation of IL6 and IL8 expression by autophagy was also observed in oncogenic stress-induced senescent cells (Young et al., 2009). However, the mechanisms whereby autophagy post-transcriptionally regulates p21 expression remain to be elucidated. In addition, it has yet to be determined whether senescence can also regulate the induction of autophagy by ROS.
It has been well established that autophagy is primarily regulated by the mTOR pathway (Kapahi et al., 2010). Inhibition of the mTOR pathway increases autophagy under various physiological and pathological conditions (Jung et al., 2010). Oncogenic stress induces autophagy also through downregulation of mTOR activity (Young et al., 2009). However, our studies suggest that oxidative stress induces autophagy in an mTOR-independent manner, as the levels of the downstream phosphorylated target of mTORC2 p-AKT (S473) (Zoncu et al., 2011) were not changed while these of mTORC1 p-p70S6K and p-4E-BP1 (Zoncu et al., 2011) exhibited mixed alterations after oxidative stress exposure. This suggestion is in agreement with the previous observations that ROS does not inhibit but instead activates the mTOR pathway (Blagosklonny, 2008). In addition, it was supported by our findings that oxidative stress induces autophagy in a p38 MAPKα-dependent manner because WI38 cells exposed to H2O2 exhibited increases in p38 MAPKα phosphorylation and inhibition of p38 MAPKα with SB, a specific p38 MAPKα inhibitor, reduced the expression of several Atg genes.
The role of p38 MAPKα in regulation of autophagy has been suggested previously. For example, it has been shown that various cachectic stimuli can increase the phosphorylation of p38 MAPKα in vivo and in vitro to induce cachectic muscle wasting. Inhibition of p38 MAPKα activity can attenuate myotube atrophy by inhibiting the expression of autophagy-related genes in vitro (McClung et al., 2010). However, activation of p38 MAPKα was also found to inhibit the constitutive autophagic activity by affecting the maturation of autophagosomes (Corcelle et al., 2007). Furthermore, in HEK293 cells, it was found that activation of p38 MAPKα can negatively regulate basal and starvation-induced autophagy through p38 MAPK-interacting proteins (Webber and Tooze, 2010). These findings suggest that p38 MAPKα may regulate autophagy in a cell context specific manner.
Activation of p38 MAPKα and induction of autophagy by H2O2 treatment is likely attributed to a sustained increase in intracellular production of ROS because it has been well established that ROS can activate p38 MAPKα and we have found that NAC can inhibit H2O2-induced autophagy. Activation of p38 MAPKα also mediates diverse stimuli-induced cellular senescence including that induced by oxidative stress (Iwasa et al., 2003). Therefore, our results suggest that autophagy and senescence may share a common pathway, e.g. the p38 MAPKα pathway, for their induction after exposure to oxidative stress. This suggestion is supported by our finding that inhibition of p38 MAPKα also reduced the expression of p21 that mediates the induction of senescence by ROS.
In summary, our studies provide significant new insights into the role of autophagy in oxidative stress-induced senescence. In addition, our results reveal some novel mechanisms by which oxidative stress augments autophagy. Considering that both autophagy and senescence are important cellular responses to oxidative stress and their dysregulation has been implicated in aging and cancer, our findings could help us to gain a better understanding of the pathogenesis of aging-related diseases and cancer.
Acknowledgments
This work was supported in part by the grant (30871097) from National Natural Science Foundation of China to Dr. Lingbo Liu and the grants (CA122023 and AI080421) from National Institute of Health of US to Dr. Daohong Zhou.
Abbreviations
- ROS
reactive oxygen species
- p38MAPK
p38 mitogen-activated protein kinase
- mTOR
mammalian target of rapamycin
- Atg
autophagy protein
References
- Azad MB, Chen Y, Gibson SB. Regulation of autophagy by reactive oxygen species (ROS): implications for cancer progression and treatment. Antioxid Redox Signal. 2009;11:777–790. doi: 10.1089/ars.2008.2270. [DOI] [PubMed] [Google Scholar]
- Blagosklonny MV. Aging: ROS or TOR. Cell Cycle. 2008;7:3344–3354. doi: 10.4161/cc.7.21.6965. [DOI] [PubMed] [Google Scholar]
- Carter WO, Narayanan PK, Robinson JP. Intracellular hydrogen peroxide and superoxide anion detection in endothelial cells. J Leukoc Biol. 1994;55:253. doi: 10.1002/jlb.55.2.253. [DOI] [PubMed] [Google Scholar]
- Chen QM. Replicative senescence and oxidant-induced premature senescence. Beyond the control of cell cycle checkpoints. Ann N Y Acad Sci. 2000;908:111–125. doi: 10.1111/j.1749-6632.2000.tb06640.x. [DOI] [PubMed] [Google Scholar]
- Chen Q, Ames BN. Senescence-like growth arrest induced by hydrogen peroxide in human diploid fibroblast F65 cells. Proc Natl Acad Sci U S A. 1994;91:4130–4134. doi: 10.1073/pnas.91.10.4130. [DOI] [PMC free article] [PubMed] [Google Scholar]
- Chen Y, McMillan-Ward E, Kong J, Israels SJ, Gibson SB. Oxidative stress induces autophagic cell death independent of apoptosis in transformed and cancer cells. Cell Death Differ. 2007;15:171–182. doi: 10.1038/sj.cdd.4402233. [DOI] [PubMed] [Google Scholar]
- Corcelle E, Djerbi N, Mari M, Nebout M, Fiorini C, Fenichel P. Control of the autophagy maturation step by the MAPK ERK and p38: lessons from environmental carcinogens. Autophagy. 2007;3:57–59. doi: 10.4161/auto.3424. [DOI] [PubMed] [Google Scholar]
- Cuervo AM, Bergamini E, Brunk UT, Droge W, Ffrench M, Terman A. Autophagy and aging: the importance of maintaining “clean” cells. Autophagy. 2005;1:131–140. doi: 10.4161/auto.1.3.2017. [DOI] [PubMed] [Google Scholar]
- Dewaele M, Maes H, Agostinis P. ROS-mediated mechanisms of autophagy stimulation and their relevance in cancer therapy. Autophagy. 2010;6:838–854. doi: 10.4161/auto.6.7.12113. [DOI] [PubMed] [Google Scholar]
- Donati A, Cavallini G, Paradiso C, Vittorini S, Pollera M, Gori Z. Age-related changes in the autophagic proteolysis of rat isolated liver cells: effects of antiaging dietary restrictions. J Gerontol A Biol Sci Med Sci. 2001;56:B375–B383. doi: 10.1093/gerona/56.9.b375. [DOI] [PubMed] [Google Scholar]
- Essick EE, Sam F. Oxidative stress and autophagy in cardiac disease, neurological disorders, aging and cancer. Oxid Med Cell Longev. 2010;3:168–177. doi: 10.4161/oxim.3.3.2. [DOI] [PMC free article] [PubMed] [Google Scholar]
- Iwasa H, Han J, Ishikawa F. Mitogen-activated protein kinase p38 defines the common senescence-signalling pathway. Genes Cells. 2003;8:131–144. doi: 10.1046/j.1365-2443.2003.00620.x. [DOI] [PubMed] [Google Scholar]
- Jung CH, Ro SH, Cao J, Otto NM, Kim DH. mTOR regulation of autophagy. FEBS Lett. 2010;584:1287–1295. doi: 10.1016/j.febslet.2010.01.017. [DOI] [PMC free article] [PubMed] [Google Scholar]
- Kapahi P, Chen D, Rogers AN, Katewa SD, Li PW, Thomas EL. With TOR, less is more: a key role for the conserved nutrient-sensing TOR pathway in aging. Cell Metab. 2010;11:453–465. doi: 10.1016/j.cmet.2010.05.001. [DOI] [PMC free article] [PubMed] [Google Scholar]
- Klionsky DJ, Cuervo AM, Seglen PO. Methods for monitoring autophagy from yeast to human. Autophagy. 2007;3:181–206. doi: 10.4161/auto.3678. [DOI] [PubMed] [Google Scholar]
- Klionsky DJ, Abeliovich H, Agostinis P, Agrawal DK, Aliev G, Askew DS. Guidelines for the use and interpretation of assays for monitoring autophagy in higher eukaryotes. Autophagy. 2008;4:151–175. doi: 10.4161/auto.5338. [DOI] [PMC free article] [PubMed] [Google Scholar]
- Lu T, Finkel T. Free radicals and senescence. Exp Cell Res. 2008;314:1918–1922. doi: 10.1016/j.yexcr.2008.01.011. [DOI] [PMC free article] [PubMed] [Google Scholar]
- Macip S, Igarashi M, Fang L, Chen A, Pan ZQ, Lee SW. Inhibition of p21-mediated ROS accumulation can rescue p21-induced senescence. EMBO J. 2002;21:2180–2188. doi: 10.1093/emboj/21.9.2180. [DOI] [PMC free article] [PubMed] [Google Scholar]
- Marks DC, Belov L, Davey MW, Davey RA, Kidman AD. The MTT cell viability assay for cytotoxicity testing in multidrug-resistant human leukemic cells. Leuk Res. 1992;16:1165–1173. doi: 10.1016/0145-2126(92)90114-m. [DOI] [PubMed] [Google Scholar]
- Maruyama T, Farina A, Dey A, Cheong JH, Bermudez VP, Tamura T. A mammalian bromodomain protein, Brd4, interacts with replication factor C and inhibits progression to S phase. Mol Cell Biol. 2002;22:6509. doi: 10.1128/MCB.22.18.6509-6520.2002. [DOI] [PMC free article] [PubMed] [Google Scholar]
- McClung JM, Judge AR, Powers SK, Yan Z. p38 MAPK links oxidative stress to autophagy-related gene expression in cachectic muscle wasting. Am J Physiol Cell Physiol. 2010;298:C542–C549. doi: 10.1152/ajpcell.00192.2009. [DOI] [PMC free article] [PubMed] [Google Scholar]
- Mizushima N, Levine B, Cuervo AM, Klionsky DJ. Autophagy fights disease through cellular self-digestion. Nature. 2008;451:1069–1075. doi: 10.1038/nature06639. [DOI] [PMC free article] [PubMed] [Google Scholar]
- Passos JF, Nelson G, Wang C, Richter T, Simillion C, Proctor CJ. Feedback between p21 and reactive oxygen production is necessary for cell senescence. Mol Syst Biol. 2010;6:347. doi: 10.1038/msb.2010.5. [DOI] [PMC free article] [PubMed] [Google Scholar]
- Scherz-Shouval R, Elazar Z. ROS, mitochondria and the regulation of autophagy. Trends Cell Biol. 2007;17:422–427. doi: 10.1016/j.tcb.2007.07.009. [DOI] [PubMed] [Google Scholar]
- Straface E, Vona R, Ascione B, Matarrese P, Strudthoff T, Franconi F. Single exposure of human fibroblasts (WI-38) to a sub-cytotoxic dose of UVB induces premature senescence. FEBS Lett. 2007;581:4342–4348. doi: 10.1016/j.febslet.2007.08.006. [DOI] [PubMed] [Google Scholar]
- Toussaint O, Medrano EE, von Zglinicki T. Cellular and molecular mechanisms of stress-induced premature senescence (SIPS) of human diploid fibroblasts and melanocytes. Exp Gerontol. 2000;35:927–945. doi: 10.1016/s0531-5565(00)00180-7. [DOI] [PubMed] [Google Scholar]
- Wang Y, Meng A, Zhou D. Inhibition of phosphatidylinostol 3-kinase uncouples H2O2-induced senescent phenotype and cell cycle arrest in normal human diploid fibroblasts. Exp Cell Res. 2004;298:188–196. doi: 10.1016/j.yexcr.2004.04.012. [DOI] [PubMed] [Google Scholar]
- Wang Y, Schulte BA, LaRue AC, Ogawa M, Zhou D. Total body irradiation selectively induces murine hematopoietic stem cell senescence. Blood. 2006;107:358–366. doi: 10.1182/blood-2005-04-1418. [DOI] [PMC free article] [PubMed] [Google Scholar]
- Webber JL, Tooze SA. Coordinated regulation of autophagy by p38alpha MAPK through mAtg9 and p38IP. EMBO J. 2010;29:27–40. doi: 10.1038/emboj.2009.321. [DOI] [PMC free article] [PubMed] [Google Scholar]
- Young AR, Narita M, Ferreira M, Kirschner K, Sadaie M, Darot JF. Autophagy mediates the mitotic senescence transition. Genes Dev. 2009;23:798–803. doi: 10.1101/gad.519709. [DOI] [PMC free article] [PubMed] [Google Scholar]
- Zoncu R, Efeyan A, Sabatini DM. mTOR: from growth signal integration to cancer, diabetes and ageing. Nat Rev Mol Cell Biol. 2011;12:21–35. doi: 10.1038/nrm3025. [DOI] [PMC free article] [PubMed] [Google Scholar]


