Abstract
Slip-induced falls in gait often have devastating consequences. The purposes of this study were 1) to select the determinants that can best discriminate the outcomes (recoveries or falls) of an unannounced slip induced in gait (and to find their corresponding threshold, i.e., the limits of recovery, that can clearly separate these two outcomes), and 2) to verify these results in a subset of repeated slip trials. Based on the data collected from 69 young subjects during a slip induced in gait, nine different ways of combining the center of mass (COM) stability, the hip height, and its vertical velocity were investigated with the aid of logistic regression. The results revealed that the COM stability (s) and limb support (represented by the quotient of hip vertical velocity and hip height, Ship) recorded at the instant immediately prior to the recovery step touchdown were sufficiently sensitive to account for all (100%) variance in falls, and specific enough to account for nearly all (98.3%) variability in recoveries. This boundary (Ship = -0.22s -0.25), which quantifies the risk of falls in the stability-limb support quotient (s-Ship) domain, was fully verified using 76 second- and third-slip trials with classification of falls at 100% and recoveries at 98.6%. The severity of an actual fall is likely to be greater further below the boundary, while the likelihood of a fall diminishes above it. Finally, the slope of the boundary also indicates the tradeoff between the stability and limb support, whereby high stability can compensate for the insufficiency in limb support, or vice versa.
Keywords: gait fall risk, fall prevention, threshold, limb support quotient, stability
INTRODUCTION
Falls are a major cause of injury in older adults (Kannus et al., 2005). Falls initiated by slip account for about 25% of all falls (Luukinen et al., 2000). Accurate understanding of the causes of falls and assessing the risk of falls are critical to reducing the incidence of falls. As illustrated in our previous research, both center of mass (COM) stability and limb support against gravity play critical role in determining a fall during slip in gait. It is still unclear, however, whether these two factors or their combinations can quantify the boundary (i.e. the limits of recovery) that can clearly separate the falls from recoveries.
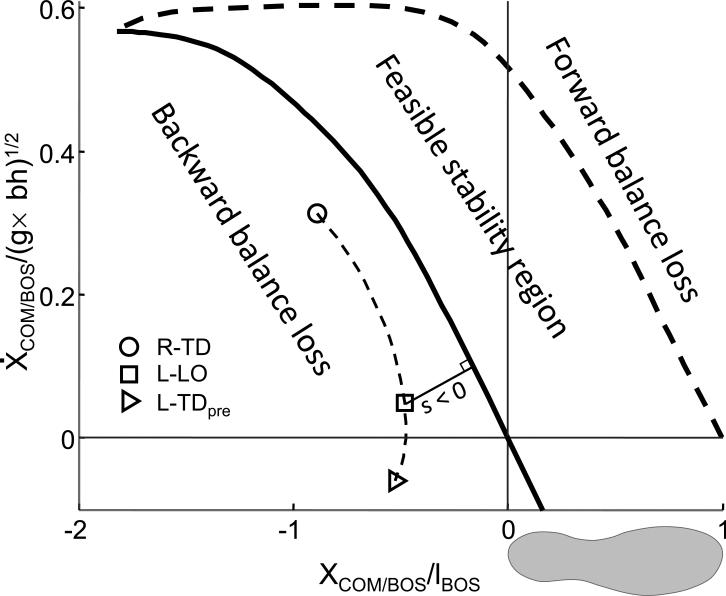
At a global level, the failure in the control of a person's COM stability may cause falls. The limits of stability (thick line in Fig. 1), which differentiate backward balance loss and no balance loss in the COM state space (i.e., its position and velocity), have been recently established (Pai and Iqbal, 1999; Pai and Patton, 1997; Yang et al., 2007; Yang et al., 2008). This stability measure could accurately predict that a backward balance loss must occur when COM motion state locates below the limits of stability (Bhatt and Pai, 2008b; Pai, 2003). Subsequently, however, a recovery step can often rapidly reverse slip-induced instability, and avert an actual falls. Therefore, while instability leads to falling, it cannot in itself fully account for falls (Yang et al., 2008). The limits of recovery against risk of falls are yet to be established.
Fig. 1.
Schematic illustration of the stability measurement (s), in which a representative trajectory (the thin dashed line) depicts the center of mass (COM) motion state (i.e., the x-coordinates represents the COM anteroposterior position and the positive y-coordinates indicates its forward velocity) from right (slipping) foot touchdown (R-TD), through left (recovery) foot liftoff (L-LO), to the instant immediately prior to its touchdown (L-TDpre) in a sudden and unrehearsed (novel) slip. The feasible stability region is enclosed by two boundaries: the limits of stability against backward balance loss (the thick solid line) and those against forward balance loss (the thick dashed line). The thin solid line indicates the magnitude of the instantaneous COM stability, which was defined as the shortest distance from the given COM motion state at that instant to the limits of stability against backward balance loss. When the instantaneous COM motion state is below/above the limits, the stability value is negative/positive, respectively. Also shown is the computer predicted feasible stability region under a slip condition in the COM motion state space. Position and velocity of the COM relative to the base of support (BOS) are dimensionless variables expressed as a fraction of lBOS and , respectively, where lBOS represents the foot length, g is gravitational acceleration, and bh the body height.
Besides controlling one's stability, providing sufficient limb support to prevent limb collapse (in the vertical direction) is another important factor (or determinant) to avoid a fall (Pavol and Pai, 2007; Pijnappels et al., 2008; Yang et al., 2009). The hip height correlates highly with the amount of the vertical impulse generated by the stance limb(s), and hence has been used to approximate and characterize subject's vertical limb support against gravity (Yang et al., 2009). It has been reported that when instability combines with poor limb support at the instant prior to the recovery step touchdown some 300 ms following the slip onset, a subsequent fall incidence becomes nearly (88.9%) inevitable ~500 ms later (Yang et al., 2009). Therefore, limb support must also play an essential role.
The purposes of this study were 1) to select the determinants that can best differentiate the outcomes (recoveries or falls) of an unannounced slip induced in gait (and to find their corresponding threshold, i.e., the limits of recovery, that can clearly separate these two outcomes), and 2) to verify these results in a subset of repeated-slip trials. By combining the COM stability and the hip height and its vertical velocity, nine different ways of determining falls were investigated. We expected that one of these combinations and its corresponding limits of recovery could fully account for the outcome of gait-slip.
METHODS
2.1 Subjects
Data from three sets of gait-slip experiments were pooled for this study (Bhatt and Pai, 2008a; Bhatt and Pai, 2008b; Bhatt and Pai, 2009). Sixty-nine subjects’ data [35 males, mean ± SD age: 25.8 ± 4.5 years; height: 168.4 ± 8.4 cm; mass: 63.8 ± 11.7 kg] were included in the present study (Table 1). All of them gave informed consent participated in the experiments approved by Institutional Review Board. In this first attempt, only single-step fallers’ data were analyzed due to small sample size available in each category of those who took two or three steps prior to a fall (Table 1).
Table 1.
The number of subjects and slip trials used for deriving and verifying the limits of recovery.
| Trials | Original Studiesa | Present Study | Outcome | |||
|---|---|---|---|---|---|---|
| Number of Subjects | Number of Samples | Number of Subjects | Number of Samples | Fall | Recovery | |
| 1st e | 84 | 75b | 69c | 69 | 11 | 58 |
| 2nd and 3rd f | 39 | 78 | 38d | 76 | 7 | 69 |
Data from (Bhatt and Pai, 2008a; Bhatt and Pai, 2008b; Bhatt and Pai, 2009).
After excluding 4 trials with technical errors (e.g., platforms trigger problem and loss of markers) and 5 trials identified as harness-assistance. A trial is identified as a harness-assistance if the peak load cell force is never greater than 30% body weight and the peak value of the moving average load cell force is not less than 4.5% body weight over any 1-second period after the slip onset.
After excluding 4 two-step falls and 2 three-step falls. The number of recovery step is determined as the number of the steps following the slip onset and before the instant when the load cell force reaches 30% body weight. A trial whereby the subject took more than one recovery steps would be categorized as a multiple-step fall.
After excluding a two-step faller.
Trials used to determine the boundary and the limits of recovery.
Trials used to verify the boundary.
2.2 Experimental protocol
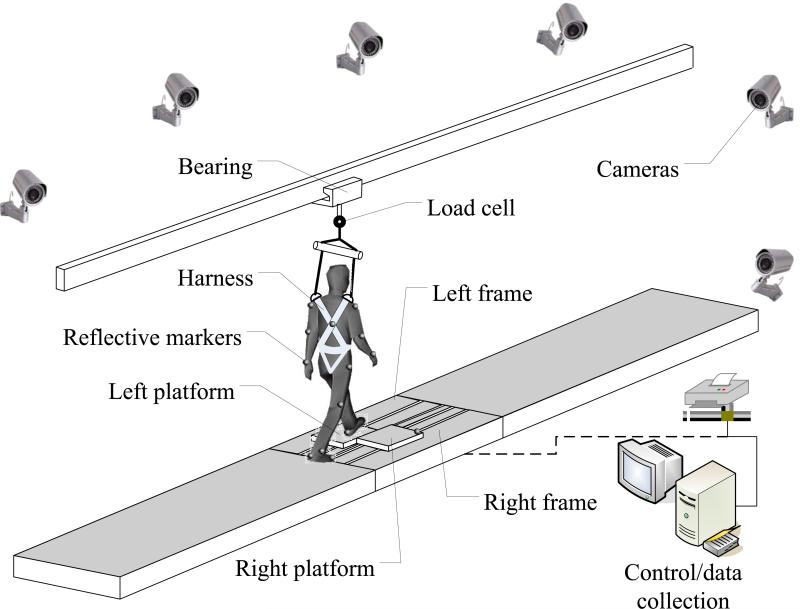
The experimental protocol and setup were the same across all experiments. Unexpected slip perturbations were induced as subjects walked along a 7-m walkway in which a sliding device was embedded (Fig. 2). The device consisted of a side-by-side pair of low-friction, passively movable platforms each mounted upon a metal frame supported by two individual force plates (AMTI, Newton, MA) in order to record the ground reaction force (Yang and Pai, 2007). The platforms were free to slide up to 1.5 m on the right and 0.9 m on the left forward upon a computer-controlled release of their locking mechanisms. A harness, connected by shock-absorbing ropes at the shoulders and waist to an overhead beam, was employed to protect subjects while imposing negligible constraint to their movement (Fig. 2) (Yang and Pai, 2011). A load cell measured the force exerted on the ropes. Full body kinematic data from 28 retro-reflective markers placed on the subjects’ body and platforms were gathered using an 8-camera motion capture system (Motion Analysis Corporation, Santa Rosa, CA) synchronized with the force plates.
Fig. 2.
Schematic illustration of the experimental setup for inducing unannounced slips in gait. A slip is induced by releasing two low-friction movable platforms. Each of the two moveable platforms is mounted on a frame with four linear bearings, and the frame was bolted to two force plates to measure the ground reaction force. The low-profile movable platforms (and the force plates beneath, not shown here) were embedded in a 7-m walkway with decoy platforms (not shown) to reduce its visibility. The right- and left- side moveable platforms can be unlocked electronically after the landing of the corresponding foot. A set of 28 light-reflective markers were placed on bilateral upper and lower extremities, torso, and platforms. Their spatial positions were captured by an 8-camera motion capture system. The subjects were required to wear a safety harness which is individually adjusted to prevent a fall to the ground. A load cell was used to measure the force exerted on the harness.
Subjects were informed that they would be performing normal walking initially and would experience simulated slip later without knowing when, where, and how that would happen. They were only told to try to recover their balance on any slip incidence and then to continue walking. After about 10 regular walking trials, the right platform was always firstly released when right foot contacts it. The left platform would then be released once subjects landed left foot on it during the slip trial. The data from these subjects were used to select the best determinates and to find their corresponding limits of recovery. In addition, 38 of these 69 subjects took repeated-slip trials, and their data were used for verification. Only the second and the third slip trials of those 38 subjects were used, because there were no falls recorded thereafter in a total of 24 slips (Bhatt and Pai, 2008b).
2.3 Outcome and events
Fall and recovery were two outcomes analyzed in the present study. Slip outcomes were classified as falls when the peak force exerted on the load cell exceeded 30% body weight and were unambiguously confirmed via visual inspection of recorded video (Yang and Pai, 2011). A recovery was identified when the moving average force on the harness never exceeded 4.5% body weight over any 1-second period after the slip onset (Yang and Pai, 2011). Of the 69 subjects, 11 (16%) fell. Of those 38 subjects, there were additional 7 (9%) trials in which a fall occurred.
For each slip, three essential events were identified. They were slipping (right) foot touchdown (R-TD), the recovery (left) foot liftoff (L-LO), and the instant immediately prior to the recovery foot touchdown (L-TDpre), which is just one time frame (1/120 of a second) before the touchdown. At that moment the recovery foot was not in contact with the ground, stability most severely deteriorated, and hence the best instant to differentiate falls from recoveries. By the time when it landed behind the slipping foot at touchdown, the base of support (BOS) abruptly extended posteriorly, and the landing helped the restoration of stability in this direction. The difference between these two time frames must therefore be reflected in the selection of the reference point of the BOS, which changes from the rear edge of the right foot during slipping to that of the left after the landing. All time events were determined from the vertical component of the force plate data and verified against the foot kinematics. When the vertical force is greater/less than 10 N, the touchdown/liftoff event occurs (Ghoussayni et al., 2004).
2.4 Data analysis
Locations of joint centers, heels, and toes were computed from the filtered marker positions. The body COM kinematics was computed using gender-dependent segmental inertial parameters (de Leva, 1996). The COM stability, s, was evaluated by calculating the shortest distance from the instantaneous COM motion state to the computer-derived limits against backward balance loss (thin line in Fig. 1) (Yang et al., 2008). The two components of the COM motion state, i.e. its position and velocity were calculated relative to the BOS and normalized by foot length (lBOS) and respectively, where g is the gravitational acceleration and bh the body height (Fig. 1).
The hip vertical motion (the hip height and its vertical velocity) that characterize the limb support (Pavol and Pai, 2007; Yang et al., 2009) were also investigated. The hip height, Zhip, was defined as the vertical distance of the bilateral hip midpoint to the surface of the platform. Its vertical velocity, Żhip, was attained as the first order differentiation of the hip height with respect to time. Its positive direction is upward. Zhip and Żhip were respectively normalized to bh and . Considering that faller's hips went lower at a faster velocity than those who recovered (Yang et al., 2009), we introduced a new variable called limb support quotient: Ship=Żhip/Zhip. Further analysis would determine whether such quotient was able to magnify the difference between falls and recoveries.
2.5 Statistics
The selection of the best variables and the subsequent determination of the recovery limits were firstly conducted based on the data from the first slip (n = 69, Table 1). The verification of the recovery limits was performed by comparing the actual and predicted slip outcomes of the repeated trials (n = 76, Table 1). To identify the best determinants of the slip outcome, we calculated the classification accuracy of the slip outcome using logistic regression with COM stability, limb support, or their combinations as independent determinant at each of the 3 events described above. The independent determinants included four single determinants (i.e. s, Zhip, Żhip, and Ship) and their five combinations (i.e. s with Zhip , s with Żhip, Zhip with Żhip, s with Zhip and Żhip, and s with Ship). In total, there were 27 possible sets of variables [i.e., (4 single + 5 combinations) × 3 events = 27]. To confirm the results obtained from these individual models, we then entered all 27 sets into a forward stepwise logistic regression to calculate the classification accuracy. The likelihood ratio test with a cutoff probability of 0.05 was used for variable entry.
The probability of falls was calculated based on the logistic regression equation, in the form of . The variables in the set that had the greatest classification accuracy were the best determinants. The regression equation coefficients of the recovery limits that differentiate falls from recoveries in the selected determinants’ domain could be derived as by assigning p = 0.5 in above regression equation. The equation was then verified by comparing the pre-determined outcomes with the ones decided by this boundary while using all repeated-slip trials. All statistics were performed using SPSS 17.0 (Chicago, IL), and a significance level of 0.05 was used throughout.
RESULTS
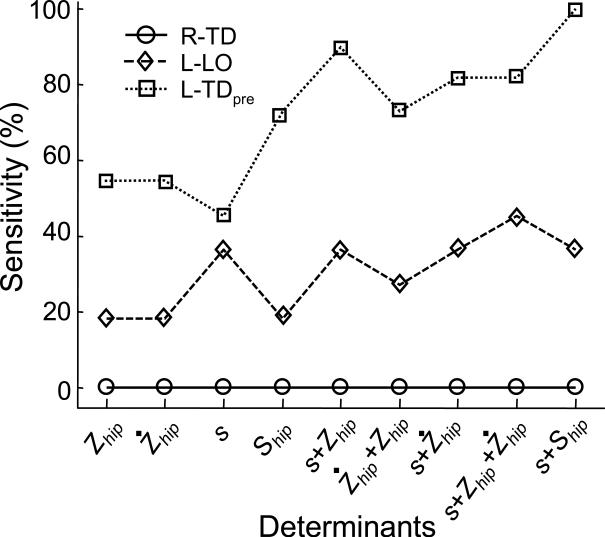
No between-group differences were detectable in all four variables at R-TD (Table 2). Early on at L-LO, the fallers were more unstable (p < 0.05), with lower hip height (p < 0.05), faster downward hip vertical velocity (p < 0.01), and smaller limb support quotient (p < 0.01) than those who recovered. Stability, hip height, hip vertical velocity, and limb support quotient continued to deteriorate during single-stance phase to their lowest point at L-TDpre (p < 0.001 for all variables) (Table 2, Fig. 3). The instant of L-TDpre was the most important temporal moment of three events to determine the slip outcome (Fig. 4). For every determinant, the classification accuracy of the slip outcome at L-TDpre was the highest of the three events. For example, the COM stability at R-TD, L-LO, and L-TDpre can account for 0%, 36.4%, and 45.5% of variance in falls, respectively (Fig. 4).
Table 2.
Comparisons of the COM stability (s), the hip height (Zhip), the hip vertical velocity (Żhip), and the limb support quotient (Ship = Żhip / Zhip) between falls (n = 11) and recoveries (n = 58) at slipping foot touchdown (R-TD), recovery foot liftoff (L-LO), and the instant immediately prior to the recovery foot touchdown (L-TDpre) upon the first slip. The Zhip was measured as the vertical distance from the movable platform to the center of the hip joints and normalized to body height, bh. The Żhip was calculated as the first order differentiation of Zhip with respect to the time. Upward is its positive direction. The Żhip was normalized to , where g is gravitational acceleration.
| R-TD | L-LO | L-TDpre | ||||
|---|---|---|---|---|---|---|
| Fall | Recovery | Fall | Recovery | Fall | Recovery | |
| s | -0.146 (0.044) | -0.155 (0.048) | -0.302* (0.128) | -0.218 (0.100) | -0.645*** (0.333) | -0.330 (0.152) |
| Zhip | 0.486 (0.014) | 0.493 (0.016) | 0.489* (0.013) | 0.499 (0.014) | 0.471*** (0.019) | 0.495 (0.015) |
| Ż hip | -0.022 (0.009) | -0.019 (0.008) | 0.002** (0.033) | 0.013 (0.011) | -0.071*** (0.029) | -0.027 (0.018) |
| Ship | -0.045 (0.019) | -0.038 (0.017) | -0.003** (0.066) | 0.026 (0.023) | -0.151*** (0.061) | -0.056 (0.037) |
p < 0.05 vs. recovery group
p < 0.01 vs. recovery group
p < 0.001 vs. recovery group.
Fig. 3.
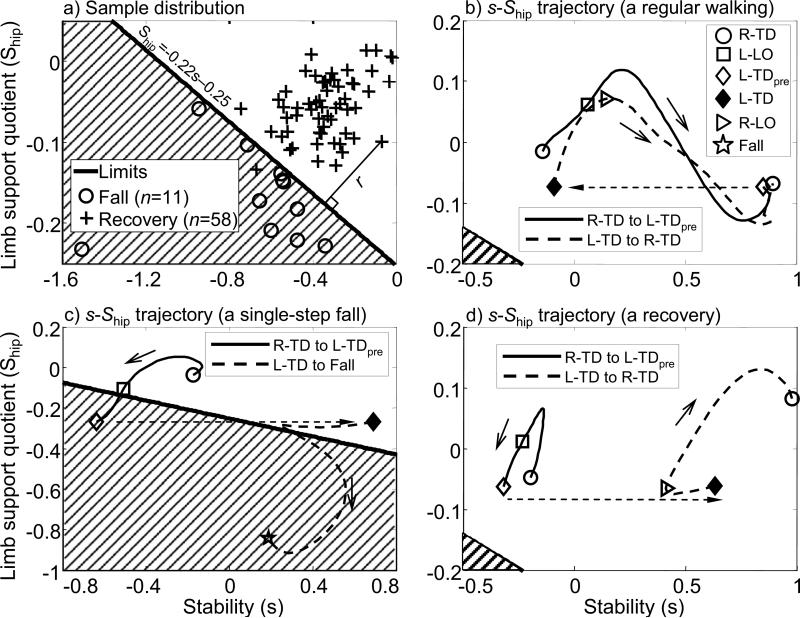
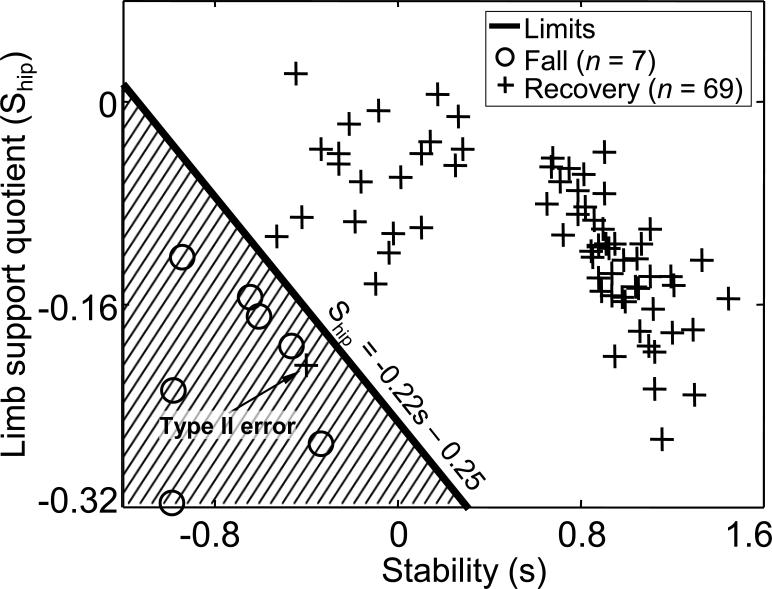
(a) Relationship between the center of mass (COM) stability (s, x-coordinate), the corresponding limb support quotient (Ship, y-coordinate) at the instant immediately before the recovery step touchdown, and the outcome of the first slip induced during gait. Individuals within the shaded area would be classified as likely to fall by the logistic regression model: (p < 0.05 for all model coefficients). The limits of recovery (the thick solid line) are derived based on logistic regression equation by assigning p(fall) = 0.5 to the above regression equation. Please also see Fig. 5. It is Ship = -0.22s - 0.25. The boundary correctly classified 100% of fall incidences. The thin line illustrates an example of the shortest distance from the instantaneous s-Ship state to the limits against falls. (b) A typical s-Ship trajectory from right foot touchdown (R-TD), through left foot liftoff (L-LO), the instant immediately before left foot touchdown (L-TDpre), left foot touchdown (L-TD), right foot liftoff (R-LO), to next right foot touchdown (R-TD) for normal walking. (c) A representative s-Ship trajectory from slipping foot touchdown (R-TD), through L-LO, L-TDpre, L-TD, to harness arrest (fall, star) for falls. (d) A typical s-Ship trajectory from R-TD immediately before slip onset to next R-TD after a recovery. The small solid arrows indicate the direction of the trajectories. The dashed arrows represent the discontinuation of the s-Ship trajectories when switching the base of support.
Fig. 4.
The sensitivity (%) of classifying falls (n = 11) based on the center of mass (COM) stability (s), the hip height ( Zhip ), the hip vertical velocity (Żhip), the limb support quotient Ship = Żhip/Zhip, and their combinations including: s with Zhip, s with Żhip, s with Zhip and Żhip, and s with Ship at right foot touchdown (R-TD) prior to slip onset, recovery foot liftoff (L-LO), and the instant immediately prior to the recovery foot touchdown (L-TDpre) on the first slip.
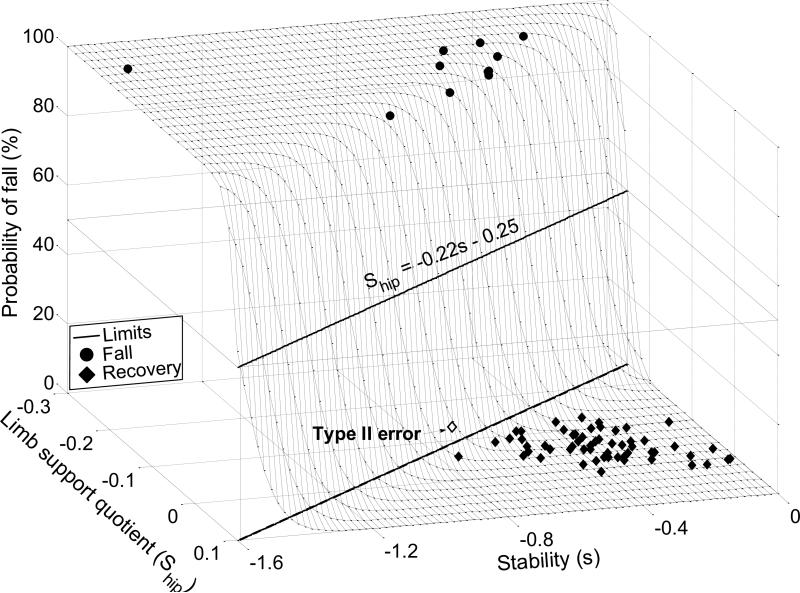
The combination of COM stability, s, and the limb support quotient, Ship, achieved the highest (100%) sensitivity among all determinants at the instant of L-TDpre (Table 3 and Fig. 4). When 27 sets of variables were entered in the stepwise logistic regression (Fig. 4), the results also confirmed s and Ship recorded at L-TDpre to be the best determinants in the following expression: (p < 0.05 for all coefficients, R2 = 0.902, log-likelihood = 8.93, Fig. 5).
Table 3.
Logistic regression coefficients for the determination model using the COM stability (s) and limb support quotient (Ship) at the instant immediately prior to the recovery foot touchdown.
| Variable | β value | SDa | ORb | 95% CIc | p value |
|---|---|---|---|---|---|
| s | -20.008 | 0.224 | 0.006 | (0, 0.469) | 0.037 |
| S hip | -90.354 | 0.057 | 0.011 | (0, 0.756) | 0.022 |
| Constant | -22.797 | 0.023 |
SD: Standard deviation
OR: Odds ratio. The odds ratio indicates the factor by which the odds of fall change for a decrease of 1SD in the variable across all subjects
CI: Confidence interval.
Fig. 5.
Surface plot of the logistic regression that can best predict the likelihood of falls following a sudden, unannounced slip during gait as function of its two best determinants: the stability (s) and limb support quotient (Ship) at the instant immediately prior to the fall recovery step touchdown. The logistic regression model is (p < 0.05 for all model coefficients). Also shown is the boundary (the outline of the limits of recovery) formed at the middle (50%) bisecting the surface. The projection of the boundary on the bottom plane (i.e. the s-Ship domain) is also demonstrated, which is the boundary demonstrated in Fig. 3. One recovery trial (the open diamond) was wrongfully classified as a fall by the limits as a type II or β error.
The boundary in the s-Ship space (Ship = -0.22s - 0.25) was able to distinguish falls from the recoveries with high classification accuracy (Figs. 3a and 5). All 11 fallers’ s-Ship was below the boundary (Fig. 3a and c, Fig. 5), and hence the sensitivity of the boundary in classifying falls was 100%. In 57 of 58 recovery trials on the first slip, subjects’ s- Ship at L-TDpre was above the boundary (Fig. 3a and d). Only one of 58 (1.7%) recovery trials encountered a type II error (Fig. 5). The specificity of this model is 98.3% for the first slip. Finally, the verification results indicated that the above boundary of the recovery limits had high sensitivity to account for all (7 out of 7) falls, and also high specificity to distinguish nearly all (68 out of 69) recoveries (Fig. 6).
Fig. 6.
Before recovery foot touchdown on the second and third slip trials (Table 1), the distribution of 38 subjects’ instantaneous state of a fall (or recovery) in the domain of the center of mass (COM) stability (s, x-coordinate) and limb support quotient (Ship, y-coordinate). There were 7 falls and 69 recoveries. Also shown are the limits of recovery derived based on all first slip trials (Figs. 3a & 5). One recovery trial was wrongfully classified as a fall by the limits as a type II or β error.
DISCUSSION
The results supported the hypothesis that by including the quotient of the hip height and its vertical velocity during a slip, it is possible to rather accurately differentiate the falls (account for 100% of the variance in this case) from recoveries (account for 98% of the variance) with an overall classification accuracy of 99% (Figs. 3a and 6). A different combination, the COM stability and the hip height, could only reach a sensitivity of 88.9% (Yang et al., 2009). Further, these findings indicate that none of the individual measurements or their combinations recorded during volitional gait taken prior to slip onset could accurately account for the subsequent falls. In other words, these young adults’ regular gait pattern did not appear to have predisposed them to the risk of falls upon a sudden and unrehearsed slip.
Much like previously demonstrated, that simultaneous consideration of the COM velocity improves the COM position's ability to determine loss of balance (Pai et al., 1998), limb support quotient (Ship) was more accurate than merely using the hip height. Notably, Ship was able to determine 73% fall incidence compared to 55% fall incidence from hip height alone ( Zhip ). It has been suggested that in comparison to body position and acceleration information, velocity is the most critical sensory information used to stabilize posture in quiet standing (Jeka et al., 2004). The findings of the present study would lend support to the importance of the simultaneous consideration of position and velocity (the motion state) of the COM (in horizontal) and the hip (in vertical direction) as the key determinants differentiating falls from recoveries.
Theoretically, a quantitative risk-determination model should not only yield a yes/no answer, but also provide an estimate of the severity of the risk. The limits of recovery and its boundary derived in the present study provide an insight into not only the causes for recovery or fall, but also the severity of such risks, as measured by the shortest distance to the boundary in this s-Ship space (Fig. 3a). A person's instantaneous values of these two variables (stability and limb support quotient) that locate further below the boundary would indicate a greater severity of an actual fall (Figs 3 & 6). This could require greater effort to restore stability and to provide sufficient limb support quotient than that person could generate in order to retard a fall and reverse the hip descent. It could also mean that the impact of the actual fall that happens a few hundred milliseconds later would be more severe. Conversely, a greater distance above the boundary indicates a further diminished likelihood of an actual fall (Figs. 3 & 6).
The findings of the present study revealed that, at least in this sample of young adults, unperturbed gait pattern may yield little clue as to who would later fall following an unannounced slip. Among the single-step fallers, the clue started to emerge near the recovery step liftoff. During the single-stance phase, stability and limb support both deteriorated progressively and severely, and the corresponding differences between the falls and the recoveries also increased continuously and reaches the highest level in the end (Fig. 3c and d, Table 2). The “point-of-no-return” for the single-step fallers, if exists, may come during this single-stance phase within the first 35% of the entire duration from slip onset to harness arrest when for the first time the determinants can fully (100%) account for the subsequent falls (Fig. 4).
Our results indicated that slip outcome depended heavily upon one's reaction to a sudden and unrehearsed slip before reaching that “point-of-no-return”. Such results imply that volitional-performance-based balance assessment tools used routinely in the clinics for fall-risk assessment might have limited prognostic power. Variety of conventional tools of assessing fall risk have been developed mostly based on the measures of physical activity related to standing, volitional activities, or gait (Berg et al., 1992; Podsiadlo and Richardson, 1991; Shumway-Cook and Woollacott, 2001; Tinetti, 1986). Our previous results have identified that unperturbed activities have lower sensitivity in determining fall risk in younger adults (Yang et al., 2009). It is possible that regular walking of older adults or those with balance impairments can better reveal their future fall risk than young adults. Recent results indicated that volitional gait stability of healthy older adults can account for up to 69% of falls produced in laboratory (Bhatt et al., 2011), which is still less accurate than the reactive measure developed in this study.
This study uses an earlier event in a movement sequence to account for the final outcome of the performance. This is very different from the conventional falls predictors, such as the past history of falls (Stalenhoel et al., 2002) or Timed-Up-and-Go (Podsiadlo and Richardson, 1991). None of these tools evaluate a movement sequence of the response to perturbation that leads to either a recovery or an actual fall. On the other hand, the limits of recovery derived in the s-Ship domain explain the reason of slip-related falls (i.e. due to the excessive instability that coupled with inadequate limb support quotient). The limit of recovery actually quantifies the stability that must be provided in conjunction with an adequate amount of limb support at the same instant. This boundary also quantifies the tradeoff that may take place between the control of stability and limb support where a greater stability can compensate for an insufficiency in limb support (Fig. 3a). Therefore, it is more appropriate to view the limits of recovery as a causative model (explaining the subsequent outcomes) rather than predictive model (predicting the likelihood of future falls in this or other contexts).
The present study has limitations. The sample in this study came from young adults, and it is unclear whether the limits of recovery would be the same for older adults. It is possible that such limits are age dependent. It is also unknown if the limits of recovery derived here would be applicable to other situations such as during slips induced in sit-to-stand. Finally, the falls investigated in this study only included the single-step falls. It is noteworthy that most people (> 65%) only had the opportunity to take one step before the fall (Table 1). It is unknown if the current findings can be generalized to the multi-step falls. A sample size of 233 young adults would be needed to study 2-step falls and even more for 3-step fallers based on the power analysis of the present study.
In summary, the present study developed the recovery limits against slip-induced fall based on quantitative relationship between the COM stability and the person's ability to provide limb support. The limits of recovery establish the boundary that separates falls from recoveries in the domain of this pair of the best determinants.
Acknowledgements
This work was funded by NIH 2RO1-AG16727 and RO1-AG029616. The authors thank Drs. Debbie Espy and Ting-Yun Wang for assisting in data collection.
Footnotes
Publisher's Disclaimer: This is a PDF file of an unedited manuscript that has been accepted for publication. As a service to our customers we are providing this early version of the manuscript. The manuscript will undergo copyediting, typesetting, and review of the resulting proof before it is published in its final citable form. Please note that during the production process errors may be discovered which could affect the content, and all legal disclaimers that apply to the journal pertain.
Conflict of interest statement
None declared.
References
- Berg KO, Wood-Dauphinee SL, Williams JI, Maki B. Measuring balance in the elderly: validation of an instrument. Canadian Journal of Public Health. Revue Canadienne de Sante Publique. 1992;83(Supplement 2):S7–11. [PubMed] [Google Scholar]
- Bhatt T, Espy D, Yang F, Pai Y-C. Dynamic stability, clinical correlates, and prognosis of falls among community-dwelling older adults. Archives of Physical Medicine & Rehabilitation. 2011;92:799–805. doi: 10.1016/j.apmr.2010.12.032. [DOI] [PubMed] [Google Scholar]
- Bhatt T, Pai YC. Generalization of gait adaptation for fall prevention: from moveable platform to slippery floor. Journal of Neurophysiology. 2009;101:948–957. doi: 10.1152/jn.91004.2008. [DOI] [PMC free article] [PubMed] [Google Scholar]
- Bhatt T, Pai Y-C. Can observational training substitute motor training in preventing backward balance loss after an unexpected slip during walking? Journal of Neurophysiology. 2008a;99:843–852. doi: 10.1152/jn.00720.2007. [DOI] [PMC free article] [PubMed] [Google Scholar]
- Bhatt T, Pai Y-C. Immediate and latent interlimb transfer of gait stability adaptation following repeated exposure to slips. Journal of Motor Behavior. 2008b;40:380–390. doi: 10.3200/JMBR.40.5.380-390. [DOI] [PMC free article] [PubMed] [Google Scholar]
- de Leva P. Adjustments to Zatsiorsky-Seluyanov's segment inertia parameters. Journal of Biomechanics. 1996;29:1223–1230. doi: 10.1016/0021-9290(95)00178-6. [DOI] [PubMed] [Google Scholar]
- Ghoussayni S, Stevens C, Durham S, Ewins D. Assessment and validation of a simple automated method for the detection of gait events and intervals. Gait and Posture. 2004;20:266–272. doi: 10.1016/j.gaitpost.2003.10.001. [DOI] [PubMed] [Google Scholar]
- Jeka J, Kiemel T, Creath R, Horak FB, Peterka RJ. Controlling human upright posture: velocity information is more accurate than position or acceleration. Journal of Neurophysiology. 2004;92:2368–2379. doi: 10.1152/jn.00983.2003. [DOI] [PubMed] [Google Scholar]
- Kannus P, Parkkari J, Niemi S, Palvanen M. Fall-induced deaths among elderly people. American Journal of Public Health. 2005;95:422–424. doi: 10.2105/AJPH.2004.047779. [DOI] [PMC free article] [PubMed] [Google Scholar]
- Luukinen H, Herala M, Koski K, Honkanen R, Laippala P, Kivela SL. Fracture risk associated with a fall according to type of fall among the elderly. Osteoporosis International. 2000;11:631–634. doi: 10.1007/s001980070086. [DOI] [PubMed] [Google Scholar]
- Pai Y-C. Movement termination and stability in standing. Exercise and Sport Sciences Reviews. 2003;31:19–25. doi: 10.1097/00003677-200301000-00005. [DOI] [PubMed] [Google Scholar]
- Pai Y-C, Iqbal K. Simulated movement termination for balance recovery: Can movement strategies be sought to maintain stability even in the presence of slipping or forced sliding? Journal of Biomechanics. 1999;32:779–786. doi: 10.1016/s0021-9290(99)00074-3. [DOI] [PubMed] [Google Scholar]
- Pai Y-C, Patton J. Center of mass velocity-position predictions for balance control. Journal of Biomechanics. 1997;30:347–354. doi: 10.1016/s0021-9290(96)00165-0. [DOI] [PubMed] [Google Scholar]
- Pai Y-C, Rogers MW, Patton J, Cain TD, Hanke TA. Static versus dynamic predictions of protective stepping following waist-pull perturbations in young and older adults. Journal of Biomechanics. 1998;30:347–354. doi: 10.1016/s0021-9290(98)00124-9. [DOI] [PubMed] [Google Scholar]
- Pavol MJ, Pai Y-C. Deficient limb support is a major contributor to age differences in falling. Journal of Biomechanics. 2007;40:1318–1325. doi: 10.1016/j.jbiomech.2006.05.016. [DOI] [PMC free article] [PubMed] [Google Scholar]
- Pijnappels M, Reeves ND, Maganaris CN, van Dieen JH. Tripping without falling: lower limb strength, a limitation for balance recovery and a target for training in the elderly. Journal of Electromyography and Kinesiology. 2008;18:188–196. doi: 10.1016/j.jelekin.2007.06.004. [DOI] [PubMed] [Google Scholar]
- Podsiadlo D, Richardson S. The timed “up & go”: A test of basic functional mobility for frail elderly persons. Journal of American Geriatric Society. 1991;39:142–148. doi: 10.1111/j.1532-5415.1991.tb01616.x. [DOI] [PubMed] [Google Scholar]
- Shumway-Cook A, Woollacott MH. Normal postural control. In: Shumway-Cook A, Woollacott MH, editors. Motor Control Theory and Practical Applications. 2nd edition Williams & Wilkins; Baltimore: 2001. pp. 163–191. [Google Scholar]
- Stalenhoel PA, Diederiks JPM, Knottnerus JA, Kester ADM, Crebolder HFJM. A risk model for the prediction of recurrent falls in community-dwelling elderly: A prospective cohort study. Journal of Clinical Epidemiology. 2002;55:1088–1094. doi: 10.1016/s0895-4356(02)00502-4. [DOI] [PubMed] [Google Scholar]
- Tinetti ME. Performance-oriented assessment of mobility problems in elderly patients. Journal of the American Geriatric Society. 1986;34:119–126. doi: 10.1111/j.1532-5415.1986.tb05480.x. [DOI] [PubMed] [Google Scholar]
- Yang F, Anderson FC, Pai Y-C. Predicted threshold against backward balance loss in gait. Journal of Biomechanics. 2007;40:804–811. doi: 10.1016/j.jbiomech.2006.03.015. [DOI] [PMC free article] [PubMed] [Google Scholar]
- Yang F, Anderson FC, Pai Y-C. Predicted threshold against backward balance loss following a slip in gait. Journal of Biomechanics. 2008;41:1823–1831. doi: 10.1016/j.jbiomech.2008.04.005. [DOI] [PMC free article] [PubMed] [Google Scholar]
- Yang F, Bhatt T, Pai Y-C. Role of stability and limb support in recovery against a fall following a novel slip induced in different daily activities. Journal of Biomechanics. 2009;42:1903–1908. doi: 10.1016/j.jbiomech.2009.05.009. [DOI] [PMC free article] [PubMed] [Google Scholar]
- Yang F, Pai Y-C. Correction of the inertial effect resulting from a plate moving under low-friction conditions. Journal of Biomechanics. 2007;40:2723–2730. doi: 10.1016/j.jbiomech.2006.12.008. [DOI] [PMC free article] [PubMed] [Google Scholar]
- Yang F, Pai Y-C. Automatic recognition of falls in gait-slip training: Harness load cell based criteria. Journal of Biomechanics. 2011;44:2243–2249. doi: 10.1016/j.jbiomech.2011.05.039. [DOI] [PMC free article] [PubMed] [Google Scholar]


