Introduction
A clinician administers medications both seeking immediate benefits but also calculating the long-term effects of the medications on the course of the disease. It is this attempt to anticipate the effects of the drugs on the course of the disease that has created the most uncertainty and controversy in the field of Parkinson’s disease (PD) therapeutics. The challenge has been to disentangle symptomatic drug effects, long-term adverse effects and disease progression.
We have previously described a pharmacological interpretation of the effects of levodopa in PD [1]. That review focussed on the time course of motor effects within a dosing interval of minutes to hours and identified the pharmacological features of effects of levodopa that might distinguish the clinical patterns of stable and fluctuating response. In particular, we pointed out that the shorter equilibration half-life of levodopa in fluctuating patients was the most influential single parameter explaining the differing time course of response in these patient groups.
In the decade that has passed we have taken a longer term view of the response to levodopa and studied its evolution in cohorts of patients over several years [2–6]. This long-term approach has enabled us to identify and describe new features of the clinical pharmacology of levodopa in which we have relied heavily on appreciating the role of the passage of time on a longer time scale than the dosing interval. Our approach involves examining changes in the response to antiparkinsonian medications as well as progression of the disease as measured by clinical function over years.
Our aim here is to summarize these findings and propose a further level of integration of a model for levodopa pharmacodynamics in PD and discuss its implications for long-term treatment strategies and the evaluation of new treatments.
Disease progress and drug action – model-based thinking
The ability to describe and interpret observations of drug effects over long periods of time (years) can be formalized by quantitative models. One approach in clinical pharmacology is to define a drug response as the sum of two components – the progression of the disease and the action of the drug, both of which change over time.
| (1) |
This formulation requires that the variable used to describe the progression of the disease and to describe the action of the drug are one and the same, such as the Unified Parkinson’s Disease Rating Scale (UPDRS). Early attempts to introduce time into descriptions of clinical pharmacology [7] focussed on the drug action component by predicting the effect site concentration (Ce) using pharmacokinetic models for drug concentrations at observable sites such as plasma (Eq. 2). The drug effect is a function of Ce(t) defined by the maximum drug effect, Emax, and the concentration producing half of Emax, EC50. The model includes a baseline parameter, E0, which describes the response when Ce is 0 and, thus, drug action is absent. This parameter name is not well chosen because it is obvious that the effect of a drug is 0 when Ce is 0 and the “E” cannot refer to the effect of the drug.
| (2) |
Nevertheless, the E0 parameter can describe the disease component in the simplest case when disease state does not change with time.
For the purpose of our discussion we will use the term disease status, S, for the clinical measure of disease severity with and without drug effects. Equation 3 emphasizes that disease status is expected to change with time but in this, the simplest of cases, the baseline status, S0, does not vary.
| (3) |
We use S to define any physiological or pathological measure that might be used to describe disease severity and its response to treatment. It may include measures derived from clinical signs (e.g. UPDRS, motor subsection or tapping rate), symptoms (e.g. UPDRS Activities of daily living subsection or the Schwab and England Scale or biomarkers, such as amyloid accumulation in the brain in Alzheimer’s disease [8].
We can add the time course of drug action to obtain a model similar to Eq. 2.
| (4) |
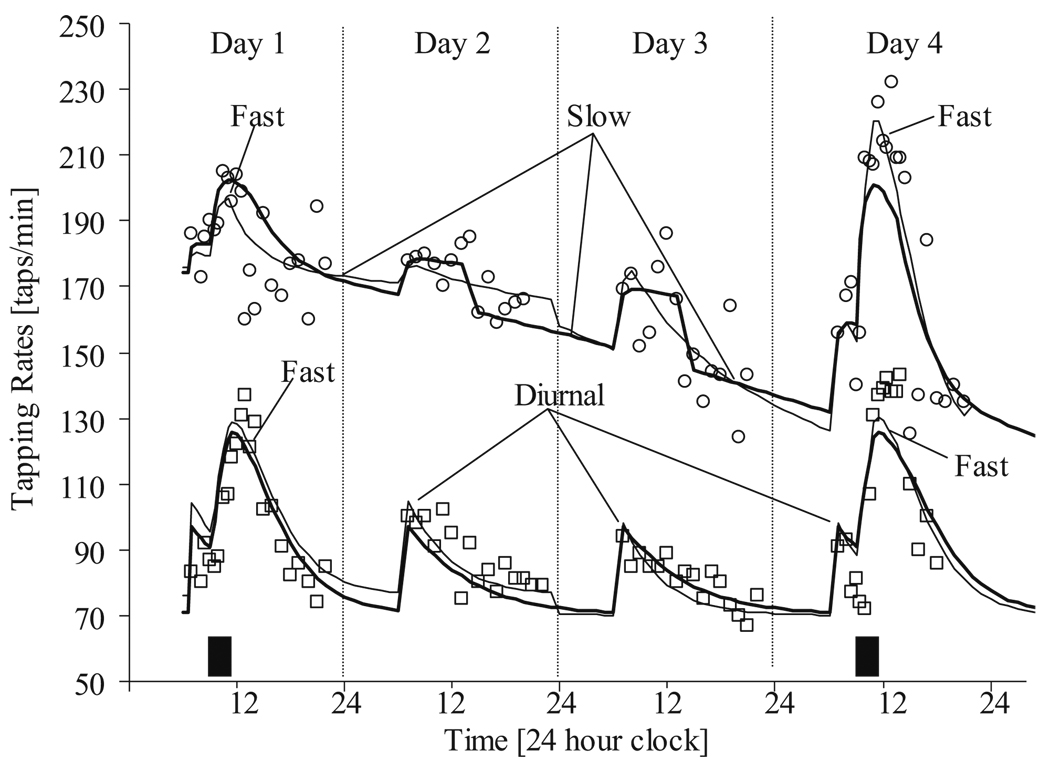
This kind of model has been used to describe the time course of changes in tapping rate following intravenous administration of levodopa (Fig. 1) [5]. The time course of Ce was predicted from the plasma levodopa pharmacokinetics and three independent components accounting for fast and slow equilibration and diurnal variation.
Fig. 1.
Individual fit of observed tapping rates for two illustrative patients with Parkinson’s disease (PD) using a model similar to Eq. 4. Squares are derived from a PD subject at the initiation of long-term levdoopa therapy (no previous levodopa treatment) and circles represent a PD subject who had been on long-term levodopa therapy (chronic treatment). Filled rectangles indicate the timing and duration of levodopa infusions. The thin solid line is the model prediction where no difference in the pharmacodynamic parameters before and after the drug holiday is assumed. The heavy solid line is the model prediction where different parameters are used to describe the responses before and after the drug holiday. From [5]
We can generalize the drug action part of the model by using E(t) for any function of drug exposure predicting the drug effect part of the overall disease state.
The simplest extension to the model that can account for a time-varying disease state is based on a linear function with slope α.
| (5) |
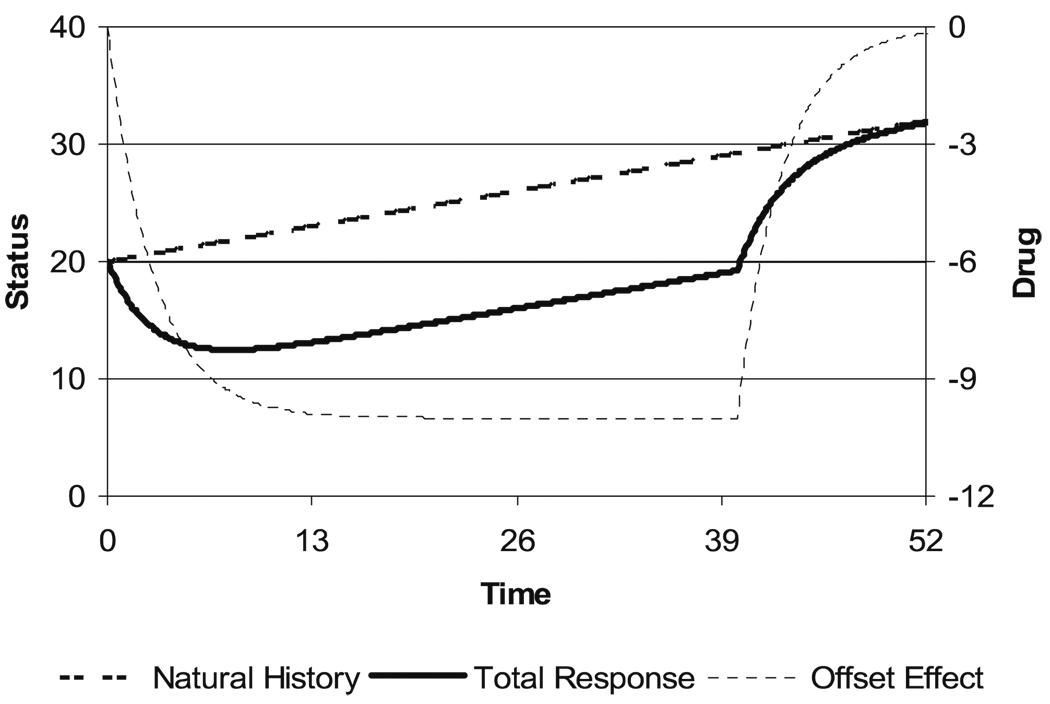
Figure 2 illustrates a linear natural history disease state curve. It is combined with a delayed onset and washout of drug effect which produces an offset to the natural history curve without modifying the rate of progression. A delay in drug effect in relation to plasma concentration occurs because it takes time for drug to distribute from the plasma to the site of action (typically measured in minutes) and there is often a change in the expression of a mediator of drug action that leads to the observed drug effect (which may take minutes to years). The drug effect predicted in Fig. 2 assumes that the washout of the effect follows the same exponential pattern used to describe its onset. While this is a common assumption, it is not a necessary one. This type of drug effect producing a shift in the natural history line can be called an ‘offset’ type of effect. Because it does not change the natural rate of progression and because after washout the disease state is the same as it would have been without treatment, this kind of effect is a ‘symptomatic’ effect.
Fig. 2.
Time course of disease state with linear progression and delayed drug effect
Disease progress or changing drug action of levodopa?
Levodopa has been the mainstay of treatment of PD since the insight of Hornykiewicz et al. [9] who discovered that there is a profound loss of dopamine in the striatum of patients with PD and subsequently realized that the dopaminergic deficit might be reversed by administration of the dopamine precursor, dihydroxyphenylalanine (DOPA). Cotzias et al. proved that oral DOPA could produce sustained benefits [10]. However, within months these researchers recognized that DOPA therapy was not without its drawbacks [11]. Patients on the drug began to have motor fluctuations and dyskinesia. Clinicians also noted that, with time, the motor benefits of DOPA did not seem to be as robust. After the initial dramatic benefits in Parkinsonism doubts about levodopa emerged. Why was the response not sustained? What were the long-term consequences over many years?
As experience accumulated, it began to appear that long-term treatment with levodopa (and its inevitable association with continuing disease progression) could be described by two identifiable periods. There was an initial honeymoon period when levodopa almost completely reversed the signs and symptoms and the administration of levodopa three times a day was sufficient to maintain predictable and sustained benefit. After several years this almost ideal response waned. Levodopa was thought to have lost its effectiveness, although no mechanism for this phenomenon was explicitly identified. The contribution of the underlying progression of the disease was not considered. It was suggested that the honeymoon should be saved until the benefits of levodopa were desperately needed; the initiation of levodopa should be delayed as long as possible [12].
Other problems emerged during long-term levodopa treatment. Patients could no longer rely on consistent freedom from symptoms. Some doses did not work. Responses became transient, and more frequent dosing provided only temporarily restored the motor state to that of early treatment (to the good old days). A variety of terms were used to describe the transient motor responses, motor fluctuations, when more severe, were called oscillation, on–off and yo–yoing. The most common interpretation for motor fluctuations was that there was a loss of storage capability for the dopamine produced from the administered levodopa. In addition, involuntary movements, termed dyskinesia, began to accompany the motor improvement that came with most doses of levodopa.
Drug action of levodopa in Parkinson’s disease – changes with time
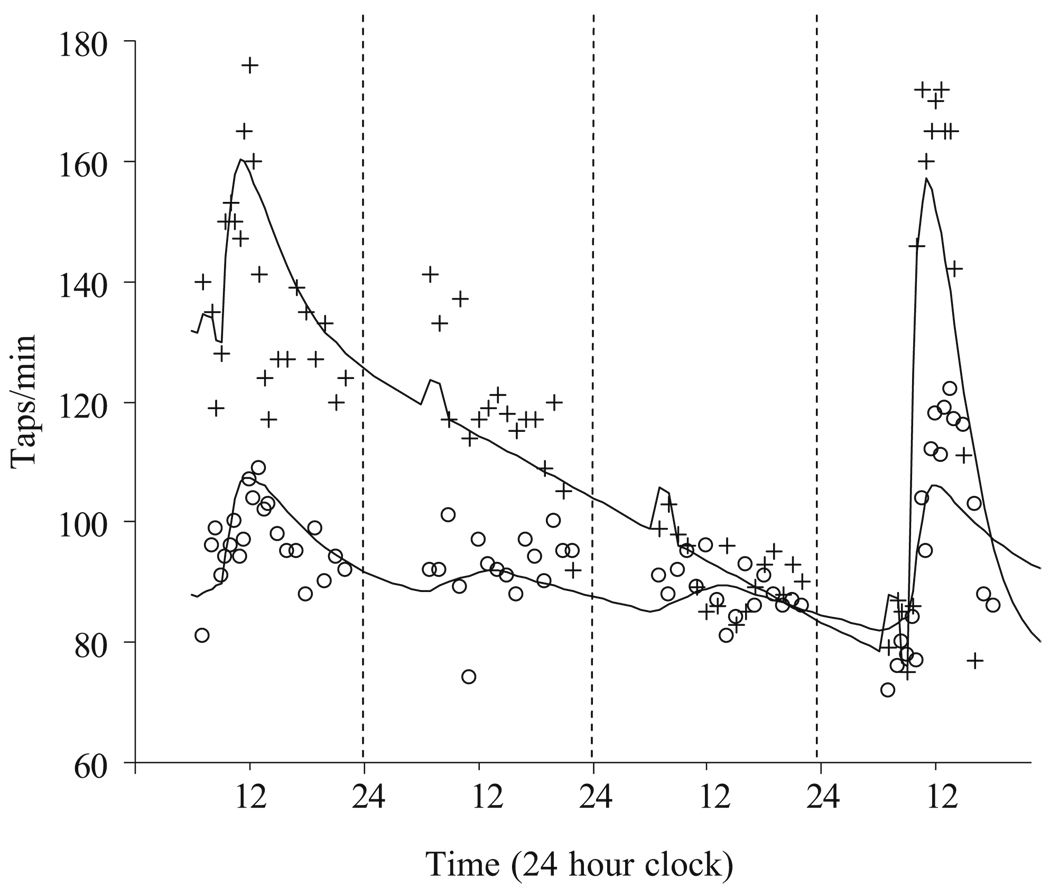
Clinicians focused on the immediate response to levodopa, measured in minutes to hours, in trying to understand long-term levodopa effects. However, even Cotzias et al. [11] had recognized that there might be long-duration effects from levodopa therapy. In patients who have been chronically treated with oral levodopa, there is a very slow improvement in pre-dose “off” motor activity that takes months to develop (Fig. 3; Tables 1, 2 E01). When oral levodopa is stopped there is a gradual loss of motor response over days. Re-challenge with intravenous levodopa produces a dramatic increase in motor response from the lower baseline. Because the withdrawal of levodopa for several days appears to be associated with a greater response when treatment is started again [1, 2], it had been thought that tolerance develops to levodopa and sensitivity was restored by stopping exposure. However, pharmacokinetic–pharmacodynamic analysis using plasma levodopa concentration and tapping rate response could not detect any change in sensitivity (EC50) or maximum response to levodopa (Emax) in a group of 12 patients who had received levodopa orally for 9.7±4.0 years [5]. The apparently improved response to levodopa after a drug holiday is illusory because the benefit only arises by superposition on a worsened functional state due to loss from a slow turnover reservoir of levodopa-like material.
Fig. 3.
Response to intravenous levodopa challenges (at 8 and 80 h) before (open circles) and after 4 years (crosses) of oral levodopa treatment. From [3]
Table 1.
Levodopa pharmacodynamic parameters in de novo (untreated), stable and fluctuating (chronically treated) patients
| Source | Patient group | E0 (taps/min) |
Dmax (taps/min) |
Emax (taps/min) |
EC50 (µmol/L) |
Hill coefficient |
Teqf (h) |
|---|---|---|---|---|---|---|---|
| [5] MKMODEL | De novo chronic | 91±31 | 46±61 | 137±62 | 5.39±2.83 | 1.30±0.6 | 3.99±6.0 |
| 95±32 | 51±39 | 146±50 | 4.60±3.56 | 2.24±1.3 | 0.63±0.57 | ||
| [21] MKMODEL | Mean data | 110 | 53.2 | 163.2 | 2.94 | – | 0.388 |
| [22] MKMODEL | De novo stable Fluctuating | 116±9 | 44±34 | – | 12.7±7.4 | 6.3±8.0 | – |
| 144±25 | 56±28 | 11.6±7.6 | 1.3±0.8 | ||||
| 106±23 | 98±17 | 10.7±7.2 | 1.4±0.8 | ||||
| [23] SIPHAR | Chronic 2nd dose ≥3 h after 1st dose | 101±39 | 77±47 | – | – | – | 0.42±0.17 |
| 101±39 | 76±41 | 0.33±0.21 | |||||
| [24] SIPHAR | Stable fluctuating | 101±33 | 40.5±18.3 | 166±44 | 1.22±0.66 (iv) | 2.8±1.5 | 2.72±1.17 |
| 125±34 | 51.5±25.0 | 153±44 | 3.25±1.32 | 16.3±12.7 | 0.48±0.35 | ||
| [25] NONMEM | Population | – | 90 (fixed) | – | 1.78±3.5% | 0.8±15.1% | 2.89±0.03% |
From [5].
Table 2.
Longitudinal changes in disease progress and levodopa pharmacodynamics
| Parameter | Month 0 (n=20) | Month 6 (n=20) | Month 12 (n=19) | Month 24 (n=16) | Month 48 (n=18) |
|---|---|---|---|---|---|
| Emax (taps/min) | 153±14 | 150±9 | 167±12 | 158±12 | 157±10 |
| EC50 (µmol/L) | 5.05±0.87 | 4.03±0.71 | 4.00±0.56 | 3.64±0.45 | 4.35±0.79 |
| Hill coefficient | 1.21±0.15 | 1.30±0.11 | 1.28±0.15 | 1.60±0.22 | 1.47±0.18 |
| Teqf (h) | 4.27±1.71 | 1.98±0.21 | 3.35±1.71 | 3.26±1.85 | 1.68±0.77 |
| CeSS (µmol/L) | 4.69±1.70 | 1.85±0.50 | 3.39±0.75 | 2.44±0.56 | 1.59±0.62c |
| C0snss (µmol/L) | 4.77±1.86 | 11.30±1.73 | 14.59±3.75 | 9.15±1.88 | 14.30±4.20 |
| E01a (taps/min) | 96±7 | 124±8c | 130±9c | 128±11c | 122±10c |
| E02 (taps/min) | 88±7 | 105±9 | 113±10c | 108±11c | 91±11 |
| Dmax1 (taps/min) | 57±13 | 26±4 | 38±7 | 29±4 | 35±8 |
| Dmax2 (taps/min) | 65±14 | 46±7 | 54±8 | 50±5 | 66±9 |
| RDiurnalb | 0.20 | 0.64 | 0.12 | 0.30 | 0.49 |
| Teqd (h) | 9.16±4.47 | 4.12±0.96 | 2.83±0.65 | 3.43±1.05 | 3.15±0.79 |
| Teqs (h) | 31.51±7.72 | 35.03±5.10 | 36.45±6.51 | 44.17±7.95 | 35.59±5.82 |
| Dvtpk (h) | 3.16±0.56 | 5.20±1.12 | 3.15±0.60 | 4.31±1.31 | 4.37±1.15 |
| Rsynd (µmol/L per hour) | 8.18±2.61 | 7.89±2.95 | 8.54±3.46 | 5.58±1.91 | 7.85±2.42 |
From [3]
Subscripts 1 and 2 refer to parameters estimated on two occasions before and after a 3-day levodopa drug holiday.
Median
p<0.05 compared with 0 month visit determined by Dunn’s multiple comparisons test with repeated measures ANOVA (n=15).
Figure 3 also shows that the overall response to an IV levodopa challenge changes dramatically with long-term levodopa treatment. A plausible pharmacological prediction might be to expect a diminished response to levodopa with time, but in fact the opposite occurs and the maximum effect of levodopa increases.
By observing the levodopa response over 4 years from the initiation of treatment, the time course of changed levodopa response can be dissected in terms of model parameters distinguishing disease progress from levodopa pharmacodynamics [2].
Disease state can be described by motor activity prior to a dose of levodopa – the baseline tapping rate E0. E0 is determined by the pharmacodynamic parameters of EC50 and Emax, levodopa-like activity from endogenous production (Cess) and activity in the slow turnover pool (C0nss) capable of accumulation with sustained oral levodopa. Endogenous production and slow turnover components were distinguishable by the time course of washout from the slow turnover pool during a 3-day drug holiday. There was no systematic change in EC50 detectable in a cohort of 20 patients followed for 4 years from initiation of levodopa treatment. But the maximum response, Emax, increased gradually, with a 20% maximum increase developing after about 2 years of levodopa treatment [3]. It might be expected that the progression of PD with loss of dopaminergic neurons would cause a loss of endogenous production, but no clear pattern of change in Cess was observed. On the other hand, the apparent size of the slow turnover pool, C0nss, did change, showing an initial build up with exposure to oral levodopa. This initial build up in combination with the increase in Emax explained the dramatic improvement in baseline motor function (E0) over the first few years of treatment. In contrast to Emax, which tended to reach a sustained peak in many patients, the slow turnover pool reached a peak and subsequently declined while endogenous production (Cess) steadily declined over 4 years. This suggests that the loss of dopaminergic neurons is primarily manifested functionally by a decreased buffering (shorter Teqf) and accumulation capacity for levodopa (decreased C0nss) with some late contribution from loss of endogenous production (Cess). There was no obvious time-related change in parameters describing diurnal variation in motor activity [3].
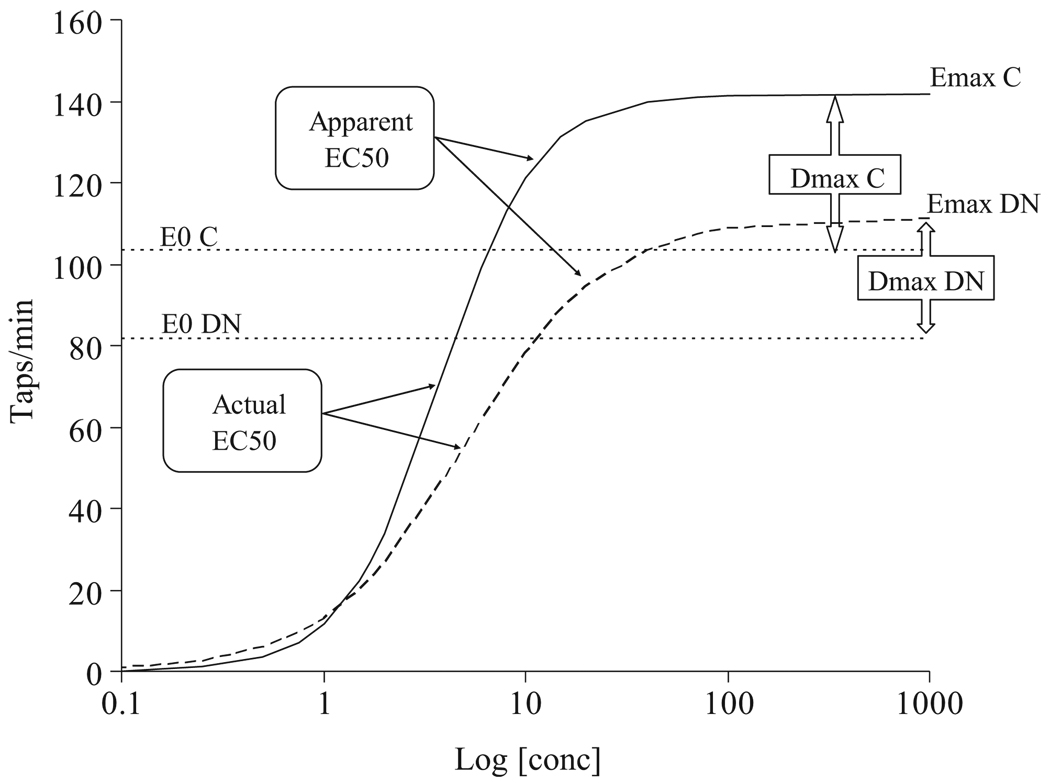
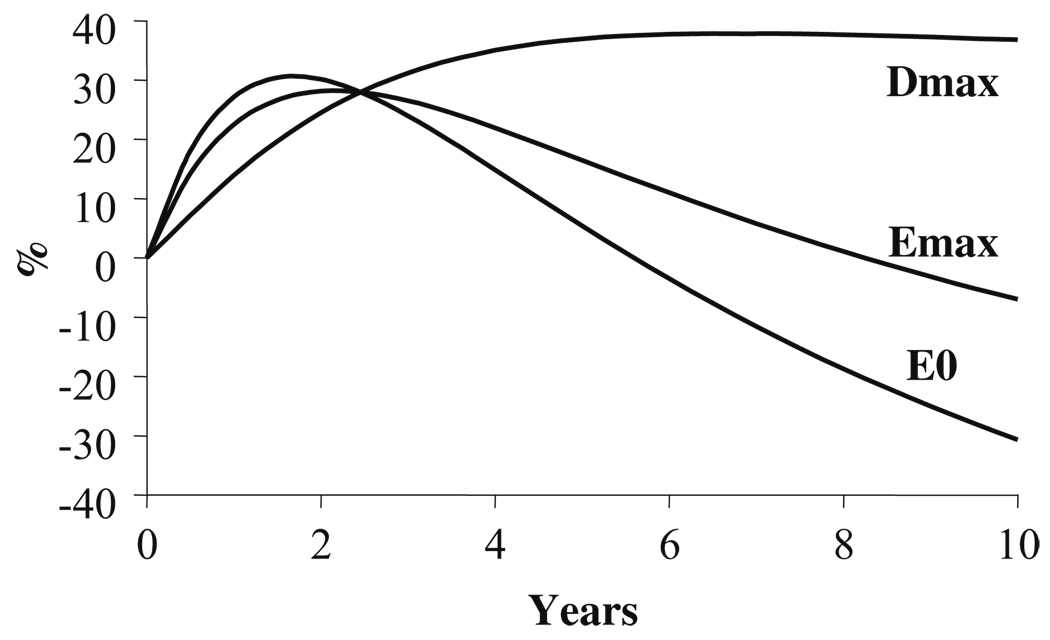
The combination of increased levodopa efficacy (Emax) and declining production (Cess) and accumulation capacity (C0nss) means that pre-dose motor function will eventually worsen (E0) but that the peak response to a dose of levodopa will increase. The maximum difference in function before and after a dose is called Dmax, and we predict it from Emax minus E0. The difference in Dmax between patients previously untreated (de novo) and those treated for many years (chronic) with levodopa is shown in Fig. 4. The time course of Dmax during years of levodopa treatment is expected to increase gradually and to reach a peak after about 5 years (Fig. 5). The magnitude of Dmax is a measure of the variation in patient functional change after each dose of levodopa. Patients who experience predictable fluctuations would be expected to have larger values of Dmax. The predicted time course of changes in Dmax is comparable to the several years of treatment associated with the transition from the stable to the fluctuating disease state.
Fig. 4.
Change in E0 and Emax before and after chronic levodopa treatment. DN De novo (previously untreated with levodopa), C chronic treatment with levodopa. From [5]
Fig. 5.
Predicted time course of E0, Emax and Dmax over 10 years of treatment
This interpretation of the acute and chronic response to levodopa suggests two factors are contributing to the fluctuating disease state. The first is the loss of buffering of the fast component of levodopa effect shown by the shortening of the fast equilibration half-live (Teqf), which we proposed a decade ago [1]. The second is the gradual dissociation between loss of levodopa accumulation capacity and the increase in levodopa effectiveness causing a larger peak-to-trough fluctuation [3].
Disease progress and drug action – DATATOP
In the late 1980s a biochemical hypothesis of neurodegeneration was developed. Oxygen was thought to be the villain through the generation of free radicals. Anti-oxidative therapies were proposed to slow or prevent the loss of dopaminergic neurons [13]. Spina and Cohen [14] proposed that levodopa was not an ideal physiological replacement for dopamine deficiency and that it contributed oxidative stress and was accelerating dopaminergic degeneration. The Parkinson Study Group organized and executed a landmark trial, DATATOP, to test these hypotheses. The study consisted of two putative anti-oxidant treatments, deprenyl to block oxidation of dopamine and tocopherol (vitamin E), an antioxidant, to see if either or both would delay the time for initiating levodopa in patients with previously untreated Parkinson’s disease. The delay in time to initiation of levodopa was considered to be a robust primary endpoint for testing the effect of agents that had no symptomatic actions. The primary endpoint of this trial reached statistical significance [15, 16], although the benefit rested entirely with deprenyl and not with tocopherol However, DATATOP also demonstrated that deprenyl had a mild symptomatic effect which confused the interpretation of the “neuroprotective effect” of deprenyl. Because deprenyl produced a symptomatic benefit in PD, the observed slowing of the rate of progression of UPDRS [15] associated with deprenyl treatment received little notice [17].
Neuroprotection is at the forefront of experimental therapeutics in PD. Generally what investigators have in mind is the structural protection of dopamine neurons and their terminals. The assumption is that slowing the loss of dopamine terminals will preserve motor function. However, what patients and clinicians actually want is the preservation of function. Thus, it is important to realize that the preservation of structural elements of the dopamine system is a surrogate marker for the real goal – preservation of motor function. Consequently, the progression of the UPDRS is a more relevant marker of disease progression than other neuroimaging markers or biochemical markers.
Disease progress and drug action – restoring law and order again
The Parkinson Study Group kindly gave us access to the records of the subjects initially enrolled in DATATOP [15]. These subjects had been followed in many cases for up to 8 years since enrolment in DATATOP with early stage PD. The primary marker of disease state was the UPDRS. Subsequent to randomization to treatment with placebo, deprenyl, tocopherol or deprynyl plus tocopherol, and as the disease severity increased, nearly all patients were treated with levodopa with and without deprenyl and. in many cases. with the dopaminergic agonists bromocriptine or pergolide. Meticulous documentation of each treatment plus frequent recording of the UPDRS provided a large database defining the progression of PD and its response to treatment.
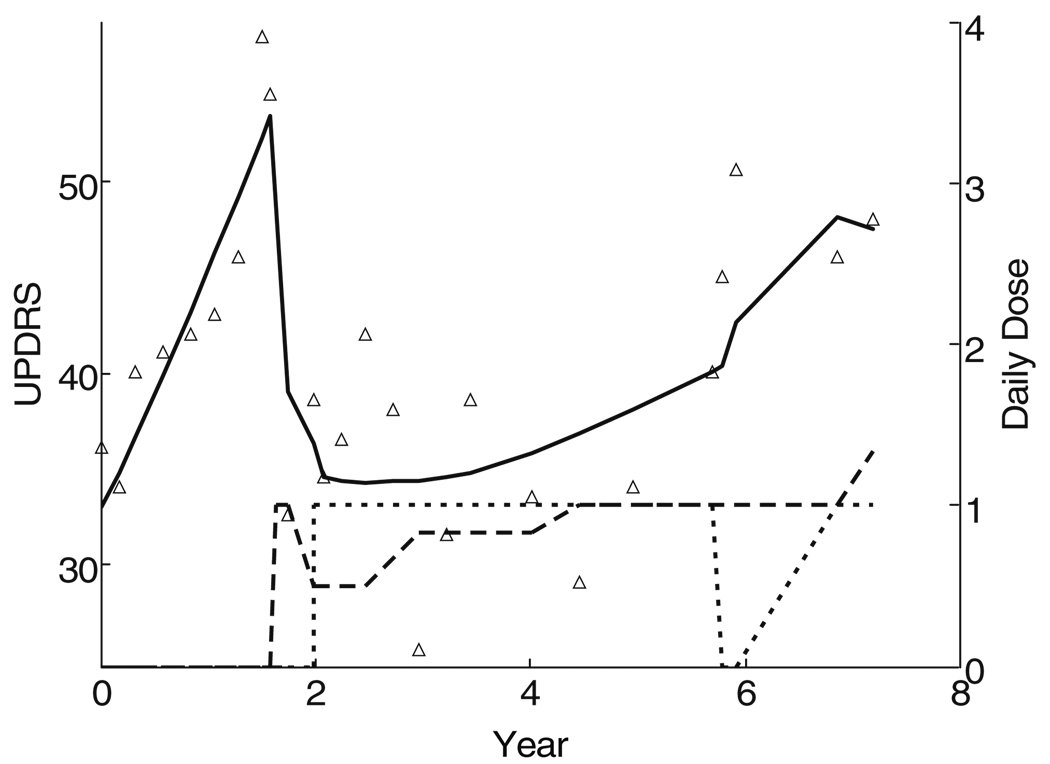
The UPDRS time course for the first patient in the DATATOP cohort is shown in Fig. 6. The UPDRS increased in a more or less linear fashion for the first 20 months while on placebo. The subject was then started on levodopa with a dramatic improvement in the UPDRS. Deprenyl was commenced 4 months after the initiation of levodopa, allowing for a reduction in the levodopa dose. Over the next 6 years, the UPDRS score slowly increased, but not as rapidly as during the initial untreated period. There was no indication that levodopa accelerated the rate of progression of the UPDRS, but interpretation is confounded by the symptomatic effects to changing doses of both levodopa and deprenyl.
Fig. 6.
Time course of UPDRS in the first subject initially assigned to placebo in DATATOP. Subsequently levodopa was started (dashed line) with two periods of deprenyl (dotted line)
Over a decade ago we introduced pharmacological concepts to restore law and order to descriptions and interpretations of the acute response to levodopa in PD [1]. The DATATOP cohort gave us the opportunity to apply a science model-based approach to chronic treatment [19].
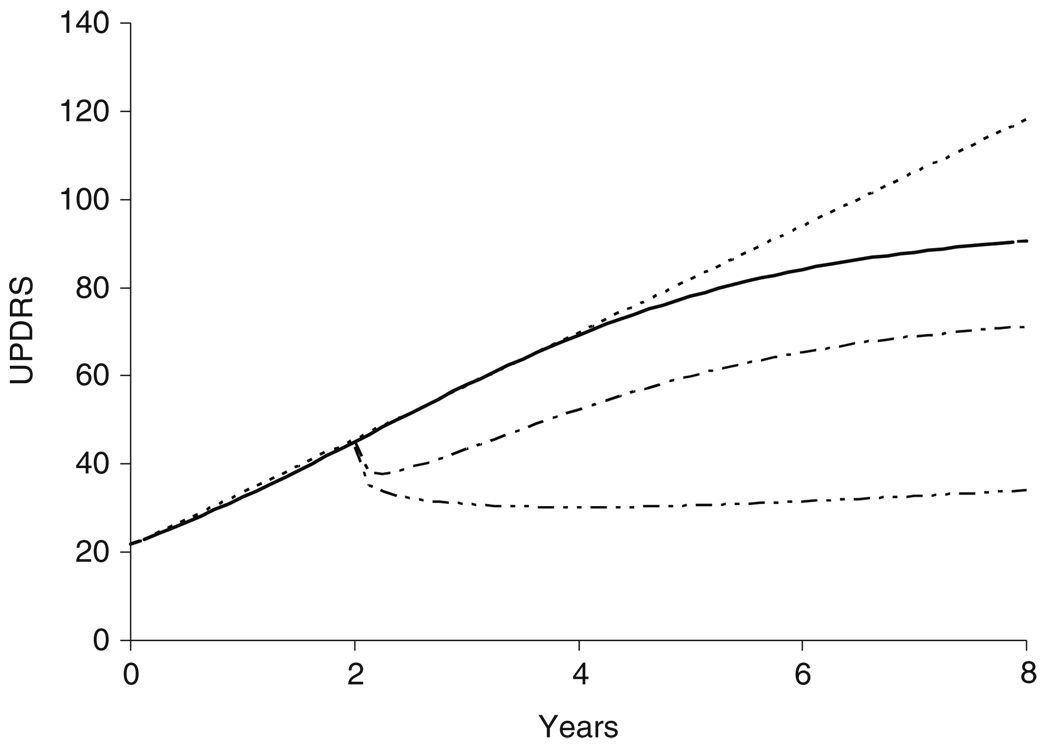
We applied the clinical pharmacology model (Eq. 1) to explore the time course of disease progression and magnitude of drug action [6] in this cohort of 800 subjects. Initially we assumed that disease progression was linear, but when we explored other curves we found that a more complex Gompertz function that allowed the UPDRS to approach an asymptote fit the data better. The Gompertz model allows the disease to ‘burn out’ or achieve a ceiling effect with the UPDRS scale. The Gompertz curve also predicts a slower initial progression compared with a constant linear model (Fig. 7).
Fig. 7.
Predicted natural UPDRS progression from study entry with linear model (dashed) or Gompertz model (solid). Symptomatic and protective effects of levodopa 300 mg/day alone (dash dot) and with deprenyl 10 mg/day, (dash dot dot) are shown from 2 years
The Gompertz model is not readily expressed as a closed form equation but can be stated as a differential equation defining the rate of progression.
| (6) |
Sss is a parameter defining the steady state disease state. This may also be called the ‘burned out’ disease state or a ceiling effect of the scale. Kprog is a rate constant parameter that determines how quickly the disease state approaches Sss. The initial condition for the solution to Eq. 6 is the baseline disease state S0.
At first we proposed that levodopa produced an offset action described by an Emax model (Eq. 5). While this could describe some of the features of Fig. 6 it did not explain adequately the slower progression after starting levodopa. The model for the symptomatic offset of levodopa was extended in two ways.
First, because of our earlier observation based on tapping responses, we allowed Emax to increase with time using an exponential asymptotic function with a half-life of 7 months. This was encouragingly similar to the value we had observed in another study based on tapping responses that reached a maximum about 2 years following the start of treatment [3].
Second, the slow washout of levodopa effects after withdrawal observed in other studies [5, 20] encouraged us to let the onset of levodopa effects be delayed by another asymptotic exponential process The fast equilibration half-life of 0.5–4 h (Table 2; Teqf) followed by a slow equilibration half-life of 32–44 h (Table 2; Teqs) estimated during a 3-day withdrawal and the 5.6-day half-life [20] seen over a 15-day withdrawal period initially surprised us with a much longer equilibration half-life of 2.4 years. However, during the 4-year longitudinal study of the tapping response [3], we had found that the capacity of the slow turnover pool to accumulate levodopa-like activity was still rising at 4 years (Table 2; C0nss). At best we interpret these half-lives simply as empirical descriptive parameters, but they do point to at least four phases of onset and offset of levodopa symptomatic effects, with time courses of about an hour, a day, nearly a week and many months.
But does levodopa slow or hasten progression as well as having a symptomatic action? It was pointed out earlier that drug action may be observed on any parameter of the disease progress model. The Gompertz model has three parameters – S0, the baseline disease state, Sss, the steady state ‘burnt-out’ disease state and Tprog, the time constant determining how quickly Sss is approached. The symptomatic effect model described above produces an offset to the whole progress curve, but it is equivalent to modifying the S0 baseline parameter. The maximum offset effect of levodopa is predicted to be −23.3 UPDRS units. If levodopa affects the rate of progression (Eq. 6), it may do so by changing Sss and/or Tprog. We found that the effect of levodopa was best described by an increase in Tprog, which means it takes longer to reach Sss [6]. If a linear disease progress model were used, this effect is equivalent to reducing the slope of the line. The combined symptomatic (offset) and protective (slope) effects of levodopa treatment on S0 and Tprog are shown in Fig. 8. Most of the benefit of levodopa arises from its symptomatic offset from the Gompertz natural history curve, but its protective effect is revealed by the divergence of the curves after the symptomatic steady state has been reached. The modelling of the UPDRS in this large cohort gave no suggestion that levodopa hastened progression of signs and symptoms.
Fig. 8.
ELLDOPA design showing natural history and alternative predictions for levodopa. The lowest curve shows levodopa symptomatic and protective actions, the middle curve shows levodopa symptomatic action alone, the upper curve is the natural history progression curve
The other treatment of interest in the DATATOP cohort is deprenyl. Deprenyl has a small symptomatic effect (−1.2 UPDRS units) of its own, but it also slows the rate of progression of the UPDRS by increasing Tprog. Given that both levodopa and deprenyl slow progression, we asked if there was any interaction between them and found that the combination was especially effective at slowing progression. This is shown in the lowest curve on Fig. 7.
Modeling the response to antiparkinsonian medications in the DATATOP trial also yielded another result of interest to the clinician. Is there a honeymoon response to levodopa with subsequent decline in the response? The DATATOP modelling gave no evidence that there was a decline in the levodopa response. It appears more likely that disease progression introduces additional motor problems that are not amenable to levodopa, primarily gait, balance and speech difficulties. However, the motor signs that respond to levodopa initially continue to respond for at least years.
Disease progress and drug action – ELLDOPA
Concern about possible deleterious effects of levodopa led to the design of the Early versus Later LevoDOPA (ELLDOPA) trial [18]. This trial was based on a simple hypothesis – if the benefits of levodopa were purely symptomatic, then treatment would not influence the progression of the disease state. Comparison of the disease state in placebo-treated subjects with that in levodopa-treated subjects should be indistinguishable after levodopa withdrawal and washout of the symptomatic effects – if levodopa had no toxic effects (Fig. 8). However, if there were deleterious effects of levodopa treatment, after the washout of the symptomatic effects of levodopa, the treated subjects should have a worse motor state than the placebo-treated subjects. Another scenario – that levodopa would slow the progression of symptoms – received no attention. A further complication for interpretation of the trial results was the long-duration response to levodopa – an effect that develops over days to weeks and decays at a similar rate – that was not widely appreciated.
While no one suggested abandoning levodopa it was hypothesized that if levodopa was in fact accelerating progression, then treatment should be delayed as long as possible with the hope of getting some longer overall benefit by foregoing the often dramatic initial response. On the other hand, if levodopa did not accelerate progression, then it should be initiated earlier. The possibility of a protective effect slowing progression seems to have been barely considered in the pursuit of the proposed toxic effects of levodopa.
Learning from the past – looking into the crystal ball
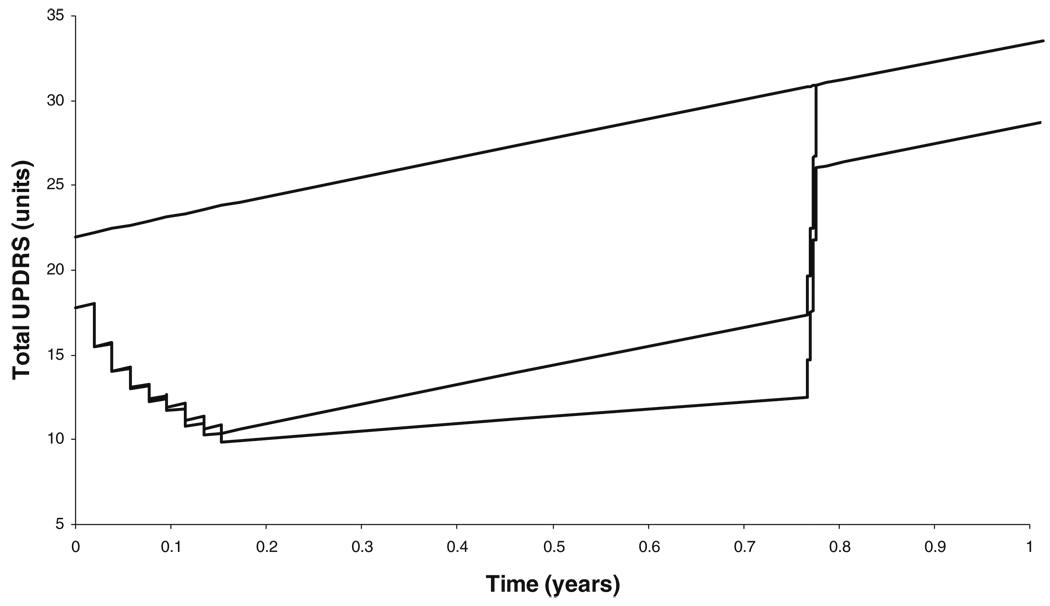
Having built a model for the progression of UPDRS with the time course of levodopa symptomatic and protective effects, it became possible to predict the outcome of the ELLDOPA study. An earlier linear disease progress model was used to simulate UPDRS progression and levodopa effects over the 9.5 months of the trial [4]. The analysis of the DATATOP cohort not only provided information about the typical response profile but also about the between-subject variability in the model parameters. This stochastic component of the model was used to simulate multiple replicate instances of the ELLDOPA trial design. Each replicate could then be analysed as if it were from the actual ELLDOPA study. The main statistical test was aimed at the null hypothesis that the levodopa treated groups were indistinguishable from the placebo-treated group 2 weeks after withdrawal of treatment. Patient responses were simulated under various scenarios involving combinations of symptomatic, symptomatic plus protective and symptomatic plus toxic effects. The latter scenario assumed that levodopa accelerated the rate of progression – the concern that had motivated the ELLDOPA study in the first place.
Using the scenario with both protective and symptomatic effects of levodopa – exactly as predicted from the DATATOP cohort – there was good agreement between the observed levodopa-placebo difference and the predicted value (Table 3).
Table 3.
Observed and predicted total UPDRS change
| Effect of levodopa on disease progression |
Scenario | Placebo difference from baseline at 42 weeksa |
Levodopa treatment difference from placebo at 42 weeksa |
||
|---|---|---|---|---|---|
| Low | Medium | High | |||
| Observed ELLDOPAb | 7.8±1.1 | 5.9±0.7 | 5.9±0.8 | 9.2±0.9 | |
| Protective | Predicted effect site Concentration Washoutc | 9.9±1.0 | 3.8±1.4 | 5.9±1.3 | 8.4±1.3 |
| Toxic | Predicted effect site Concentration Washoutc | 10.0±1.0 | 1.0±1.3 | 0.4±1.5 | −1.4±1.5d |
Predictions assume levodopa has symptomatic and protective actions with slow symptomatic washout. From [4]
Difference between 0 and 42 weeks
Mean ± SE calculated from treatment mean difference from placebo and placebo SD and number of patients in active dose arms
Bootstrap mean ± SD of 100 simulated trial replications. The SD is equivalent to the SE for placebo change from baseline
Negative value represents an increase in total UPDRS
Of particular relevance to the concern that levodopa might be toxic, we note that the dose dependence of the levodopa–placebo difference would predict the greatest difference from placebo in the highest dose group in the direction of disease worsening. However, the actual trend in the observations was in the opposite direction, which suggests there is no toxic effect of levodopa treatment.
Why time cannot be ignored
The clinician administers medications to PD patients with the goal of immediately improving the patient, but there are also concerns about the effects of this treatment on the patient 5, 10 and 15 years in the future.
DATATOP and similar large long-term studies databases contain much information on the course of the disease, but a great deal of this information has been inaccessible because of the multiple changes in medications and doses that defy analysis with classical statistical methods. Disease progress modelling allows the time course of disease changes to be separated from those associated with changes in drug treatment and the time course of drug action. Modelling allows use to learn from these rich but complex databases, and there is much more to be learned from data already residing in existing databases.
As essentially all patients are treated, it is impractical to establish the time course of PD progression by direct observation. However, based on simple assumptions we conclude that changes in UPDRS are approximately linearly for several years after diagnosis. There is also a strong suggestion that the rate of progression subsequently slows and may approach a ‘burnt out’ asymptote.
Modeling of the response to levodopa and deprenyl over time yields important insights into the long-term actions of levodopa and deprenyl. Modeling of responses over years indicates that: (1) levodopa effects do not decline over years, as suggested by the “levodopa honeymoon”; (2) levodopa has no deleterious effect on the progression of the motor function and may actually preserve function; (3) Deprenyl slows the progression of disability as measured by the UPDRS; (4) the clinical benefit to levodopa increases over many months and similarly declines very slowly.
The changes of disease and drug action with time cannot be ignored if PD is to be understood and therapies improved.
Acknowledgements
Dr. Nutt is supported by NIH RO1-NS21062 and Veterans Administration Parkinson’s Disease Research, Education and Clinical Center (PADRECC).
Abbreviations
- α
Slope of linear disease status curve
- Ce
Effect compartment concentration
- CeSS
Steady state effect site concentration at the start of each levodopa infusion derived from endogenous dopamine and previous exogenous levodopa administration
- C0pnss
Non-steady state levodopa concentration in plasma
- C0snss
Non-steady state component of the slow equilibration effect compartment
- Dmax
Maximum levodopa induced response above baseline
- Dvtpk
Duration of uniform diurnal input
- EC50
Concentration at which 50% of maximum response is produced
- Emax
Maximum tapping rates that a drug can produce
- Hill
Hill coefficient which determine the steepness of the concentration–response curve
- RDiurnal
Ratio of diurnal input to constant input of endogenous dopamine
- Rsynd
Rate of levodopa equivalent dopamine synthesis in the dopa synthesis effect compartment during the diurnal input period
- S0
Baseline status
- Teqd
Equilibration half-life of the dopa synthesis effect compartment
- Teqf
Equilibration half-life of the fast equilibration effect compartment
- Teqs
Equilibration half-life of the slow equilibration effect compartment
Contributor Information
Nick Holford, Department of Pharmacology and Clinical Pharmacology, University of Auckland, Auckland, New Zealand, n.holford@auckland.ac.nz.
John G. Nutt, Department of Neurology, Oregon Health and Science University, Portland, OR, USA
References
- 1.Nutt JG, Holford NHG. The response to levodopa in Parkinson’s disease: Imposing pharmacological law and order. Ann Neurol. 1996;39:561–573. doi: 10.1002/ana.410390504. [DOI] [PubMed] [Google Scholar]
- 2.Chan PL, Nutt JG, Holford NH. Importance of within subject variation in levodopa pharmacokinetics: a 4 year cohort study in Parkinson’s disease. J Pharmacokinet Pharmacodyn. 2005 Aug;32(3–4):307–331. doi: 10.1007/s10928-005-0039-x. [DOI] [PubMed] [Google Scholar]
- 3.Chan PL, Nutt JG, Holford NH. Pharmacokinetic and pharmacodynamic changes during the first four years of levodopa treatment in Parkinson’s disease. J Pharmacokinet Pharmacodyn. 2005 Aug;32(3–4):459–484. doi: 10.1007/s10928-005-0055-x. [DOI] [PubMed] [Google Scholar]
- 4.Chan PL, Nutt JG, Holford NH. Levodopa slows progression of Parkinson’s disease. External validation by clinical trial simulation. Pharm Res. 2007 Apr;24(4):791–802. doi: 10.1007/s11095-006-9202-3. [DOI] [PubMed] [Google Scholar]
- 5.Chan PLS, Nutt JG, Holford NHG. Modeling the short and long duration responses to exogenous levodopa and to endogenous levodopa production in Parkinson’s disease. J Pharmacokinet Pharmacodyn. 2004;31(3):243–268. doi: 10.1023/b:jopa.0000039566.75368.59. [DOI] [PubMed] [Google Scholar]
- 6.Holford NHG, Chan PL, Nutt JG, Kieburtz K, Shoulson I. Disease progression and pharmacodynamics in Parkinson disease - evidence for functional protection with levodopa and other treatments. J Pharmacokinet Pharmacodyn. 2006 Jun;33(3):281–311. doi: 10.1007/s10928-006-9012-6. [DOI] [PubMed] [Google Scholar]
- 7.Holford NHG, Sheiner LB. Understanding the dose–effect relationship: clinical application of pharmacokinetic-pharmacodynamic models. Clin Pharmacokinet. 1981;6(6):429–453. doi: 10.2165/00003088-198106060-00002. [DOI] [PubMed] [Google Scholar]
- 8.Hardy J, Selkoe DJ. The amyloid hypothesis of Alzheimer’s disease: progress and problems on the road to therapeutics. Science. 2002 Jul 19;297(5580):353–356. doi: 10.1126/science.1072994. [DOI] [PubMed] [Google Scholar]
- 9.Bernheimer H, Birkmayer W, Hornykiewicz O, Jellinger K, Seitelberger F. Brain dopamine and the syndromes of Parkinson and Huntington. Clinical, morphological and neurochemical correlations. J Neurol Sci. 1973 Dec;20(4):415–455. doi: 10.1016/0022-510x(73)90175-5. [DOI] [PubMed] [Google Scholar]
- 10.Cotzias GC, Van Woert MH, Schiffer LM. Aromatic amino acids and modification of parkinsonism. N Engl J Med. 1967;276(7):374–379. doi: 10.1056/NEJM196702162760703. [DOI] [PubMed] [Google Scholar]
- 11.Cotzias GE, Papavasiliou PS, Gellene R. Modification of parkinsonism-chronic treatment with L-dopa. N Engl J Med. 1969;280(7):337–345. doi: 10.1056/NEJM196902132800701. [DOI] [PubMed] [Google Scholar]
- 12.Fahn S, Calne DB. Considerations in the management of parkinsonism. Neurology. 1978 Jan;28(1):5–7. doi: 10.1212/wnl.28.1.5. [DOI] [PubMed] [Google Scholar]
- 13.Fahn S, Cohen G. The oxidant stress hypothesis in Parkinson’s disease: evidence supporting it. Ann Neurol. 1992 Dec;32(6):804–812. doi: 10.1002/ana.410320616. [DOI] [PubMed] [Google Scholar]
- 14.Spina MB, Cohen G. Dopamine turnover and glutathione oxidation: implications for Parkinson disease. Proc Natl Acad Sci USA. 1989 Feb;86(4):1398–1400. doi: 10.1073/pnas.86.4.1398. [DOI] [PMC free article] [PubMed] [Google Scholar]
- 15.The Parkinson Study Group. Effect of deprenyl on the progression of disability in early Parkinson’s disease. N Engl J Med. 1989;321:1364–1371. doi: 10.1056/NEJM198911163212004. [DOI] [PubMed] [Google Scholar]
- 16.The Parkinson Study Group. DATATOP: A multicenter controlled clinical trial in early Parkinson’s disease. Arch Neurol. 1989;46:1052–1060. doi: 10.1001/archneur.1989.00520460028009. [DOI] [PubMed] [Google Scholar]
- 17.Schulzer M, Mak E, Calne DB. The antiparkinson efficacy of deprenyl derives from transient improvement that is likely to be symptomatic. Ann Neurol. 1992;32(6):795–798. doi: 10.1002/ana.410320614. [DOI] [PubMed] [Google Scholar]
- 18.Fahn S. Parkinson disease, the effect of levodopa, and the ELLDOPA trial. Earlier vs Later L-DOPA. Arch Neurol. 1999;56(5):529–535. doi: 10.1001/archneur.56.5.529. [DOI] [PubMed] [Google Scholar]
- 19.Jonsson EN, Sheiner LB. More efficient clinical trials through use of scientific model-based statistical tests. Clin Pharmacol Ther. 2002 Dec;72(6):603–614. doi: 10.1067/mcp.2002.129307. [DOI] [PubMed] [Google Scholar]
- 20.Hauser RA, Holford NHG. Quantitative description of loss of clinical benefit following withdrawal of levodopa-carbidopa and bromocriptine in early Parkinson’s disease. Mov Disord. 2002;17(5):961–968. doi: 10.1002/mds.10226. [DOI] [PubMed] [Google Scholar]
- 21.Nelson MV, Berchou RC, Lewitt PA, Kareti D, Kesaree N, Schlick P, et al. Pharmacokinetic and pharmacodynamic modeling of l-dopa plasma concentrations and clinical effects in Parkinson’s disease after Sinemet. Clin Neuropharmacol. 1989;12(2):91–97. doi: 10.1097/00002826-198904000-00002. [DOI] [PubMed] [Google Scholar]
- 22.Nutt JG, Woodward WR, Carter JH, Gancher ST. Effect of long-term therapy on the pharmacodynamics of levodopa. Relation to On–Off phenomenon. Arch Neurol. 1992;49:1123–1130. doi: 10.1001/archneur.1992.00530350037016. [DOI] [PubMed] [Google Scholar]
- 23.Contin M, Riva R, Matinelli P, Baruzzi A. Kinetic-dynamic relationship of oral levodopa: Possible biphasic response after sequential doses in Parkinson’s disease. Mov Disord. 1992;7(3):244–248. doi: 10.1002/mds.870070310. [DOI] [PubMed] [Google Scholar]
- 24.Contin M, Riva R, Martinelli P, Baruzzi A. Pharmacodynamic modeling of oral levodopa: Clinical application in Parkinson’s disease. Neurology. 1993;43:367–371. doi: 10.1212/wnl.43.2.367. [DOI] [PubMed] [Google Scholar]
- 25.Triggs EJ, Charles BG, Contin M, Martinelli P, Cortelli P, Riva R, et al. Population pharmacokinetics and pharmacodynamics of oral levodopa in parkinsonian patients. Eur J Clin Pharmacol. 1996;51:59–67. doi: 10.1007/s002280050161. [DOI] [PubMed] [Google Scholar]


