Abstract
We demonstrate a cellphone based Rapid-Diagnostic-Test (RDT) reader platform that can work with various lateral flow immuno-chromatographic assays and similar tests to sense the presence of a target analyte in a sample. This compact and cost-effective digital RDT reader, weighing only ~65 grams, mechanically attaches to the existing camera unit of a cellphone, where various types of RDTs can be inserted to be imaged in reflection or transmission modes under light-emitting-diode (LED) based illumination. Captured raw images of these tests are then digitally processed (within less than 0.2 sec/image) through a smart application running on the cellphone for validation of the RDT as well as for automated reading of its diagnostic result. The same smart application running on the cellphone then transmits the resulting data, together with the RDT images and other related information (e.g., demographic data) to a central server, which presents the diagnostic results on a world-map through geo-tagging. This dynamic spatio-temporal map of various RDT results can then be viewed and shared using internet browsers or through the same cellphone application. We tested this platform using malaria, tuberculosis (TB) as well as HIV RDTs by installing it on both Android based smart-phones as well as an iPhone. Providing real-time spatio-temporal statistics for the prevalence of various infectious diseases, this smart RDT reader platform running on cellphones might assist health-care professionals and policy makers to track emerging epidemics worldwide and help epidemic preparedness.
Introduction
Early diagnosis of infectious diseases is essential to prevent the long-term effects of emerging public health threats and to reduce disease burden. For this end, lateral flow immuno-chromatographic tests or Rapid-Diagnostic-Tests (RDTs) provide emerging tools to screen infectious diseases even in resource limited settings or remote locations where conventional approaches (e.g., clinical examination, standard lab-tests and microscopy, etc.) are limited or even not available. Penetration of RDT technologies to public health endeavours has generated several advantages including, but not limited to, better patient management where the infection symptoms are not specific to a particular disease (i.e., asymptomatic diseases), efficient surveillance of outbreaks in high-risk endemic areas, and widespread health care delivery by minimally trained technicians1–13.
In parallel to the development of various RDTs, the current status of wireless telecommunication technologies exhibits a promising potential to be utilized for healthcare applications even in the least developed parts of the world. With more than 5 billion subscriptions worldwide, the cellphone, as a ubiquitous platform, can be utilized for imaging, sensing, processing and communicating health related data even in field settings using already embedded digital components such as CMOS image sensors, micro-processors, LCD displays, various receivers/transmitters, etc. Therefore, this existing wireless telecommunication infrastructure, and in particular cellphones, provide stimulating opportunities to transform our global fight against e.g., infectious diseases, creating new avenues for cloud-based health monitoring & management platforms14–24.
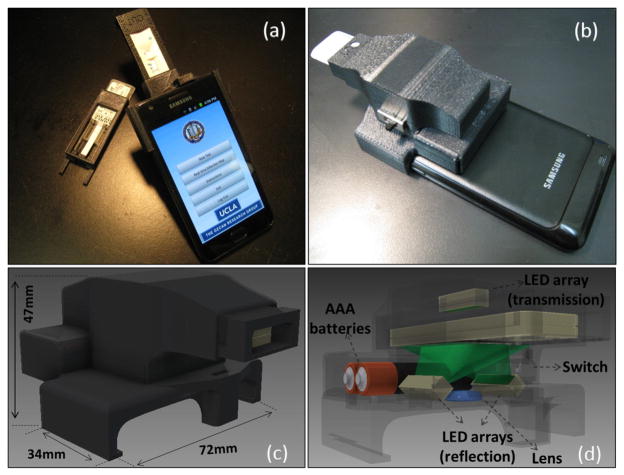
Toward the same broad goal, here we introduce a compact and cost-effective RDT reader platform installed on a cellphone that can work with various lateral flow immuno-chromatographic assays and similar tests to sense the presence of a target analyte in samples. Our RDT reader attachment, weighing ~65 grams, includes an inexpensive plano-convex lens, three light-emitting diode (LED) arrays, and two AAA batteries (see Figure 1). Installed at the back of the existing camera unit of a cellphone, this mechanical attachment allows digital acquisition of images (in reflection or transmission) of an RDT of interest. These raw images are then processed in real time through a custom-developed application/software running on the cellphone to generate an automated report that consists of test validation and reading of the diagnostic results as well as quantification of the test lines’ colour intensities (see Figures 2 and 3).
Fig. 1.
(a–b) Different views of our smart RDT reader prototype installed on an Android phone (Samsung Galaxy S II). This light-weight (65 grams) and compact attachment can be repeatedly attached/detached to the cellphone body without the need for fine alignment and modification. To accommodate various RDT types using the same base attachment, customized sample trays are used. (c–d) Schematic diagrams of the designed optical RDT reader attachment are shown. It utilizes three LED arrays with diffusers to ensure uniform illumination of the tests which are loaded to the attachment with customized trays. Two of the LED arrays are located underneath the RDT tray to illuminate it for reflection imaging, whereas a third LED array is used for top illumination to record transmission images of the same RDT. Powered by two AAA batteries, reflection and transmission illumination LED arrays are controlled manually by a physical switch located on the side of the attachment or digitally through the audio jack of the cellphone device (if available). Depending on the format of the diagnostic test, users can switch between the two illumination schemes (reflection vs. transmission) to acquire an image of the RDT with high contrast. This image is then rapidly processed within less than 0.2 sec/image through a custom-developed application running on the cellphone (see Fig. 2) to generate an automated report that consists of test validation and reading of the diagnostic results as well as quantification of the test lines’ color intensities.
Fig. 2.
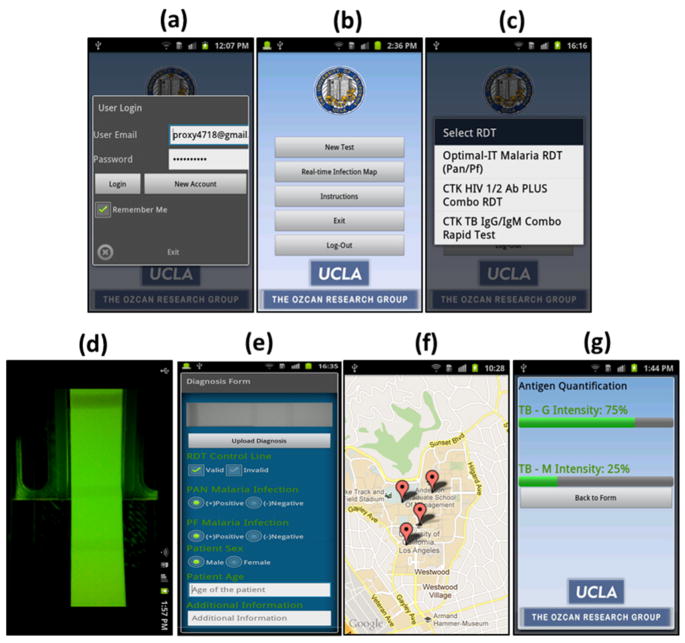
(a) User Login screen of the Android application running on the cell phone device that is shown in Fig. 1. (b) Main Menu of the application is shown. (c) Once user selects to image a new RDT, a pull-down menu of the already-configured RDTs pops up. (d) Upon the selection of RDT type and illumination scheme (reflection or transmission), application displays a raw image of the test. User can then touch the screen to capture and digitally process and evaluate the test results. (e) RDT Evaluation Menu displays test results including validity of the test (valid/invalid), decision of infection (positive/negative) for each test type as well as other information that the user can manually enter. The same application then uploads this test result to our database/server (f) that is protected by password. In case wireless connection is not available, it saves the results to the cellphone memory to be transmitted later. (g) Our application can also quantify the relative antigen density for each test line. To perform this antigen density measurement, RDT application needs to be calibrated by imaging a blank un-functionalized test (for minimum color intensity) and a saturated test (for maximum color intensity) that is functionalized using positive control antigens. Then the application returns the ratio of antigen density compared to reference values per test line. Note that for each RDT type, this calibration needs to be performed only once.
Fig. 3.
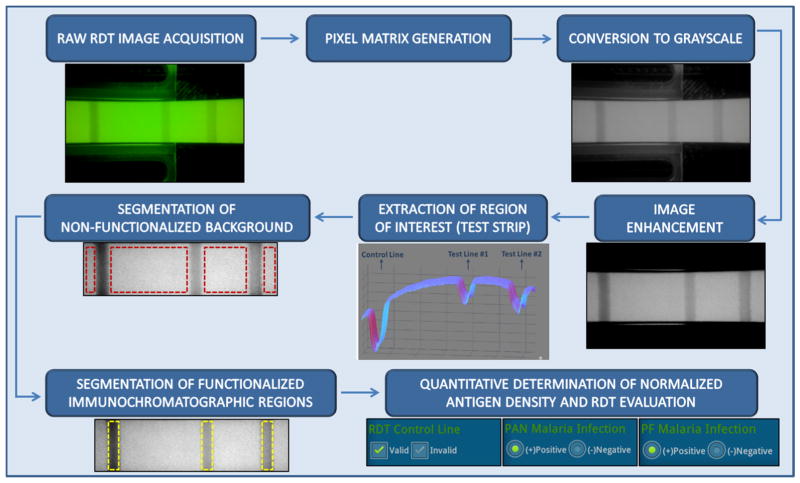
Block diagram of the automated image processing algorithm that is run by our cellphone based smart RDT reader application. In this case, a reflection image of the RDT is shown and processed.
This cellphone based RDT reader is also wirelessly integrated into a global database/server to store and organize its diagnostic results/reports and related data (e.g., RDT images, demographic data, test lot ID, etc.). The resulting spatio-temporal map of various RDTs (see Fig. 4) can then be viewed and shared using internet browsers or through the same cellphone application connecting to our servers (protected by password), which can be quite useful for short- and long-term monitoring of temporal and spatial evolution of various infectious diseases or conditions that can be diagnosed and monitored through RDTs. It is also important to emphasize that size of the entire data package for each test (including the diagnostic report, digitally processed RDT image, patient information, etc.) to be sent from the cellphone to the server is less than 0.05 MBytes such that it does not put a major burden on the network. In case of poor wireless connectivity, these digital test reports are also stored locally at the cellphone memory to be automatically uploaded to our servers when wireless connection becomes available.
Fig. 4.
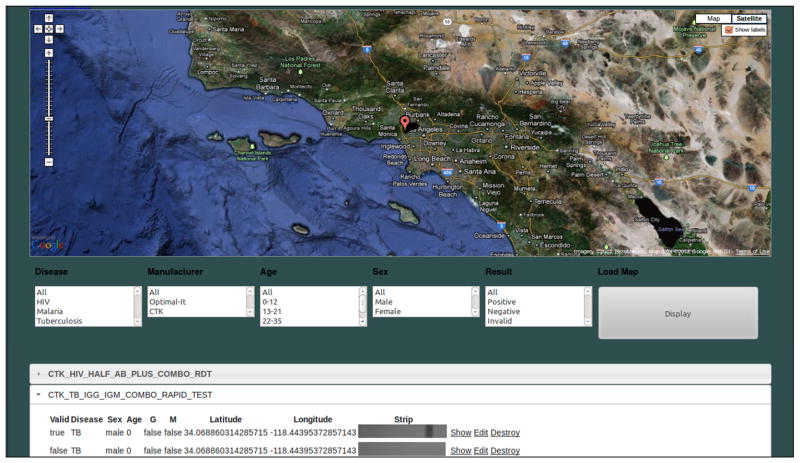
Web interface of the Real Time RDT Map generated by our server is shown. This global database stores and organizes test results uploaded by users. The server displays the test data on an internet browser using Google Maps and can filter the data displayed based on several attributes, including: disease type, test location and time/date, RDT type/manufacturer, patient age, etc. It can be reached from the main menu of the cellphone application or from a remote location using a personal computer or other mobile devices running a web browser.
Note also that the RDT cartridges to be digitally read are inserted into the base of the cellphone attachment using custom-designed trays (i.e., mechanical adapters specific to each RDT type – see e.g., Fig. 1(a)). This enables different types of RDTs to be evaluated on the same smart reader without any modification to the base of the main platform. Moreover, our custom-designed RDT application running on the cellphone can automatically identify the type of the RDT that is inserted, among a set of preprogrammed RDTs (see Figure 5) and permits software updates to digitally recognize additional RDT types when they are needed or become available.
Fig. 5.
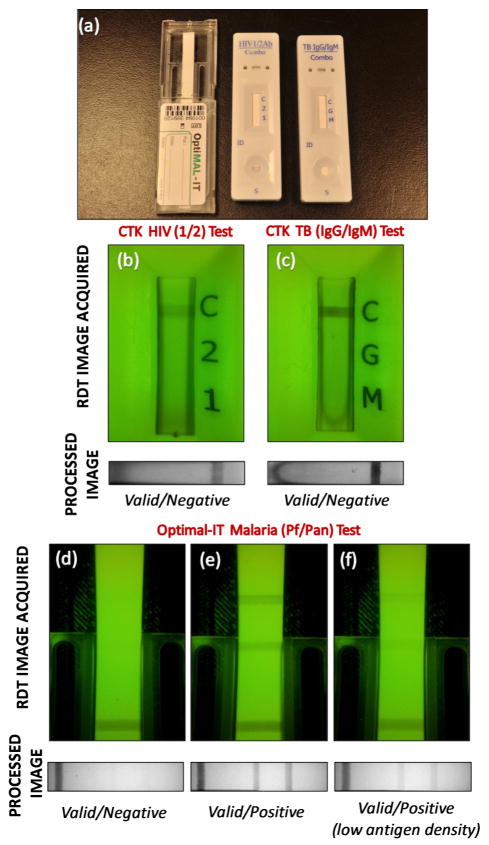
(a) Rapid-diagnostic-tests (RDTs) used in this study. Left: Optimal-IT P. falciparum-specific and Pan-specific Malaria Test. Middle: CTK HIV 1/2 Ab PLUS Combo Test. Right: CTK TB IgG/IgM Combo Test. (b) HIV 1/2 Combo RDT has a control reagent line indicating the validity of the test, and two pre-deposited antigen (HIV-1 and HIV-2) coated lines indicating the infections. (c) TB IgG/IgM Combo RDT is also a lateral-flow based immunoassay for simultaneous detection and differentiation of IgM anti-Mycobacterium Tuberculosis (M.TB) and IgG anti-M.TB in human serum or whole blood. Digitally processed reflection images of RDTs which are activated by fresh whole blood samples and their automated decisions are shown below the raw RDT images (b and c) acquired by our RDT reader platform. Optimal-IT Malaria RDT (d, e, and f) detects Plasmodium antigens (pLDH) using monoclonal antibodies. We imaged (in reflection) a malaria test that was activated using human blood (d) and was analyzed by our RDT application running on the cellphone. Moreover, we tested malaria RDTs using positive control wells which are previously coated by recombinant antigens of P. falciparum. In reflection mode, we imaged these RDTs that were activated using recommended malaria antigen densities (e), yielding a positive test result as expected, as well as using highly diluted antigens (f), i.e., beyond the recommended values. Refer to Figure 6 for further details.
Over the last few years there has also been a considerable effort focused toward the development of digital test readers which are capable of objective and quantitative analysis of RDTs, e.g., lateral flow strips, dipsticks, cassette tests, or pads.24–36 As a result, several commercial product lines have already been introduced, including LFDR101 Reader (Forsite Diagnostics Ltd, UK), ESEQuant Lateral Flow System (QIAGEN, CA, USA), RDS-1000 (Detekt Biomedical L.L.C., TX, USA), and DOA Test Reader (GenPrime, WA, USA). However, these existing digital test readers are still relatively bulky and costly; and more importantly they work with only a limited number of RDTs from a given manufacturer, which limits their wide-scale deployment and use, especially in resource scarce settings.
On the other hand, our integrated RDT reader platform is a compact (~65 grams) and cost-effective alternative, capable of handling various types of RDTs from different manufacturers/vendors. For this end, using the camera module of the cellphone as well as its micro-processors creates a very efficient and cost-effective solution for any type of RDT (with various sizes and shapes) since imaging and signal processing provide the flexibility to digitize and automatically read different RDT types on the same cellphone platform. Moreover, it allows users to be part of a global network and browse through a real-time database of RDT results even in remote locations. Therefore, our RDT reader platform running on a cellphone does not only provide a complementary effort toward the development of inexpensive and mobile digital test readers, but also serves as a smart communication tool to connect health-care professionals and policy makers through a global network.
We tested this cellphone enabled RDT reader platform using malaria, tuberculosis as well as HIV tests by installing it on both Android based smart-phones as well as an iPhone (see Fig. 1 and the Supplementary Figures). We should emphasize that in our design, rather than capturing simple images of the RDTs using the cellphone camera under e.g., sunlight or room light, we created a specific add-on which had its own illumination and mechanical interface. This is quite important to increase the measurement repeatability and avoid reading errors due to illumination and field-of-view variations or tilts, all of which are now almost entirely eliminated in our cost-effective design shown in Fig. 1.
This smart digital interface, which can automatically recognize, read and digitally store various types of RDTs, could be quite useful to reduce manual test reading errors and confusions arising due to simultaneous use of various RDTs, each of which might have different standards for control and positive/negative lines. Digitizing and quantifying the test results are also important since the colour changes in RDTs would not last more than a few hours in field conditions, which makes physical storage of these tests not feasible, unless it is in digital format as implemented in our platform. Finally, offering real-time spatio-temporal statistics for the prevalence of various infectious diseases, this integrated RDT reader running on cellphones could assist health-care professionals and policy makers to rapidly track emerging epidemics worldwide and help epidemic preparedness.
Methods
Design of Smart RDT Reader Hardware
We used a Samsung Galaxy S II as the starting base cellphone of our RDT reader platform (see Fig. 1). This Android phone utilizes a 1.2 GHz Dual Core (Samsung Exnyos C210) processor and an 8 MPixel color camera module which has a built-in lens with an F/2.7 aperture and a focal length of ~ 4.00 mm. We should emphasize that our test reader platform can be easily implemented on various other cellphones with minor modifications to its architecture such that it is independent of the operating system and the specific cellphone hardware. See for example Supplementary Figure 1 for another lower-end Android phone (Samsung Galaxy Fit GT-S5670) implementation and Supplementary Figure 2 for an iPhone implementation of the same RDT reader design.
Mechanical body of the RDT reader attachment (see Fig. 1(c)) was built using a 3-D printer which uses ABSplus™ modelling material, a recyclable and eco-friendly thermoplastic. Considering the varying dimensions of different RDT types, customized test trays (see Fig. 1(a)) are also designed to accommodate different diagnostic tests, fitting to the same base cellphone attachment.
In this attachment to the cellphone, weighing ~65 grams including AAA batteries, we utilized an inexpensive planoconvex lens with a focal length of ~15 mm placed in front of the existing lens of the cellphone camera module. This imaging geometry provides an optical demagnification factor of 15/4 = 3.75 between the diagnostic test plane and the CMOS image sensor plane of the cellphone. This demagnification factor can be tuned, if needed, by simply changing the focal length of the external lens of the RDT attachment. Note that for digital image processing of the RDT results on the cellphone, this optical demagnification factor together with the pixel size of the CMOS imager (e.g., ~1–2 μm) are the key factors to effect spatial sampling of RDT test lines. As expected, the overall magnification of the visualisation system, which also depends on the cellphone screen size is not relevant for automated analysis of RDT results.
In order to achieve high contrast imaging performance using this attachment prior to post-processing of the recorded RDT images, we utilized diffused LED arrays (754–1185-5-ND, Digi-key, USA) with a peak wavelength of 565 nm. This wavelength was experimentally optimized by spectral measurements on malaria RDTs (Optimal-IT P. falciparum-specific and Pan-specific Malaria Tests, Bio-Rad Laboratories, Inc., CA, USA37–39) to achieve highest contrast for both the control and test lines. Such target lines of various RDTs (see e.g., Fig. 5) are formed by immobilized colloidal gold-labelled antibody - antigen (i.e., analyte) complexes, such that they exhibit similar spectral properties. For other RDT types that do not use colloidal gold, this illumination wavelength can be further tuned to provide improved imaging performance.
To faithfully image various diagnostics tests with different formats (e.g., dipsticks, cassettes, strips, cards, or pads) our RDT reader attachment permits reflection as well as transmission imaging of RDTs using three diffused LED bars (see Fig. 1(d)). Two of these LED bars are located underneath the RDT plane, ensuring uniform illumination of the target test which can be loaded to the attachment with customized trays. Reflection mode is practical and useful for most test formats including cassette-type RDTs which have a plastic housing protecting lateral flow pad with a window on one side as well as strip tests without any protection housing (see Supplementary Figs. 1(c–d)). In addition to reflection imaging, another diffused LED array is located on the top of the RDT tray to record transmission images (see Fig. 1(d)). This top illumination brings flexibility to the user to obtain both transmission and reflection images of RDTs while working with strip-based tests (see Supplementary Fig. 1(d) and Supplementary Fig. 3). Powered by two AAA batteries, these reflection and transmission illumination LED arrays are controlled by a physical switch located on the side of the attachment (see Fig. 1(b)) or potentially through the audio jack of the cellphone (if it is available).
Implementation of RDT Reader Application on the Cellphone
We also developed a cellphone application (see Fig. 2) to digitally record RDT images and rapidly evaluate test results within < 0.2 sec per test on the cellphone unit. Once the RDT image is captured using the attachment described in Fig. 1, this application runs a custom-developed digital image processing algorithm (see Fig. 3) to generate a test evaluation form consisting of test validation (Valid/Invalid) and assessment of the diagnostic results (Positive/Negative) for each test. Using wireless communication (e.g., Wi-Fi, GSM, CDMA, etc.), the same application uploads the test form together with other necessary information (with a total size of less than 0.05 Mbytes per test) to a global database which is running on our servers (see e.g., Fig 2(e)). In case wireless connectivity is lost, the test results can be also stored in the internal memory of cellphone and be automatically transferred to our servers when wireless connection is recovered.
This RDT reader application that is illustrated in Fig. 2 operates as follows:
The RDT application starts with a log-in/sign-in screen (Fig. 2(a)) where the user fills in the form with their credentials, creating an HTTP POST to the server. Running Rails 3.0.9, our global server verifies the authenticity of the user and is based on a MySQL 2 database40–41. If authentication succeeds, the server finds the user in its database and returns to the necessary cookies with their user information.
The user is presented with the application menu (Fig. 2(b)) where they can analyze new diagnostics tests, browse through a real-time SQLite database of tests or set preferences for the application42.
If user selects to image a new test, a pull-down menu of pre-configured RDTs pops up (Fig. 2(c)) and the user can browse and decide on the test kit.
When the user decides on a new test to be evaluated, cellphone application accesses and powers on the back facing camera of the phone and the user decides whether they want to turn on the transmission or reflection illumination LED arrays. When the cartridge is all the way in, the application starts grabbing frames from the camera and displays them on the cellphone screen. If the user wants to diagnose the RDT, they touch the screen to capture an image of the RDT to be analysed (Fig. 2(d)).
This digitally captured RDT image is then converted into a grayscale matrix which is analysed by an identification algorithm to determine the type of test being captured, unless the user has already specified its type. Once the test type is determined, the phone analyses the grayscale matrix for test features (Control and Test lines) specific for this particular test type. After extracting and diagnosing test features, the application displays an evaluation form (Fig. 2(e)) including an automatically generated test report (Valid/Invalid and Negative/Positive) as well as patient age, sex, expert comments, etc. which can be manually entered. The user can then decide to upload the completed form and the processed image of the RDT to the server, or save it onto the phone’s local memory for transmission later on. If the results are sent to the server, the server checks the credentials of the user and saves the new data into its mySQL database.
The user can also reach the real-time RDT monitoring database running on the local server and browse through a global map of previously uploaded test results. The server displays the test data on an internet browser using Google Maps and can filter the data displayed based on several attributes, including: disease type, test location and time/date, RDT type/manufacturer, patient age, etc. The users can access this real-time monitoring platform through the same cellphone application (see Fig. 2(f)) or using a personal computer with internet connection (see Fig. 4).
The same cellphone application can also quantify the test line color intensity which can be correlated to the level of antigen density (see Fig. 2(g)).
Automated RDT Image Processing on the Cellphone
In order to decrease the number of operations needed to extract relevant spatial test features and utilize the information embedded in grayscale pixel intensity of each RDT image, our first step is to convert the acquired RDT images from 3-channel YUV420 scale to grayscale. We then process the resulting grayscale image to extract the locations and relative intensities of the lines on the RDT strip (Fig. 3). Initially the boundaries of the RDT lateral flow area are found, and the flow area is clipped out from the rest of the image. We then take the average column pixel intensity per row, such that if the original grayscale image is a [R, C] matrix, we end up with a [R, 1] column vector, each element in the vector being the average value of the pixels in the corresponding row of the grayscale (single channel) image.
Next, in the case of Optimal-IT Malaria RDT37–39, the maximum value of the average column pixel intensity per row vector is taken and every pixel that is less than 90% of this value is zeroed in order to remove the parts of the image which do not carry any useful information such as the background. This leaves us with only non-zero values for pixels that are part of the RDT strip itself. The original grayscale image is taken and cropped by a rectangle that starts and ends at the rows where the threshold vector is non-zero. The strip stretches across the entire width of the image, so that the cropped rectangle has an equal amount of columns as the acquired image. The image is then saved to the private file-space of the cellphone, to be uploaded to a server for data mining.
In the case of the CTK TB (Tuberculosis) and HIV RDTs43–45 (HIV 1/2 Ab PLUS Combo Rapid Tests and TBIgG/IgM Combo Rapid Tests, CTK Biotech Inc., CA, USA), the [R,1] average column pixel intensity per row vector is obtained from the image after first discarding 20% of the columns taken from both ends to avoid spatial artefacts. Then, the absolute value of the derivative of the average column pixel intensity per row vector is calculated to locate the rows that the strip lies on. Because of the acceleration in pixel values as we go down the rows of the image, they occur right before and right after the target flow area. The original grayscale image is then digitally cropped across the appropriate rows, and finally saved to the private file-space of the smart-phone, to later be uploaded to a server for data mining.
Once the flow areas of the RDTs are obtained, they are processed to get the locations of the control and infection lines. This is done by first creating a row vector obtained by averaging the pixel values along the columns of the image of flow areas. The local maxima of the row vector indicate the positions of the lines.
To better handle detection noise and spatial non-uniformities on the RDT surface, a central moving averaging operation46 is also performed on the row vectors to get rid of high-frequency spatial noise. Since the lighting of the strip may not always be 100% uniform, the vector is subtracted from its convex hull. Then the highest peak is found and anything less than 10% of it is zeroed out.
For the final decision, first the presence of a control line is checked at the location where it is known to be. If it is present, the test is valid, and otherwise it is labelled as an invalid test. If the test is valid, the locations of the infection-indicating lines are then checked to determine the result of the test (i.e., positive or negative). Note that for different RDT types, from various manufacturers, minor modifications of the above discussed processing flow could be needed to handle variations in the design and packaging of different types of tests.
Results and Discussions
We validated the performance of our cellphone based smart RDT reader by imaging several lateral flow based RDTs including Optimal-IT P. falciparum-specific and Pan-specific Malaria Tests37–39 (Bio-Rad Laboratories, Inc., CA, USA), HIV 1/2 Ab PLUS Combo Rapid Tests as well as TB IgG/IgM Combo Rapid Tests43–45 (CTK Biotech Inc., CA, USA). In order to activate malaria tests, we used OptiMAL positive control wells (Bio-Rad Laboratories, Inc., CA, USA) containing recombinant antigens (LDH) of P. falciparum (see Fig. 5).
Following the manufacturer’s instructions, Malaria, HIV and TB RDTs were tested using whole blood samples (see Fig. 5). Prior to imaging experiments, test results were verified by visual inspection, and our cellphone based imaging experiments were repeated more than 10 times in order to validate repeatability of measurements. Although some lateral flow artefacts were visually observed in some cases (see Fig. 5(c)), our RDT reader application provided the correct results in all tests. Considering the possibility of such manufacturing related artefacts and/or incorrect human reading of RDTs in field conditions, digital and automated RDT evaluation using our smart reader might help to achieve higher efficiency and accuracy.
We also tested Malaria RDTs using OptiMAL positive control wells which contain recombinant antigens (LDH) of P. falciparum. These tests were activated based on the instructions provided by the manufacturer, and P. falciparum-specific as well as Pan-specific (P. Falciparum, P. Vivax, P. Ovale and P. malariae) reagent lines were clearly observed and evaluated as positive by the smart RDT application running on the cellphone (see e.g., Fig. 5(e)).
To further shed light on the performance of our cellphone based RDT reader shown in Fig. 1, we also imaged and automatically evaluated Optimal-IT P. falciparum and Pan- Malaria RDTs37–39 that were activated with highly diluted positive control antigen samples (see e.g., Fig. 5(f)). Pan-Malaria specific antigens that are previously deposited inside the control wells were released by mixing with sample diluents provided by the manufacturer. In our experiments, we started with an initial concentration of Positive Control Well Antigen (PCWA)/20μl, which is the “recommended” dilution level by the manufacturer. Next we diluted it by 2, 3, and 4 times to create lower concentration levels of PCWA/40μl (2x dilution), PCWA/60μl (3x dilution), and PCWA/80μl (4x dilution), respectively.
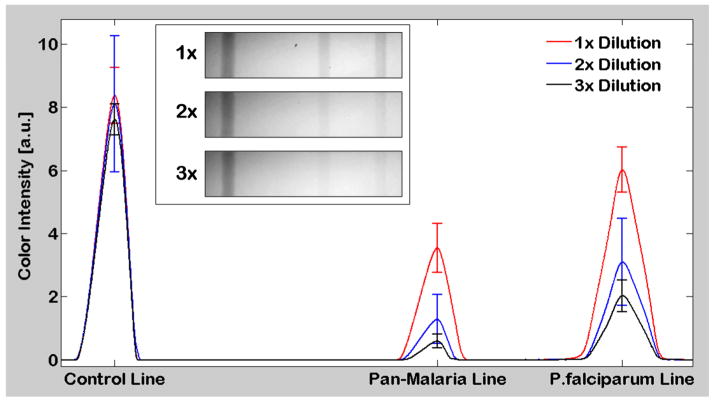
We conducted 10 RDT measurements for each one of these concentration levels (i.e., 40 measurements total). In these experiments, our cellphone platform correctly analyzed (yielding Valid & Positive) all the Malaria RDTs that were activated with PCWA/20μl, PCWA/40μl as well as PCWA/60μl. However, our accuracy dropped down to ~60% for PCWA/80μl (i.e., at 4X lower concentration compared to the suggested dilution level) which is due to the low antigen density and the corresponding weak color intensity. In Fig. 6, we provide the average cross-sectional intensity profiles of these RDT strips for PCWA/20μl, PCWA/40μl as well as PCWA/60μl. In these results, it is important to emphasize that the cross-sectional intensity of the control line has no correlation with the density of the malaria antigens as it indicates only the validity of the RDT. On the other hand, we observed higher average intensity on P. Falciparum infection line compared to the average intensity of the Pan-Malaria infection line for all the concentration levels. This is expected since P. Falciparum lines were pre-deposited by only P. Falciparum specific antibodies, whereas Pan-malaria lines are specific to all four kinds of Plasmodium (Malaria) species (P. falciparum, P. vivax, P. ovale and P. malariae), exhibiting weaker response compared to the P. Falciparum test line. These results highlight the sensitivity of our platform to differentiate such minor variations (in response to analytes) which are quite difficult to observe and quantify during visual examination of RDTs by humans, especially under varying illumination and imaging conditions that might occur in field conditions.
Fig. 6.
Cross-sectional analysis of automatically processed malaria RDT images captured in reflection mode. The RDT reader shown in Fig. 1(a) was used to evaluate Malaria RDTs activated with 3 different batches of Positive Control Well Antigen (PCWA) at dilution levels of PCWA/20μl (1x), PCWA/40μl (2x), PCWA/60μl (3x). The above figure illustrates the mean of 10 pre-processed RDT image cross-sections (for each dilution level) and the standard deviation of maximum peak values of each test line. Mean and standard deviation values of the Control, Pan-Malaria, and P. Falciparum lines of the 1x dilution level are 8.37, 3.54, 6.02; 0.89, 0.77, and 0.72, respectively. Mean and standard deviation values of the Control, Pan-Malaria, and P. Falciparum lines of the 2x dilution level are 8.11, 1.29, 3.10; 2.10, 0.77, and 1.38, respectively. Mean and standard deviation values of the Control, Pan-Malaria, and P. Falciparum lines of the 3x dilution level are 7.62, 0.60, 2.03; 0.50, 0.22, and 0.51, respectively. Exemplary cellphone images of RDTs for each dilution level are also shown in the inset.
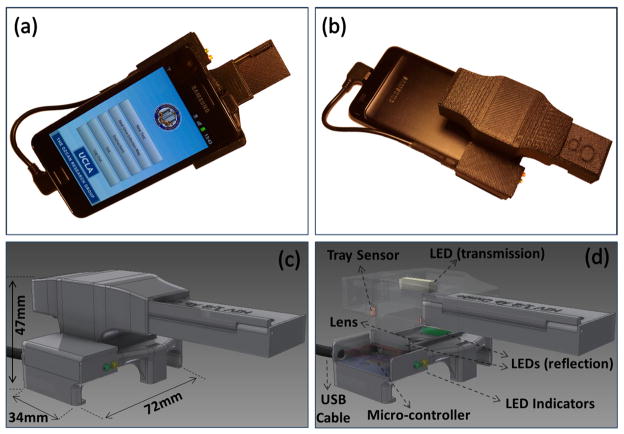
In our results presented so far, we used 2 AAA batteries to power up the smart RDT reader that is attached to the cellphone. While this is quite convenient in general, it may also be useful in certain settings to entirely rely on the cellphone battery for operating the RDT reader, without the need for external batteries. To implement such an RDT reader on the cellphone, we also designed an interface that uses a USB cable to power up the illumination LEDs that are used in our reader design through the cellphone battery (see Fig. 7). The same smart interface also includes two indicator LEDs that are used to alert: (1) if the attachment is successfully powered through the cellphone; and (2) if the RDT is properly loaded into the reader and is ready for image capture.
Fig. 7.
A smart RDT reader prototype (attached to Samsung Galaxy S II) which is entirely powered by the cell-phone battery through a USB connection. Controlled through a cost-effective micro-controller, two LED indicators are also used in this design to automatically detect (i) if the attachment is successfully powered through USB; and (ii) if the RDT is properly loaded into the reader and is ready to be imaged.
Finally, we would like to also note that the RDT images that are uploaded to our servers (see e.g., Fig. 2(e)) can also serve us to identify possible duplicate uploads of the same test by e.g., examining the pixel values of uploaded images. Once identified as the same test image, duplicate entries can be deleted or merged at the server side by e.g., an authorized superuser/root.
Conclusions
We demonstrated a cellphone based RDT reader platform that can work with various lateral flow immuno-chromatographic assays to sense the presence of a target analyte in test samples. This compact and cost-effective RDT reader, weighing only ~65 grams, mechanically attaches to the existing camera unit of a cellphone, where various types of RDTs can be inserted to be imaged in reflection or transmission. Captured raw images of these lateral flow immuno-chromatographic assays are then digitally processed through a smart application running on the cellphone for validation of the RDT as well as for automated reading of its diagnostic result. The same smart application running on the cellphone then transmits the resulting data, together with the processed RDT images and other related text information to a central server, which presents the diagnostic results on a world-map through geo-tagging. We demonstrated the success of this platform using malaria, tuberculosis as well as HIV RDTs by installing it on both Android based smart-phones and an iPhone. Providing real-time spatio-temporal statistics for the prevalence of various infectious diseases, this smart RDT reader platform running on cellphones could assist health-care professionals and policy makers to combat emerging epidemics worldwide.
Supplementary Material
Acknowledgments
A.O. gratefully acknowledges the support of the Presidential Early Career Award for Scientists and Engineers (PECASE), ARO Young Investigator Award, NSF CAREER Award, ONR Young Investigator Award and the NIH Director’s New Innovator Award DP2OD006427 from the Office of The Director, NIH.
Notes and references
- 1.Banoo S, Bell D, Bossuyt P, Herring A, Mabey D, et al. Nat Rev Microbio. 2006;4:21–31. [Google Scholar]
- 2.Vasoo S, Stevens J, Singh K. Clin Infect Dis. 2009;49:1090–1093. doi: 10.1086/644743. [DOI] [PMC free article] [PubMed] [Google Scholar]
- 3.Mills LA, Kagaayi J, Shott JP, Newell K, Bwanika JB, Ssempijja V, Aluma S, Quinn TC, Reynolds SJ, Gray RH. Trans R Soc Trop Med Hyg. 2010;104(3):237–239. doi: 10.1016/j.trstmh.2009.07.030. [DOI] [PMC free article] [PubMed] [Google Scholar]
- 4.Wongsrichanalai C, Barcu MJ, Muth S, Sutamihardja A, Wernsdorfer WH. Am J Trop Med Hyg. 2007;77:119–127. [PubMed] [Google Scholar]
- 5.Dhorda M, Piola P, Nyehangane D, Tumwebaze B, Nalusaji A, Nabasumba C, Turyakira E, McGready R, Ashley E, Guerin PJ, Snounou G. Am J Trop Med Hyg. 2012;86(1):93–95. doi: 10.4269/ajtmh.2012.10-0631. [DOI] [PMC free article] [PubMed] [Google Scholar]
- 6.Okeke IN, Peeling RW, Goossens H, Auckenthaler R, Olmsted SS, de Lavison JF, Zimmer BL, Perkins MD, Nordqvist K. Drug Resist Updat. 2011;14(2):95–106. doi: 10.1016/j.drup.2011.02.002. [DOI] [PubMed] [Google Scholar]
- 7.Drakeley C, Reyburn H. Trans R Soc Trop Med Hyg. 2009;103(4):333–337. doi: 10.1016/j.trstmh.2008.10.003. [DOI] [PubMed] [Google Scholar]
- 8.Murray CK, Gasser RA, Jr, Magill AJ, Miller RS. Clin Microbiol Rev. 2008;21(1):97–110. doi: 10.1128/CMR.00035-07. [DOI] [PMC free article] [PubMed] [Google Scholar]
- 9.Wu SL, Paxton H, Hanson B, Kung CG, Chen TB, Rossi C, Vaughn DW, Murphy GS, Hayes CG. Clin Diagn Lab Immunol. 2000;7(1):106–110. doi: 10.1128/cdli.7.1.106-110.2000. [DOI] [PMC free article] [PubMed] [Google Scholar]
- 10.Lien TX, Tien NT, Chanpong GF, Cuc CT, Yen VT, Soderquist R, Laras K, Corwin A. Am J Trop Med Hyg. 2000;62(2):301–309. doi: 10.4269/ajtmh.2000.62.301. [DOI] [PubMed] [Google Scholar]
- 11.Skarbinski J, Ouma PO, Causer LM, Kariuki SK, Barnwell JW, Alaii JA, de Oliveira AM, Zurovac D, Larson BA, Snow RW, Rowe AK, Laserson KF, Akhwale WS, Slutsker L, Hamel MJ. Am J Trop Med Hyg. 2009;80(6):919–926. [PubMed] [Google Scholar]
- 12.Yager P, Edwards T, Fu E, Helton K, Nelson K, Tam MR, Weigl BH. Nature. 2006;442:412–418. doi: 10.1038/nature05064. [DOI] [PubMed] [Google Scholar]
- 13.Sia SK, Linder V, Parviz BA, Siegel A, Whitesides GM. Angew Chem, Int Ed. 2004;43:498–502. doi: 10.1002/anie.200353016. [DOI] [PubMed] [Google Scholar]
- 14.Martinez AW, Philips ST, Carrilho E, Thomas SW, III, Sindi Hayat, Whitesides GM. Anal Chem. 2008;80:3699–3707. doi: 10.1021/ac800112r. [DOI] [PMC free article] [PubMed] [Google Scholar]
- 15.Zhu H, Sikora U, Ozcan A. Analyst. 2012 doi: 10.1039/C2AN35071H. [DOI] [PMC free article] [PubMed] [Google Scholar]
- 16.Zhu H, Mavandadi S, Coskun AF, Yaglidere O, Ozcan A. Anal Chem. 2011;83(17):6641–6647. doi: 10.1021/ac201587a. [DOI] [PMC free article] [PubMed] [Google Scholar]
- 17.Zhu H, Yaglidere O, Su T, Tseng D, Ozcan A. Lab Chip. 2011;11:315–322. doi: 10.1039/c0lc00358a. [DOI] [PMC free article] [PubMed] [Google Scholar]
- 18.Tseng D, Mudanyali O, Oztoprak C, Isikman SO, Sencan I, Yaglidere O, Ozcan A. Lab Chip. 2010;10:1787–1792. doi: 10.1039/c003477k. [DOI] [PMC free article] [PubMed] [Google Scholar]
- 19.Mudanyali O, Tseng D, Oh C, Isikman SO, Sencan I, Bishara W, Oztoprak C, Seo S, Khademhosseini B, Ozcan A. Lab Chip. 2010;10:1417–1428. doi: 10.1039/c000453g. [DOI] [PMC free article] [PubMed] [Google Scholar]
- 20.McKiernan G. Searcher. 2010;18(3):48–51. [Google Scholar]
- 21.Schatz BR, Berlin RB. Healthcare Infrastructure: Health Informatics. Springer; London: 2011. [Google Scholar]
- 22.Belew R. Finding Out About: A Cognitive Perspective on Search Engine Technology and the WWW. Cambridge University Press; New York, USA: 2000. [Google Scholar]
- 23.Adler R. Health Care Unplugged: The Evolving Role of Wireless Technology. California HealthCare Foundation; 2007. [Google Scholar]
- 24.Hurling R, Catt M, Boni MD, Fairley BW, Hurst T, Murray P, Richardson A, Sodhi JS. J Med Internet Res. 2007;9(2):e7. doi: 10.2196/jmir.9.2.e7. [DOI] [PMC free article] [PubMed] [Google Scholar]
- 25.Kim S, Park J. Biotechnology And Bioprocess Engineering. 2004;9:127–131. [Google Scholar]
- 26.Faulstich K, Gruler R, Eberhard M, Lentzsch D, Haberstroh K. In: Lateral Flow Immunoassay. Wong R, Tse H, editors. Humana Press; New York: 2009. pp. 75–94. [Google Scholar]
- 27.Corstjens PLAM, Li S, Zuiderwijk M, Kardos K, Abrams WR, Niedbala RS, Tanke HJ. Nanobiotechnology IEE Proceedings. 2005;152:64–72. doi: 10.1049/ip-nbt:20045014. [DOI] [PubMed] [Google Scholar]
- 28.Lee D, Jeon BG, Ihm C, Park J, Jung MY. Lab Chip. 2011;11:120–126. doi: 10.1039/c0lc00209g. [DOI] [PubMed] [Google Scholar]
- 29.Li JJ, Ouellette AL, Giovangrandi L, Cooper DE, Ricco AJ, Kovacs GT. IEEE Trans Biomed Eng. 2008;55:1560–1571. doi: 10.1109/TBME.2007.914674. [DOI] [PubMed] [Google Scholar]
- 30.Kuswandia B, Nurimana, Huskensb J, Verboomb W. Analytica Chimica Acta. 2007;601:141–155. doi: 10.1016/j.aca.2007.08.046. [DOI] [PubMed] [Google Scholar]
- 31.Jianchun M, Qing Y, Wenyuan Z, Wangwei H, Jianguo T. International Conference on Electronic Measurement & Instruments (ICEMI) 2011;1:201–204. [Google Scholar]
- 32.Huang L, Zhou L, Zhang Y, Xie C, Qu J, Zeng A, Huang H, Yang R, Wang X. IEEE Sensors Journal. 2009;9:1185–1191. [Google Scholar]
- 33.Wongwilai W, Lapanantnoppakhun S, Grudpan S, Grudpan K. Talanta. 2010;81:1137–1141. doi: 10.1016/j.talanta.2010.01.058. [DOI] [PubMed] [Google Scholar]
- 34.Hanes R, Borich D. Journal of Commercial Biotechnology. 2009;15:347–359. [Google Scholar]
- 35.Li Z, Wang Y, Wang J, Tang Z, Pounds JG, Lin Y. Anal Chem. 2010;82:7008–7014. doi: 10.1021/ac101405a. [DOI] [PubMed] [Google Scholar]
- 36.Lee D, Jung MY, Jeon BG, Sohn M. IEEE Sensors. 2010:1411–1414. [Google Scholar]
- 37.Pattanasin S, Proux S, Chompasuk D, Luwiradaj K, Jacquier P, Looareesuwan S, Nosten F. Trans R Soc Trop Med Hyg. 2003;97(6):672–674. doi: 10.1016/s0035-9203(03)80100-1. [DOI] [PubMed] [Google Scholar]
- 38.Moody AH, Chiodini PL. British Journal of Biomedical Science. 2002;59(4):228–231. doi: 10.1080/09674845.2002.11783665. [DOI] [PubMed] [Google Scholar]
- 39.Moody A. Clin Microbiol Rev. 2002;15(1):66–78. doi: 10.1128/CMR.15.1.66-78.2002. [DOI] [PMC free article] [PubMed] [Google Scholar]
- 40.Bradski G, Kaehler A. Learning OpenCV, Computer Vision with the OpenCV Library. O’Reilly; Sebastopol, CA, USA: 2008. [Google Scholar]
- 41.Laganière R. OpenCV 2 Computer Vision Application Programming Cookbook. Packt Publishing; Birmingham, UK: 2011. [Google Scholar]
- 42.Kreibich JA. Using SQLite. O’Reilly; Sebastopol, CA, USA: 2010. [Google Scholar]
- 43.Mahendradas P, Ranganna SK, Shetty R, Balu R, Narayana KM, Babu RB, Shetty BK. Ophthalmology. 2008;115(2):287–291. doi: 10.1016/j.ophtha.2007.03.085. [DOI] [PubMed] [Google Scholar]
- 44.Alam MS, Mohon AN, Mustafa S, Khan WA, Islam N, Karim MJ, Khanum H, Sullivan DJ, Jr, Haque R. Malar J. 2011;10:175. doi: 10.1186/1475-2875-10-175. [DOI] [PMC free article] [PubMed] [Google Scholar]
- 45.Jamil KM. In: Kala Azar in South Asia: Current Status and Challenges Ahead. Jha TK, Noiri E, editors. Springer; Netherlands: 2011. [Google Scholar]
- 46.Russ JC. The Image Processing Handbook. CRC Press; FL, USA: 2011. [Google Scholar]
Associated Data
This section collects any data citations, data availability statements, or supplementary materials included in this article.


