

Abstract
Transglutaminase 2 (TG2) is expressed ubiquitously, has multiple physiological functions and has also been associated with inflammatory diseases, neurodegenerative disorders, autoimmunity and cancer. In particular, TG2 is expressed in small intestine mucosa where it is up-regulated in active coeliac disease (CD). The aim of this work was to investigate the induction of TG2 expression by proinflammatory cytokines [interleukin (IL)-1, IL-6, tumour necrosis factor (TNF)-α, interferon (IFN)-γ and IL-15] and the signalling pathways involved, in human epithelial and monocytic cells and in intestinal tissue from controls and untreated CD patients. Here we report that IFN-γ was the most potent inducer of TG2 expression in the small intestinal mucosa and in four [Caco-2, HT-29, Calu-6 and human acute monocytic leukaemia cell line (THP-1)] of five cell lines tested. The combination of TNF-α and IFN-γ produced a strong synergistic effect. The use of selective inhibitors of signalling pathways revealed that induction of TG2 by IFN-γ was mediated by phosphoinositide 3-kinase (PI3K), while c-Jun N-terminal kinase (JNK) and p38 mitogen-activated protein kinase (MAPK) were required for TNF-α activation. Quantitative polymerase chain reaction (PCR), flow cytometry and Western blot analysis showed that TG2 expression was blocked completely when stimulation by either TNF-α or IFN-γ was performed in the presence of nuclear factor (NF)-κB inhibitors (sulphasalazine and BAY-117082). TG2 was up-regulated substantially by TNF-α and IFN-γ in intestinal mucosa in untreated CD compared with controls. This study shows that IFN-γ, a dominant cytokine in intestinal mucosa in active CD, is the most potent inducer of TG2, and synergism with TNF-α may contribute to exacerbate the pathogenic mechanism of CD. Selective inhibition of signalling pathways may be of therapeutic benefit.
Keywords: coeliac disease, IFN-γ, inflammation, transglutaminase 2
Introduction
Transglutaminases are enzymes that catalyse, in a calcium-dependent manner, the cross-linking of proteins by ε-(γ-glutamyl) lysine isopeptide bonds, creating highly cross-linked protein complexes, or alternatively the deamidation of specific glutamine residues in the absence of suitable amine acceptors. Although their primary structure is not conserved, different transglutaminases have the same amino acid sequence at their active sites [1]. Tissue transglutaminase 2 (TG2) (EC 2·3.2·13) is the best-studied member of this family because of its multiple biological activities including, as a G protein, cell surface adhesion adaptor, disulphide isomerase and serine/threonine kinase [2],[3]. The sequence of the complete TG2 gene obtained from the human intestinal epithelial cell line Caco-2 published by us in the National Institutes of Health (NIH) database [4], codifies for a protein of 687 amino acids long. TG2 acts as a monomer and has two closely located binding regions, one for Ca2+ and one for GTP, as TG2 also has GTPase activity. TG2 is expressed ubiquitously and has multiple physiological functions in processes such as blood clotting, wound healing, cell adhesion, cell signalling and apoptosis, among others [1]–[3]. TG2 has also been associated with pathological conditions, mainly inflammatory diseases such as encephalomyelitis and inflammatory myopathies, and neurodegenerative disorders such as Alzheimer's, Parkinson's and Huntington's diseases, as well as various types of cancer [5]–[7].
TG2 is involved at different molecular levels in the pathological processes of these disorders, associated mainly with protein cross-linking or deamidation, as well as regulation of apoptosis. In particular, TG2 plays a critical role in the pathogenesis of coeliac disease (CD), because it is able to deamidate glutamine residues present in toxic proteins from wheat and related cereals. The deamidation of glutamine at selective positions leads to higher-affinity binding of deamidated peptides to human leucocyte antigen (HLA) proteins encoded by the CD predisposing alleles DQ2 (A1*0501, B1*0201) and DQ8 (A1*0301, B1*0302), and also to a higher gliadin-specific T cell stimulation [8]–[10].
The TG2 gene is regulated by the canonical nuclear factor (NF)-κB pathway in several cell lines, and it has been reported that in cancer and microglial cells TG2 can activate NF-κB by blocking the inhibitor function of IκBα via polymer formation [11]. Consequently, there is a complex cross-regulation between TG2 activity and the NF-κB pathway, a mechanistic link that can be observed in inflammation and cancer. TG2 expression in human liver cells [12], intestinal epithelial cells [13] and rat small intestine cells [14] can be induced by proinflammatory cytokines such as interleukin (IL)-1, tumour necrosis factor (TNF)-α and interferon (IFN)-γ, thus amplifying the inflammatory cascade. Therefore, the development of specific TG2 inhibitors with reduced in-vivo toxicity could represent a novel therapeutic approach with the aim of modulating TG2 activity and reduce, or even abolish, the disease processes where the enzyme activity is dysregulated [15]. To this end, more detailed information about the biology and molecular regulation of the TG2 gene in inflammatory settings is needed.
In this study, we evaluated the regulation of the TG2 expression by proinflammatory cytokines in different cell lines and particularly in the intestinal mucosa. We found that IFN-γ is the most potent inducer of TG2 expression, and acts synergistically with TNF-α. Using different inhibitors we also identified the signalling pathways used by each cytokine for TG2 up-regulation.
Materials and methods
Cell culture and treatments
Five human cell lines from different cell lineages were used: intestinal epithelial cells: Caco-2 (Caucasian, colon, adenocarcinoma) and HT29 (Caucasian, colon, adenocarcinoma, grade II); lung epithelial cells: A549 (Caucasian, lung, carcinoma) and CALU-6 (Caucasian, lung, adenocarcinoma); and a monocyte-like cell line: human acute monocytic leukaemia cell line (THP-1). Cells were incubated with cytokines alone or with the addition of inhibitors for different time-periods (from 45 min to 48 h). Cytokine treatments were as follows: TNF-α 10 ng/ml (RTNFA1; Endogen, Woburn, MA, USA), IFN-γ 200 UI/ml (554617; Becton Dickinson, Franklin Lakes, NJ, USA), IL-1 10 ng/ml (551838; Becton Dickinson), IL-6 10 ng/ml (354075; Becton Dickinson) and IL-15 20 ng/ml (554630; Becton Dickinson). In some cases inhibitors of signalling pathways were used: SP600125 20 µM [c-Jun N-terminal kinase (JNK)], SB203580 10 µM [p38-mitogen-activated protein kinase (MAPK)], wortmannin 10 µM [phosphoinositide 3-kinase (PI3K)] (from Calbiochem, Germany), Ly294002 2 µM (PI3K), sulphasalazine 10 µM (NF-κB) and BAY11-7082 1 µM (NF-κB) (from Sigma, St Louis, MO, USA). Finally, cells were harvested for real-time polymerase chain reaction (RT–PCR), Western blot or flow cytometry analysis.
Duodenal samples
Duodenal mucosal biopsy specimens were taken from five patients with CD and from seven normal controls. Adult patients were evaluated employing the routine procedure for CD diagnosis at the San Martin Hospital, La Plata. CD patients were diagnosed on the basis of histological examination, positive serology and clinical response to a gluten-free diet. Control samples were taken from non-coeliac patients referred for gastroendoscopy because of other conditions (oesophagitis, abdominal pain, diarrhoea, iron deficiency anaemia).
The study was approved by the committee for medical research ethics, and all patients gave written consent before participating.
For transport, duodenal tissue specimens were inserted rapidly into sterile tubes containing 3 ml of Ham's F12 medium (Gibco, Carlsbad, CA, USA) supplemented with penicillin and streptomycin (Gibco). Then, biopsy samples were washed gently three times with phosphate-buffered saline (PBS) and incubated in Ham's F12 medium (Gibco) with cytokines alone (TNF-α 10 ng/ml, IFN-γ 200 UI/ml) or with the addition of inhibitors (Ly294002 2 µM, sulphasalazine 10 µM) for 24 h at 37°C in 5% CO2. Finally, total RNA was isolated using Trizol reagent (Invitrogen, Carlsbad, CA, USA).
Quantitative RT–PCR (qRT–PCR)
Total RNA was isolated using Trizol reagent. Reverse transcription was performed at 25°C for 10 min, 37°C for 1 h and 72°C for 5 min from 100 ng of total RNA using M-MLV reverse transcriptase (Promega, Madison, Wisconsin, USA) and random primers (1 µM; Invitrogen). qPCR was performed in iCycler real time PCR (Bio-Rad, Munich, Germany) using SybrGreen mix (Invitrogen). The TG2 primers (forward: 5′-TCAACTGCAACGATGACCAGG-3′; reverse: 5′-TGTTCTGGTCATGGGCCGAG-3′) were designed with the Chromas Primer Designer program. The running protocol was as follows: cycle 1 (×1) 95°C 10 min; cycle 2 (×50) 95°C 15 s, 57°C 15 s, 72°C 30 s; cycle 3 (×81) 55–95°C 30 s. The comparative Ct method was used to quantify TG2 transcript and normalization was performed with the β-actin housekeeping gene. Values are expressed as mean ± standard deviation (s.d.) of the mean. Representative experiments were performed three times and analysed statistically using the Mann–Whitney U-test.
Western blot analysis
For protein extraction treated cells were washed twice with ice-cold PBS, scraped off with 0·4 ml of PBS and subjected to a short centrifugation (10 s, room temperature, 14·000 g). The supernatant was discarded and the pellet was resuspended in freeze/thaw lysis buffer. The suspension was frozen briefly in N2 and was allowed to thaw slowly on ice. The freeze/thaw cycle was repeated three more times. After vortexing for 10 s, the lysates were incubated with DNAse (Invitrogen) for 20 min at 37°C, and finally stored at −80°C. Protein concentration was determined by the bicinchoninic acid assay (BCA; Pierce, Rockford, IL, USA).
Laemmli gel sample buffer was added to the lysate containing 10 µg of protein and boiled for 7 min, after which proteins were separated by sodium dodeyl sulphate-polyacrylamide gel electrophoresis (SDS-PAGE) electrophoresis on a 12·5% gel. Proteins from the gel were electrotransferred to a polyvinylidene difluoride (PDVF) membrane (Bio-Rad Laboratories, Hercules, CA, USA). After 2 h incubation in blocking solution [5% dry milk in Tris-buffered saline–Tween (TBST) 20 buffer] the membrane was incubated with the mouse anti-TG2 monoclonal antibody 4E1G9 produced and characterized in our laboratory [16], and with a rabbit anti β-actin antibody (Abcam, Cambridge, UK), according to the manufacturer's recommendations. The membrane was then washed three times with TBST and incubated with horseradish peroxidase-conjugated secondary antibodies (Amersham Biosciences, Piscataway, NJ, USA) for 1 h at room temperature. The membrane was rinsed three times for 20 min with TBST, followed by four quick rinses with distilled water, and developed with 4-chloro-naphthol/H2O2 and methanol.
Cloning and expression of TG2
TG2 was amplified from Caco-2 cells by PCR and cloned into pET28 vector (Novagen, Madison, WI, USA). The protein was expressed in Escherichia coli Rosetta 2 (DE3) cells using lysogeny broth (LB) culture medium. Protein expression was induced with 100 µM isopropyl β-d-thiogalactopyranoside (Invitrogen) and the cells were incubated further for 24 h at 28°C. The cells were then lysed in a lysis buffer [50 mM sodium-phosphate pH 7·5, 400 mM sodium chloride, 5 mM imidazole, 0·5% (v/v) Triton-X100]. The crude lysate was centrifuged at 21 000 g for 20 min, and the supernatant was applied to a Ni-NTA column (Qiagen, Hilden, Germany). After several washings with wash buffer (50 mM sodium-phosphate pH 7·5, 500 mM sodium chloride, 60 mM imidazole), the protein was eluted with elution buffer [50 mM Hepes pH 7·0, 100 mM sodium chloride, 300 mM imidazole, 10% (v/v] glycerol), after which the eluted protein fractions were pooled and concentrated. Recombinant TG2 protein (rTG2) was used as a reference in Western blot analysis.
Reporter system with TG2 promoter
A fragment of 1·5 Kb long of the TG2 promoter region from Caco-2 cells was cloned in a firefly luciferase reporter vector pGL3 (Promega). Caco-2 cells were plated in a 24-well plate and transfected transiently with TG2 promoter construction together with a Renilla luciferase vector. Transient transfection was carried out using Lipofectamine 2000 (Invitrogen), according to the manufacturer's instructions. Briefly, cells were seeded at a density of 4·105 per well in a six-well plate. When cells reached 40–50% confluence they were washed with 2 ml Opti-MEM (Invitrogen) and incubated with a DNA-Lipofectamine (Invitrogen) mixture for 6 h in a humidified 5% CO2 environment. After 6 h of incubation the transfection medium was replaced with fresh culture medium, and cells were incubated for 24 h. Subsequently, cells were incubated with cytokines alone (TNF-α 10 ng/ml, IFN-γ 200 UI/ml) or with the addition of inhibitors of signalling pathways (SP600125 20 µM, Ly294002 2 µM, sulphasalazine 10 µM) for another 24 h. Luciferase activity was measured in cellular lysates using the Dual-Luciferase Reporter Assay System Kit (Promega), according to the manufacturer's protocol. For each sample firefly luciferase data were normalized to the Renilla luciferase internal control. Relative luciferase units (RLU) are referred to the non-stimulated control.
Flow cytometry
To evaluate the expression of surface TG2, THP-1 cells were treated for 20 h with TNF-α 10 ng/ml and IFN-γ 200 UI/ml, and inhibitors of signalling pathways. Cells were incubated with the anti-TG2 monoclonal antibodies (4E1G9, 2G3H8, 5G7G6 or 1H7H9) produced in our laboratory [16]. Then cells were incubated with fluorescein isothiocyanate-conjugated goat anti-mouse immunoglobulin (Ig)G (Santa Cruz Biotechnology, Santa Cruz, CA, USA). Flow cytometry analysis was performed in a fluorescence activated cell sorter (FACS)Calibur flow cytometer (BD Biosciences), and data were analysed using FlowJo software (Tree Stars, Ashland, OR, USA).
Results
Proinflammatory cytokines regulate TG2 expression
To investigate whether the proinflammatory cytokines TNF-α, IFN-γ, IL-15, IL-6 and IL-1 modulate TG2 expression, we measured TG2 mRNA levels by quantitative (q)RT–PCR in five human cell lines from different cell lineages (Caco-2 and HT29, intestinal epithelia; A549 and CALU-6, lung epithelia; THP-1, monocyte-like) stimulated for 24 h with the cytokines mentioned. In all cell lines tested, except for A549, IFN-γ was the most potent inducer of TG2 expression (Fig. 1). The highest induction of TG2 by IFN-γ was observed in THP-1 cells (fold increase = 20·2). In the two intestinal epithelial cell lines, Caco-2 and HT29, the up-regulation of TG2 transcript by IFN-γ was about 18-fold while TG2 levels were increased by 6·9- and 7·3-fold in A549 and CALU-6, respectively. TG2 was also induced by TNF-α stimulation, this cytokine being the second most potent inducer in three (Caco-2, Calu-6 and THP-1) of the five cell lines tested. Concentration of cytokines used for cell treatment was selected according with the respective dose–response curve (Supporting Information, Fig. S1), which was also similar to those used in another study [14], among other reports. Cell viability was checked for each treatment condition (Supporting Information, Fig. S2). Stimulation with IL-1 and IL-15 produced a much lower induction of TG2 expression, causing a 7·9- and 7·8-fold increase, respectively. IL-1 produced the highest TG2 induction in A549 cells, whereas IL-6 incubation produced small increases (≥fivefold) in TG2 mRNA levels in all cell lines tested.
Fig. 1.
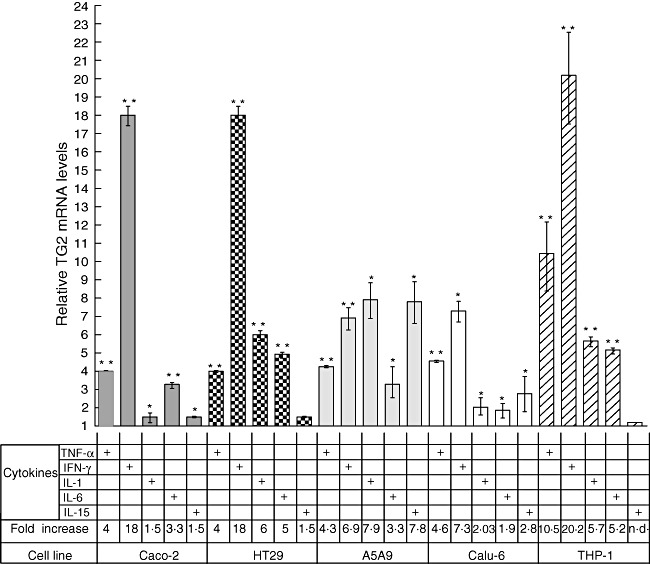
Proinflammatory cytokines regulate transglutaminase 2 (TG2) expression in human cell lines. Expression of TG2 was determined by quantitative real time polymerase chain reaction (RT–PCR) in five different human cell lines: intestinal epithelial cell lines Caco-2 and HT29, lung epithelial cell lines A549 and Calu-6 and the monocytic cell line human acute monocytic leukaemia cell line (THP-1) (lower panel of the chart) stimulated for 24 h with proinflammatory cytokines: tumour necrosis factor (TNF)-α (10 ng/ml), interferon (IFN)-γ (200 UI/ml), interleukin (IL)-1 (10 ng/ml), IL-6 (10 ng/ml) and IL-15 (20 ng/ml). Results were normalized against β-actin and relative TG2 mRNA levels were referred to the non-stimulated control (value = 1). Data represent means ± standard error of the mean (n = 3). The Mann–Whitney U-test was performed: *P < 0·05; **P < 0·01.
Synergistic effect of TNF-α and IFN-γ on TG2 expression
Because both IFN-γ and TNF-α are cytokines involved in the pathogenic mechanisms of different inflammatory diseases, and were shown here to induce the transcription of TG2 mRNA, we evaluated further the effect of these two cytokines on TG2 expression. Cells were incubated for 24 h with TNF-α, IFN-γ or a combination of both cytokines. In all cells tested, the incubation with TNF-α + IFN-γ produced a much higher induction of TG2 mRNA than the individual cytokines alone (Fig. 2). Treatment with TNF-α and IFN-γ produced a synergistic effect in four (Caco-2, A549, CALU-6 and THP-1) of the five cell lines tested.
Fig. 2.
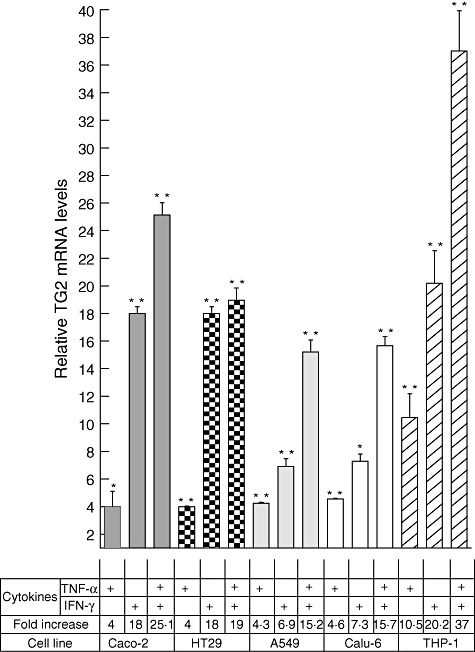
Tumour necrosis factor (TNF)-α and interferon (IFN)-γ synergistically induce transglutaminase 2 (TG2) expression. Expression of TG2 was determined by quantitative real time polymerase chain reaction (RT–PCR) in Caco-2, HT29, A549, Calu-6 and THP-1 cells (lower panel of the chart) stimulated for 24 h with TNF-α (10 ng/ml), IFN-γ (200 UI/ml) or a combination of both. Results were normalized against β-actin and relative TG2 mRNA levels were referred to the non-stimulated control (value = 1). Data represent means ± standard error of the mean (n = 3). The Mann–Whitney U-test was performed: *P < 0·05; **P < 0·01.
Kinetics of TG2 induction by TNF-α + IFN-γ
To investigate the time–course of the synergistic TG2 induction, THP-1 and Caco-2 cells were stimulated with TNF-α + IFN-γ for different time-periods (from 45 min to 48 h) and TG2 mRNA was determined by qRT–PCR (Supporting Information, Fig. S3). The kinetics of TG2 induction were equivalent for both cell lines, with the maximal induction observed at 16 h post-stimulation. In agreement with previous results, TG2 induction was higher in THP-1 cells (41-fold) compared with Caco-2 cells (28-fold) at 16 h post-stimulation. In spite of the biological differences between these two cell lines, these results suggest that the intracellular mechanisms leading to induction of TG2 expression are equivalent in both cell lines.
Effect of selective inhibition of signalling pathways on TG2 expression
It has been described that TNF-α activates multiple signalling pathways such as those of NF-κB, p38 mitogen-activated protein kinase (MAPK) and c-Jun N-terminal kinase (JNK) [12]. In contrast, IFN-γ may activate gene expression through PI3-K or NF-κB pathways, among others [17]. To investigate the signalling pathways involved in TG2 induction by IFN-γ and TNF-α, specific inhibitors of well-characterized pathways were used.
The quantitative analysis of TG2 mRNA in Caco-2 cells stimulated with TNF-α, IFN-γ or TNF-α + IFN-γ in the presence of selective inhibitors showed the contribution of each signalling pathway on TG2 expression (Fig. 3).
Fig. 3.
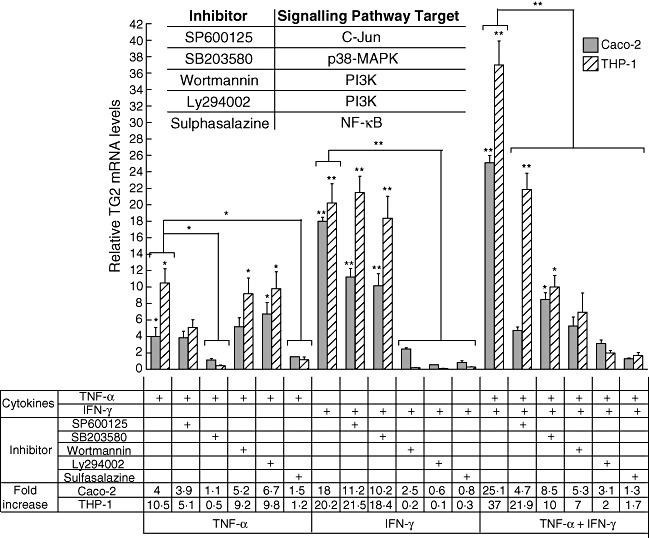
Effect of inhibitors of signalling pathways on transglutaminase 2 (TG2) induction by tumour necrosis factor (TNF)-α and interferon (IFN)-γ. Caco-2 and THP-1 cells were incubated for 24 h with specific inhibitors of signalling pathways: SP600125 (20 µM), SB203580 (10 µM), wortmannin (10 µM), Ly294002 (2 µM), sulphasalazine (10 µM) in the presence of TNF-α (10 ng/ml), IFN-γ (200 UI/ml) or the double stimulus TNF-α + IFN-γ. Level of TG2 transcripts was determined by quantitative real time polymerase chain reaction (RT–PCR). Results were normalized with the housekeeping gene β-actin and were referred to the non-stimulated control (value = 1). Data represent means ± standard error of the mean (n = 4). The Mann–Whitney U-test was performed: *P < 0·05; **P < 0·01 (asterisks on individual bars indicate comparison versus control). The inserted chart indicates the signalling pathways targeted by the inhibitors used.
Induction of TG2 by TNF-α was blocked completely in the presence of SB203580 or sulphasalazine. Induction of TG2 was inhibited partially in the presence of SP600125, while wortmannin and Ly294002 had no effect. Wortmannin, Ly294002 and sulphasalazine were able to block the induction of TG2 by IFN-γ completely (Fig. 3).
When Caco-2 cells were treated with TNF-α and IFN-γ, the reduction in TG2 expression in the presence of the inhibitors reflected the contribution of the individual signalling pathways to either TNF-α or IFN-γ induction. For example, SB203580 partially reduced the TG2 induction by TNF-α + IFN-γ, reflecting the inhibitory effect on the signalling pathways activated by TNF-α but not those activated by IFN-γ. Sulphasalazine blocked the induction of TG2 mRNA by TNF-α + IFN-γ completely, highlighting the central role of NF-κB in TG2 expression. These data show that inhibition of NF-κB activity causes a potent suppression of TG2 expression. Although TNF-α and IFN-γ drive different signalling pathways, NF-κB is involved critically in TG2 induction by both cytokines.
Similar results were obtained when TG2 expression was evaluated in THP-1-induced cells in the presence of inhibitors (Fig. 3), suggesting that the signalling pathways participating in TG2 induction by TNF-α and/or IFN-γ are equally active in both cell lines, even when these cells correspond to developmentally separate lineages.
TG2 promoter is synergistically activated by TNF-α + IFN-γ
The earlier results showed that TNF-α and IFN-γ activate TG2 expression through different intracellular pathways. Therefore, we sought to evaluate the synergistic effect of TNF-α- and IFN-γ-induced signals acting on the TG2 promoter. To this end, we cloned a fragment, 1·5 Kb long, of the TG2 promoter from Caco-2 cells into a pGL3 luciferase reporter plasmid. Caco-2 cells were transfected transiently with the pTG2-luciferase plasmid and luciferase activity was determined after 24 h of stimulation with TNF-α, IFN-γ or TNF-α + IFN-γ (Fig. 4).
Fig. 4.
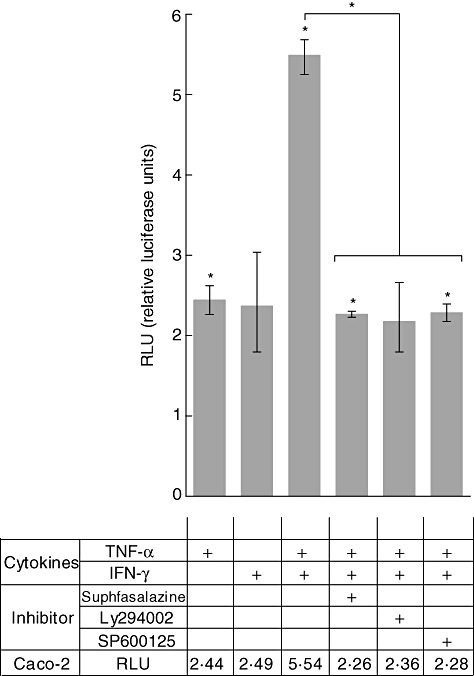
Tumour necrosis factor (TNF)-α and interferon (IFN)-γ enhance transglutaminase 2 (TG2) promoter activity. Caco-2 cells were transfected transiently with the pTG2–luciferase plasmid. Luciferase activity (Dual LR System; Promega) was determined after 24 h of stimulation with TNF-α (TNF-α 10 ng/ml), IFN-γ (200 UI/ml) or TNF-α + IFN-γ alone or in the presence of sulphasalazine (10 µM), Ly294002 (2 µM) or SP600125 (20 µM). Relative luciferase units (RLU) are referred to the non-stimulated control. Data represent means ± standard error of the mean (n = 3). The Mann–Whitney U-test was performed: *P < 0·05 (asterisks on individual bars indicate comparison versus control).
When compared to the respective single stimuli (2·44 RLU and 2·49 RLU for TNF-α and IFN-γ, respectively), we observed significantly enhanced TG2 activation in Caco-2 incubated with TNF-α + IFN-γ (5·54 RLU), indicating that both cytokines activate the TG2 promoter synergistically.
To evaluate the effect of specific inhibitors of signalling pathways on the function of the TG2 promoter, pTG2-Luc transiently transfected Caco-2 cells were incubated with TNF-α + IFN-γ alone or in the presence of Ly294002, SP600125 or sulphasalazine (Fig. 4). The relative activity of the TG2 promoter produced by TNF-α + IFN-γ (5·54 RLU) was similarly reduced by half that caused by the three inhibitors tested (2·26 RLU, 2·36 and 2·28 for sulphasalazine, Ly294002 and SP600125, respectively).
These data suggest that TG2 induction by TNF-α and IFN-γ occurs at transcriptional level through different intracellular pathways which activate transcription factors that bind to the TG2 promoter.
Next, we investigated whether the induction of TG2 mRNA by TNF-α + IFN-γ correlates with changes at the protein level. To this purpose, TG2 was detected by Western blot and flow cytometry.
Western blot analysis using the 4E1G9 anti-TG2 monoclonal antibody, which recognizes the epitope in position 637 to 648 located in the barrel 2 domain, confirmed that TG2 was expressed in untreated Caco-2 cells and was induced strongly after 20 h of TNF-α + IFN-γ treatment (Fig. 5).
Fig. 5.
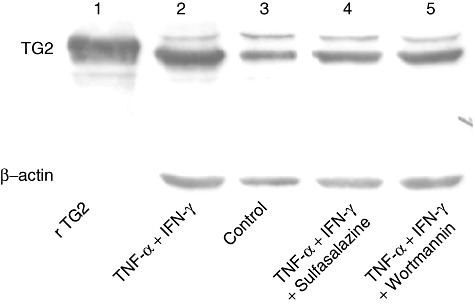
Tumour necrosis factor (TNF)-α and interferon (IFN)-γ induce transglutaminase 2 (TG2) synthesis. TG2 expression was analysed by Western blot on protein extracts obtained from Caco-2 cells stimulated 20 h with TNF-α (10 ng/ml) and IFN-γ (200 UI/ml) (lane 2), medium (control, lane 3), (TNF-α + IFN-γ) + sulphasalazine (10 µM) (lane 4) and (TNF-α + IFN-γ) + wortmannin (10 µM) (lane 5). Anti-TG2 4E1G9 monoclonal antibody was used for TG2 detection. Detection of β-actin (Santa Cruz Biotechnology) was used as normalizer. Recombinant TG2 (rTG2) (lane 1) produced in our laboratory was used as a reference.
To evaluate further whether inhibition of signalling pathways modulate TG2 expression at the protein level, Caco-2 cells were incubated with TNF-α + IFN-γ in the presence of inhibitors. Western blot analysis revealed that TG2 protein induction was inhibited when treatment with TNF-α + IFN-γ was performed in the presence of sulphasalazine or wortmannin. The intensity of protein bands from TNF-α + IFN-γ-treated samples obtained in the presence of inhibitors was similar to that obtained from untreated cells.
In order to evaluate further whether TG2 produced in TNF-α + IFN-γ-treated cells is correctly folded and located at the cellular membrane, flow cytometric analysis was performed on THP-1 cells stimulated with TNF-α + IFN-γ for 20 h. A panel of four anti-TG2 monoclonal antibodies (named 5G7G6, 2G3H8, 4E1G9 and 1H7H9), recognizing different epitopes, was used to evaluate the surface expression of TG2. The four anti-TG2 antibodies detected TG2 on the cell surface [16]. Flow cytometric analysis, using the 1H7H9 monoclonal antibody, showed that treatment of THP-1 cells with TNF-α + IFN-γ for 20 h increased TG2 protein at the cellular membrane [mean fluorescence intensity (MFI) = 30,78 in treated cells compared with MFI = 16·41 for unstimulated cells (Fig. 6). Similar results were obtained when flow cytometric analysis was performed using the anti-TG2 monoclonal antibodies 4E1G9, 5G6G7 and 2G3H8 (not shown). To evaluate whether inhibition of signalling pathways modulate the density of TG2 molecules at the cell surface, flow cytometry was performed on THP-1 cells incubated for 20h with TNF-α + IFN-γ in the presence of inhibitors. Interestingly, the induction of TG2 protein produced by the double stimulus with TNF-α + IFN-γ was blocked completely in the presence of sulphasalazine. When the other inhibitors (Ly294002, SB203580, SP600125 and wortmannin) were tested, the expression of surface TG2 was only partially inhibited. These results are in accordance with those obtained by qRT–PCR, Western blot and luciferase activity analysis, and highlight the central role of NF-κB activity on TG2 expression.
Fig. 6.

Tumour necrosis factor (TNF)-α and interferon (IFN)-γ induce surface expression of transglutaminase 2 (TG2). Surface TG2 expression was evaluated by flow cytometry on non-stimulated THP-1 cells (grey line) or in cells stimulated for 20 h with TNF-α (10 ng/ml) and IFN-γ (200 UI/ml) either in the absence (black line) or the presence of sulphasalazine (10 µM) (dashed line). Cells were labelled with the 1H7H9 anti-TG2 monoclonal antibody or an isotype control (grey histogram). Mean fluorescence intensity (MFI) values are indicated for each histogram.
TNF-α + IFN-γ up-regulate TG2 expression in human small intestine mucosa
To investigate whether the synergistic induction of TG2 by TNF-α + IFN-γ in cell lines also occurred in intestinal tissue, biopsy samples from the duodenum of untreated CD patients and controls were incubated with the combination of TNF-α + IFN-γ for 24 h. Under basal conditions, intestinal mucosa of untreated CD patients had a higher TG2 mRNA content (9·8-fold increase in comparison with the housekeeping gene β-actin) than control samples (5·1-fold increase) (Fig. 7a). Intestinal tissues from untreated CD patients as well as controls showed up-regulation of TG2 mRNA (8·5- and 14·8-fold increase, respectively) when compared to unstimulated samples. Surprisingly, intestinal mucosa from untreated CD patients showed induction of TG2 mRNA by TNF-α + IFN-γ, even when the local concentration of proinflammatory cytokines is likely to be high due to the chronic disease process observed in these patients.
Fig. 7.
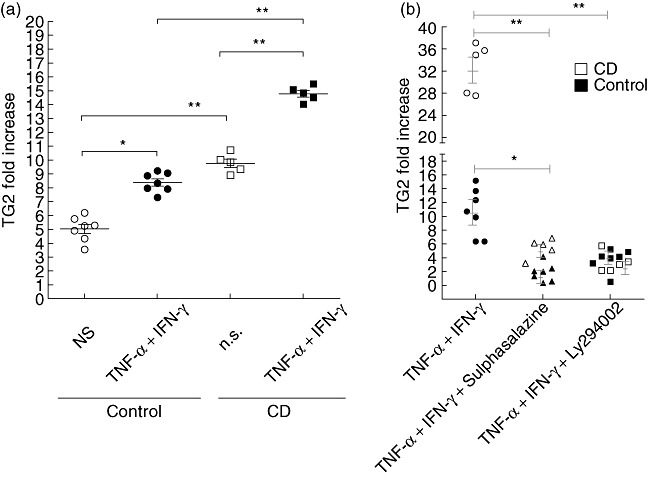
Transglutaminase 2 (TG2) expression in human small intestinal mucosa. Duodenal samples from untreated coeliac disease (CD) patients (n = 5) and control individuals (n = 7) were incubated for 24 h with tumour necrosis factor (TNF)-α (10 ng/ml) and interferon (IFN)-γ (200 UI/ml) or medium (NS) (a) or with TNF-α + IFN-γ in the presence of sulphasalazine (10 µM) or Ly294002 (2 µM) (b). In (a) the levels of TG2 transcript were determined by quantitative real time polymerase chain reaction (RT–PCR) as fold increase (ΔCt) in comparison with the housekeeping gene (β-actin). In (b), the fold increase (2⁁ΔCt) of the TG2 transcript was normalized with the housekeeping gene (β-actin) and referred to the unstimulated tissue from each patient. Mann–Whitney U-test: *P < 0·05; **P < 0·01.
Using specific inhibitors of activation pathways we next explored whether the same signalling pathways observed in Caco-2 or THP1 cells are active in intestinal tissues. To this end, intestinal biopsies from the duodenum of CD patients and controls were stimulated with TNF-α + IFN-γ in the presence of sulphasalazine or Ly294002 (Fig. 7b). The inhibitors tested blocked the TG2 induction in both active CD and control samples.
Therefore, induction of TG2 expression by TNF-α + IFN-γ was also observed in intestinal tissue, corroborating the results obtained in vitro using both Caco-2 and THP-1 cell lines.
Discussion
TG2 is a cross-linking enzyme involved in several cellular processes under normal physiological conditions such as cell adhesion, migration, cell cycle, apoptosis and differentiation. TG2 also plays important roles in inflammatory diseases and, as it can either promote or inhibit cell death, also has a role in cancer [5]–[7].
TG2 is up-regulated strongly in villus atrophy, the hallmark histological lesion in CD, and plays a critical role in CD pathogenic mechanisms due to the generation of neoepitopes by selective deamidation of glutamines in gluten peptides. This reaction produces peptides with higher-affinity binding to the known HLA class II susceptibility molecules and promotes a stronger activation and expansion of gliadin-specific IFN-γ-producing CD4+ T cells [8]–[10]. In addition, the continuous activation of TG2 may lead to chronic inflammation by cross-linking and the loss of function of peroxisome proliferator-activated receptor-γ (PPARγ), a central mediator of intestinal homeostasis [18]. Other proinflammatory effects have been described for TG2, including the production of IL-6, a proinflammatory cytokine and also a potent signal for driving T helper type 17 (Th17) differentiation [19]. This suggests that TG2 may trigger other inflammatory mediators and favour Th17 expansion, which together may constitute an additional potent inducer for chronic inflammation and autoimmunity. Therefore, modulation of TG2 expression may be a specific tool for the therapeutic management of different inflammatory disorders.
In the current study, we demonstrated that the proinflammatory cytokines TNF-α, IFN-γ, IL-1, IL-15 and IL-6 induced TG2 expression to different extents, with IFN-γ being the most potent inducers of TG2 expression, followed by TNF-α. These two cytokines up-regulated TG2 mRNA expression synergistically, with maximal induction observed at 16 h post-treatment (Figs 1, 2 and Supporting Information, Fig. S3). Notably, the results were similar for the five human cell lines tested (two from intestinal epithelia, two from lung epithelia and one monocytic-like), suggesting the presence of similar mechanisms for the control of TG2 expression in these cells. Consequently, this observation could be extended to pathophysiological processes in which TG2 has been implicated, such as neurodegenerative disorders, where the cytokines mentioned above produced by microglia cells (monocytic-like) have been suggested to play a role [11].
Using a set of specific inhibitors [20]–[22] we were able to identify the main signalling pathways activated by TNF-α and IFN-γ that regulate the activity of the TG2 promoter. TNF-α activated the expression of TG2 through p38 MAPk, NF-κB and JNK. The p38 MAPK, probably acting through the AP-1 binding sites on TG2 promoter, was blocked by SB203580 (pyridinyl imidazole) [23],[24]. Inhibition of JNK activity by SP600125 (anthrapyrazolone) caused only a partial reduction of the TG2 expression induced by TNF-α. The NF-κB pathway seems to have a central role in TG2 expression after activation by both TNF-α or IFN-γ, as the use of two inhibitors, sulphasalazine (sulpha drug, derivative of mesalazine, and a potent and specific inhibitor of NF-κB) and BAY11-7082 (inhibits NF-κB by blocking cytokine-induced IκB-α phosphorylation), completely abrogated the TG2 induction (Fig. 3).
Different studies have shown that signalling pathways induced by IFN-γ involve activation of PI3K or NF-κB [17],[24]. Upon activation, PI3-K mediates the recruitment and phosphorylation of Akt at Serine 473, a known target of PI3-K [17]. In the present study, the pharmacological inhibitors of PI3-K pathway, LY294002 [17] and wortmannin [25], inhibited significantly the effects of IFN-γ.
Interestingly, using T84 cells, a human intestinal epithelial cell line, Professor C. Khosla and colleagues (personal communication) demonstrated that IFN-γ increases TG2 activity through a PI3K-dependent mechanism. The use of the PI3K inhibitor, LY294002, blocked the extracellular activation of TG2 and emerged as an attractive pharmacological agent for treatment of CD.
Bioinformatic analyses (MatInspector Genomatix) of the TG2 promoter region showed the presence of binding sites for several transcription factors involved directly in proinflammatory pathways, such as SP1, ZBP, SMADs, GATAs, AP-1, NF-κB and signal transducers and activation of transcription (STATs), among others. Undoubtedly, the NF-κB pathway has been the one most intensively studied. TG2 is also able to control NF-κB activation by depleting the IκBα inhibitor via polymer formation, explaining a direct cross-activation between NF-κB and TG2 [11].
Using a luciferase reporter assay in Caco-2 cells (Fig. 4), we demonstrated the activity of some of the putative binding sites for transcriptional factors in the TG2 promoter, as predicted by bioinformatics.
Expression of TG2 at protein level was evaluated by Western blot analysis, revealing the synergistic induction by TNF-α + IFN-γ (Fig. 5). More importantly, analysis by flow cytometry using a panel of conformational specific anti-TG2 monoclonal antibodies allowed us to evaluate the correct folding and location of TG2 at the cellular surface and the effect of the different inhibitors on TG2 expression (Fig. 6).
We next analysed whether the signalling pathways identified by in-vitro assays on cell lines also operate in intestinal tissue. Basal TG2 expression was detected in healthy tissue, but levels were significantly higher in samples from untreated CD patients (Fig. 7). Incubation with TNF-α + IFN-γ induced TG2 expression in biopsy samples from both CD patients and control individuals. Therefore, TG2 is expressed physiologically in healthy mucosal tissue and is increased in intestinal mucosa of untreated CD patients, as a consequence of the proinflammatory environment in intestinal mucosa in active CD, due mainly to abundant IFN-γ, a key player in the pathogenic mechanism of CD.
Because IkBα is a key negative modulator of the NF-κB pathway, inactivation of IkBα by cross-linking induced strongly by TG2 activates NF-κB. Consequently, TG2 and NF-κB can enhance each other's actions amplifying the inflammatory cycle [11]. Interestingly, constitutive NF-κB activation often accompanies increased TG2 expression in inflammatory disease such as inflammatory bowel disease, rheumatoid arthritis and coeliac disease [6],[7],[26],[27]. Similar to NF-κB, other transcription factors that activate TG2 also induce the production of proinflammatory cytokines characteristically present in the intestinal mucosa of untreated CD patients. Therefore, NF-κB, as a key element together with others transcription factors, may exacerbate a complex vicious circle of inflammation through interactions with TG2.
Induction of these inflammatory pathways drives activation and recruitment of effector cells, such as neutrophils, macrophages, dendritic cells and T cells, which cause and amplify the pathogenic mechanisms of different chronic disorders [7],[28],[29].
Based on our results obtained by qRT–PCR, flow cytometry and Western blotting, we propose a model for the signalling pathways activated by TNF-α and IFN-γ involved in the regulation of TG2 expression. As a consequence of dysregulation of TG2 expression and activity, a distinct pathogenic process may be initiated (Fig. 8).
Fig. 8.
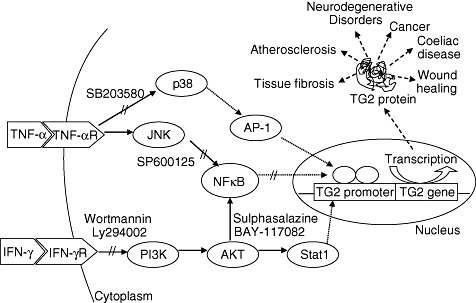
Model of transglutaminase 2 (TG2) transcriptional activation by tumour necrosis factor (TNF)-α and interferon (IFN)-γ. Signalling pathways and transcription factors activated by TNF-α and IFN-γ that regulate TG2 transcription. Role of TG2 in different chronic disorders.
Therapeutic approaches aimed to modulate the activity of TG2 are being taken into consideration as a way to reduce, or even cancel, the disease processes in which the enzyme is involved [15],[30]. This study on TG2 gene regulation provides useful information for the development of new therapeutic strategies to down-modulate chronic inflammatory disorders.
Disclosure
The authors declare no conflict of interest.
Supporting information
Fig. S1. Dose–response curve oftransglutaminase 2 (TG2) induction by tumour necrosis factor(TNF)-α and interferon (IFN)-γ. Human acute monocyticleukaemia cell line (THP-1) cells were incubated for 24 h withdifferent concentrations of TNF-α and/or IFN-γ asindicated. Grey bars correspond to the cytokine concentrationselected for further studies; TNF-α (10 ng/ml) andIFN-γ (200 UI/ml).
Fig. S2. Cell viability after cytokinetreatments. Cell viability was determined by Trypan blue exclusionin human acute monocytic leukaemia cell line (THP-1) cells treatedfor 24 h with different concentrations of tumour necrosis factor(TNF)-α and/or interferon (IFN)-γ as indicated. Greybars correspond to the cytokine concentration selected for furtherstudies; TNF-α (10 ng/ml) and IFN-γ (200 UI/ml).
Fig. S3. Kinetic of transglutaminase 2 (TG2)induction by tumour necrosis factor (TNF)α + interferon(IFN)-γ. Caco-2 and human acute monocytic leukaemia cell line(THP-1) cells were incubated for different times with TNF-α(10 ng/ml) and IFN-γ (200 UI/ml). Levels of TG2 transcriptwere determined by quantitative real time–polymerase chainreaction (RT–PCR). Results were normalized againstβ-actin and relative TG2 mRNA levels were referred to thenon-stimulated control (value = 1). Data represent means ±standard error of the mean (n = 3). The Mann–WhitneyU-test was performed: *P < 0·05; **P< 0·01.
References
- 1.Lorand L, Graham RM. Transglutaminases: crosslinking enzymes with pleiotropic functions. Nat Rev Mol Cell Biol. 2003;4:140–56. doi: 10.1038/nrm1014. [DOI] [PubMed] [Google Scholar]
- 2.Fesus L, Piacentini M. Transglutaminase 2: an enigmatic enzyme with diverse functions. Trends Biochem Sci. 2002;27:534–9. doi: 10.1016/s0968-0004(02)02182-5. [DOI] [PubMed] [Google Scholar]
- 3.Park D, Choi SS, Ha K-S. Transglutaminase 2: a multi-functional protein in multiple subcellular compartments. Amino Acids. 2010;39:619–31. doi: 10.1007/s00726-010-0500-z. [DOI] [PubMed] [Google Scholar]
- 4.Bayardo MP, De Urraza P, Chirdo FG. Homo sapiens transglutaminase 2 mRNA, complete cds. GenBank Accession number: AY675221.1. 2004 Ago. Available at: http://www.ncbi.nlm.nih.gov/nuccore/AY675221.1 (accessed 4 August 2004)
- 5.Fésüs L, Szondy Z. Transglutaminase 2 in the balance of cell death and survival. FEBS Lett. 2005;579:3297–302. doi: 10.1016/j.febslet.2005.03.063. [DOI] [PubMed] [Google Scholar]
- 6.Kim S-Y. Transglutaminase 2 in inflammation. Front Biosci. 2006;11:3026–35. doi: 10.2741/2030. [DOI] [PubMed] [Google Scholar]
- 7.Mehta K, Kumar A, Kim HI. Transglutaminase 2: a multi-tasking protein in the complex circuitry of inflammation and cancer. Biochem Pharmacol. 2010;80:1921–9. doi: 10.1016/j.bcp.2010.06.029. [DOI] [PubMed] [Google Scholar]
- 8.Dørum S, Arntzen MØ, Qiao S-W, et al. The preferred substrates for transglutaminase 2 in a complex wheat gluten digest are peptide fragments harboring celiac disease T-cell epitopes. PLoS ONE. 2010;5:e14056. doi: 10.1371/journal.pone.0014056. [DOI] [PMC free article] [PubMed] [Google Scholar]
- 9.Molberg O, Mcadam SN, Körner R, et al. Tissue transglutaminase selectively modifies gliadin peptides that are recognized by gut-derived T cells in celiac disease. Nat Med. 1998;4:713–7. doi: 10.1038/nm0698-713. [DOI] [PubMed] [Google Scholar]
- 10.Abadie V, Sollid LM, Barreiro LB, Jabri B. Integration of genetic and immunological insights into a model of celiac disease pathogenesis. Annu Rev Immunol. 2011;29:493–525. doi: 10.1146/annurev-immunol-040210-092915. [DOI] [PubMed] [Google Scholar]
- 11.Lee J, Kim YS, Choi DH, et al. Transglutaminase 2 induces NFκB activation via a novel pathway in BV-2 microglia. J Biol Chem. 2004;279:53725–35. doi: 10.1074/jbc.M407627200. [DOI] [PubMed] [Google Scholar]
- 12.Kuncio GS, Tsyganskaya M, Zhu J, et al. TNFα modulates expression of the tissue transglutaminase gene in liver cells. Am J Physiol. 1998;274(Pt 1):G240–245. doi: 10.1152/ajpgi.1998.274.2.G240. [DOI] [PubMed] [Google Scholar]
- 13.Boivin MA, Roy PK, Bradley A, Kennedy JC, Rihani T, Ma TY. Mechanism of γIFN-induced increase in T84 intestinal epithelial tight junction. J Interferon Cytokine Res. 2009;29:45–54. doi: 10.1089/jir.2008.0128. [DOI] [PMC free article] [PubMed] [Google Scholar]
- 14.Kim S-Y, Jeong E-J, Steinert PM. γIFN induces transglutaminase 2 expression in rat small intestinal cells. J Interferon Cytokine Res. 2002;22:677–82. doi: 10.1089/10799900260100169. [DOI] [PubMed] [Google Scholar]
- 15.Siegel M, Khosla C. Transglutaminase 2 inhibitors and their therapeutic role in disease states. Pharmacol Ther. 2007;115:232–45. doi: 10.1016/j.pharmthera.2007.05.003. [DOI] [PMC free article] [PubMed] [Google Scholar]
- 16.Di Niro R, Ferrara F, Not T, et al. Characterizing monoclonal antibody epitopes by filtered gene fragment phage display. Biochem J. 2005;388(Pt 3):889–94. doi: 10.1042/BJ20041983. [DOI] [PMC free article] [PubMed] [Google Scholar]
- 17.Kaur S, Uddin S, Platanias LC. The PI3' kinase pathway in interferon signaling. J Interferon Cytokine Res. 2005;25:780–7. doi: 10.1089/jir.2005.25.780. [DOI] [PubMed] [Google Scholar]
- 18.Luciani A, Villella VR, Vasaturo A, et al. Lysosomal accumulation of gliadin p31-43 peptide induces oxidative stress and tissue transglutaminase-mediated PPARgamma downregulation in intestinal epithelial cells and coeliac mucosa. Gut. 2010;59:311–9. doi: 10.1136/gut.2009.183608. [DOI] [PubMed] [Google Scholar]
- 19.Oh K, Park H-B, Byoun O-J, et al. Epithelial transglutaminase 2 is needed for T cell interleukin-17 production and subsequent pulmonary inflammation and fibrosis in bleomycin-treated mice. J Exp Med. 2011;208:1707–19. doi: 10.1084/jem.20101457. [DOI] [PMC free article] [PubMed] [Google Scholar]
- 20.Davies SP, Reddy H, Caivano M, Cohen P. Specificity and mechanism of action of some commonly used protein kinase inhibitors. Biochem J. 2000;351(Pt 1):95–105. doi: 10.1042/0264-6021:3510095. [DOI] [PMC free article] [PubMed] [Google Scholar]
- 21.Bain J, Plater L, Elliott M, et al. The selectivity of protein kinase inhibitors: a further update. Biochem J. 2007;408(Pt 3):297–315. doi: 10.1042/BJ20070797. [DOI] [PMC free article] [PubMed] [Google Scholar]
- 22.Krishnamurty R, Maly DJ. Biochemical mechanisms of resistance to small-molecule protein kinase inhibitors. ACS Chem Biol. 2010;5:121–38. doi: 10.1021/cb9002656. [DOI] [PMC free article] [PubMed] [Google Scholar]
- 23.Clarke CJ, Guthrie JM, Hannun YA. Regulation of neutral sphingomyelinase-2 (nSMase2) by TNFα involves protein kinase C-δ in lung epithelial cells. Mol Pharmacol. 2008;74:1022–32. doi: 10.1124/mol.108.046250. [DOI] [PMC free article] [PubMed] [Google Scholar]
- 24.Haller D, Russo MP, Sartor RB, Jobin C. IKK beta and phosphatidylinositol 3-kinase/Akt participate in non-pathogenic Gram-negative enteric bacteria-induced RelA phosphorylation and NFκB activation in both primary and intestinal epithelial cell lines. J Biol Chem. 2002;277:38168–78. doi: 10.1074/jbc.M205737200. [DOI] [PubMed] [Google Scholar]
- 25.Wu T, Mohan C. The AKT axis as a therapeutic target in autoimmune diseases. Endocr Metab Immune Disord Drug Targets. 2009;9:145–50. doi: 10.2174/187153009788452417. [DOI] [PubMed] [Google Scholar]
- 26.Dzhambazov B, Lindh I, Engström A, Holmdahl R. Tissue transglutaminase enhances collagen type II-induced arthritis and modifies the immunodominant T-cell epitope CII260-270. Eur J Immunol. 2009;39:2412–23. doi: 10.1002/eji.200939438. [DOI] [PubMed] [Google Scholar]
- 27.Villanacci V, Not T, Sblattero D, et al. Mucosal tissue transglutaminase expression in celiac disease. J Cell Mol Med. 2009;13:334–40. doi: 10.1111/j.1582-4934.2008.00325.x. [DOI] [PMC free article] [PubMed] [Google Scholar]
- 28.Elli L, Bergamini CM, Bardella MT, Schuppan D. Transglutaminases in inflammation and fibrosis of the gastrointestinal tract and the liver. Dig Liver Dis. 2009;41:541–50. doi: 10.1016/j.dld.2008.12.095. [DOI] [PubMed] [Google Scholar]
- 29.Maiuri L, Luciani A, Giardino I, et al. Tissue transglutaminase activation modulates inflammation in cystic fibrosis via PPARgamma down-regulation. J Immunol. 2008;180:7697–705. doi: 10.4049/jimmunol.180.11.7697. [DOI] [PubMed] [Google Scholar]
- 30.Caccamo D, Currò M, Ientile R. Potential of transglutaminase 2 as a therapeutic target. Expert Opin Ther Targets. 2010;14:989–1003. doi: 10.1517/14728222.2010.510134. [DOI] [PubMed] [Google Scholar]
Associated Data
This section collects any data citations, data availability statements, or supplementary materials included in this article.