

Abstract
Systemic lupus erythematosus (SLE) is a polygenic autoimmune disease characterized by the production of anti-nuclear autoantibodies that lead to subsequent end organ damage. Previous array-based studies in patients with SLE have shown that high immunoglobulin (Ig)G anti-nuclear autoantibody reactivity was associated with severe renal lupus, whereas IgM polyreactivity was associated with less severe disease. To ascertain how different murine lupus strains recapitulate these different autoantibody profiles seen in patients, serum from New Zealand black (NZB)/NZ white (W) F1, Murphy Roths large (MRL)/lpr, NZ mixed (M)2410 and BXSB strains were compared using a comprehensive array-based screen. The array results were verified using enzyme-linked immunosorbent assays (ELISAs). Serum from MRL/lpr mice exhibited high levels of IgG anti-nuclear antibodies as well as anti-glomerular antibodies and variable levels of antibodies to myosin, Matrigel and thyroglobulin. Elevated anti-nuclear IgG antibodies were associated with severe nephritis in this strain. In contrast, NZM2410 mice exhibited lower IgG autoantibody levels with less severe nephritis but a significantly higher polyreactive IgM autoantibody profile. ELISA analysis confirmed these results. The NZB/NZW F1 and BXSB strains exhibited an intermediate serological profile. Hence, just as in patients with SLE, whereas strong IgG reactivity to nuclear antigens is associated with severe renal disease, a polyreactive IgM seroprofile is also less ominous in murine lupus.
Keywords: anti-nuclear autoantibodies (ANA), nephritis, polyreactivity, proteomics, systemic lupus erythematosus (SLE)
Introduction
Systemic lupus erythematosus (SLE) is a polygenic autoimmune disease characterized by the production of anti-nuclear autoantibodies (ANA) and anti-glomerular autoantibodies that lead to subsequent end organ damage. It is now well accepted that autoantibodies develop before the clinical onset of SLE [1]. This raises the possibility that risk profiles for SLE could be defined by the types of autoantibodies detected prior to the onset of clinical symptoms which would, in turn, facilitate the development of early definitive therapies.
A wide variety of autoantibodies related to SLE have been documented [2]–[4], but their unique specificities remain ill defined. The classic methods for detecting antibodies include enzyme-linked immunosorbent assay (ELISA) and immunofluorescence, but both approaches are time-consuming and interrogate one antigen at a time. In contrast, the use of autoantigen arrays as a multiplexed approach has both greater sensitivity and a broader range of detection than ELISA [4],[5]. Through screening SLE patient sera by autoantigen array, it was found that SLE patients exhibit high concentrations of immunoglobulin (Ig)G autoantibodies, relative to IgM autoantibodies [4]. Further, it was found that IgG reactivity to vimentin, myosin, Matrigel, laminin and heparan sulphate clustered together, whereas reactivity to total glomerular lysate and DNA-bearing antigens such as ssDNA, dsDNA and chromatin clustered together. Interestingly, both the first cluster of reactivity (IgG anti-laminin, anti-myosin, etc.) and the second cluster of reactivity (anti-DNA, anti-glomerular antibodies) were significantly higher in patients with higher SLE disease activity scores (SLEDAI scores) and more severe renal disease. In contrast, the presence of IgM polyreactivity in patient sera was associated with reduced disease severity [4]. Therefore, it appears that SLE patients can be segregated based on the relative levels of IgG autoantibodies specific for two distinct clusters of antigens and also on the levels of polyreactive IgM antibodies. Together, these findings have important implications as prognosticators for clinical management of SLE.
During the past four decades, various mouse models of SLE such as New Zealand black (NZB)/NZ white (W) F1, or ‘BWF1’, NZ mixed (NZM)2410, Murphy Roths large (MRL)/lpr and BXSB have been studied. Most of these exhibit anti-nuclear autoantibody production and antibody-induced renal disease [2]–[4]. Given the fact that we can now examine SLE serology with a greater degree of resolution, we sought to determine if the different murine lupus strains modelled different types of SLE patients with respect to their serology. In this study, we investigated whether particular strains of mice are more efficient at modelling the pathogenic autoantigen-focused IgG autoantibodies or the less ominous polyreactive IgM antibodies.
Materials and methods
Mice
C57BL/6 (referred to here as ‘B6’), BXSB, BWF1, NZM2410 and MRL/lpr mice were purchased from The Jackson Laboratory (Bar Harbor, ME, USA). All mice were maintained in a specific pathogen-free facility. Sera were obtained from B6, BWF1 and NZM2410 strains at 8 months of age; and from BXSB and MRL/lpr strains at 4–6 months of age. These time-points were selected because mice begin developing disease beyond these age-points. Whereas males were used for the BXSB strain, all other mice were female. C57BL/6 (B6) was used as the non-lupus control strain, and no gender difference in autoantibodies was seen in this strain. All animal studies were approved by the University of Texas Southwestern Medical School Animal Use Review Committee.
Reagents
The antigens for the glomerular autoantigen array were prepared as described previously [4]. Total glomerular sonicates were obtained by harvesting glomeruli from B6 mouse kidneys [6]. Total chromatin was prepared from sheep red blood cells (RBCs), as described previously [7]. All other antigens for autoantigen array and ELISA were purchased from Sigma-Aldrich, Inova Diagnostics, Inc., BD Biosciences (San Diego, CA, USA), Roche Diagnostics (Indianapolis, IN, USA) or Chondrex, Inc. (Redmond, WA, USA).
Slide preparation and hybridization
The preparation of glomerular autoantigen array was performed as described previously [4]. The autoantigen array included 84 proteins antigens dissolved in phosphate-buffered saline (PBS) (or other buffers, as recommended by the manufacturer) and diluted to 1 µg/ml using the ‘printing’ buffer (0·06 M sodium bicarbonate, pH 9·5). 16-pad nitrocellulose-coated FAST™ slides were prewashed using PBS and double-deionized water and spin-dried for storage. After printing, the slides were incubated in a humid chamber, rinsed with PBS, spin-dried and stored at 4°C.
On the day of hybridization, the antigen-coated slides were washed using 0·1% Tween-20 in PBS, blocked with wash buffer containing 0·5% bovine serum albumin (BSA), rinsed and spin-dried. Up to 100 µl of the appropriately diluted serum sample (optimal dilution, 1:200) was applied to the slide, before incubation in a hybridization chamber at 37°C for 1 h. The slides were then washed and spin-dried. Cyanin 3 (Cy3)- or Cy5-labelled anti-IgM, anti-IgG and various isotype-specific detection antibodies (5 µg/ml; Jackson ImmunoResearch Laboratories, Westgrove, PA, USA) were then applied to the slides. Following 1 h of incubation at 37°C, the slides were washed and spin-dried. Finally, the slides were scanned using a GenePix 4000B scanner (Molecular Devices, Sunnyvale, CA, USA). Whereas the Cy3 signal (green) was scanned at 532 nM, the Cy5 signal (red) was scanned at 635 nM. All fluorescence intensities were normalized using mouse/human total Ig (Sigma-Aldrich, St Louis, MO, USA) spotted onto the same slide. To derive the normalized fluorescence intensity (nfi), the absolute fluorescence intensity against any given antigen was divided by the absolute fluorescence intensity for the Ig control spots, and the resulting ratio was multiplied by a factor of 1000. For each antigen, data obtained from duplicate or triplicate spots were averaged prior to any statistical comparison.
ELISA analysis for autoantibodies
Peripheral blood was isolated and allowed to clot, and serum was separated out by centrifugation. Sera were screened for total Ig or antibody reactivity to ssDNA, dsDNA and histones by ELISA, as described previously [8]. Autoantibody detection for glomerular lysate, myosin, Matrigel and thyroglobulin was similar to that described for anti-nuclear antibodies but used different coating concentrations, with glomerular sonicate used at 40 ug/ml and myosin, Matrigel and thyroglobulin used at 16 ug/ml. Negative (buffer alone) and positive (sera from an NZM2410 mouse with high levels of all autoantibodies) controls were included in each ELISA assay. Serum samples that exhibited autoantibody levels exceeding the positive control were diluted and reassayed.
Spontaneous lupus nephritis
Blood was isolated when the mice were killed and serum was separated for measuring blood–urea–nitrogen (BUN) using a urea nitrogen kit (Sigma-Aldrich), and measuring creatinine by using a kit purchased from Cayman Chemical (Ann Arbor, MI, USA). Kidneys were harvested when the mice were killed; half of each was fixed in 10% neutralized formalin for kidney pathology, as described below.
Histopathology
Three-µm sections of formalin-fixed, paraffin-embedded kidney tissues were cut and stained with haematoxylin and eosin (H&E) and periodic acid-Schiff. These sections were examined in a blinded fashion for any evidence of pathology in the glomeruli, tubules or interstitial areas, as described previously [9]. The glomeruli were screened for evidence of hypertrophy, proliferative changes, crescent formation, hyaline deposits, fibrosis/sclerosis and basement membrane thickening. The severity of glomerulonephritis (GN) was graded on a 0–4 scale as follows: 0, normal; 1, mild increase in mesangial cellularity and matrix; 2, moderate increase in mesangial cellularity and matrix, with thickening of the glomerular basement membrane (GBM); 3, focal endocapillary hypercellularity with obliteration of capillary lumina and a substantial increase in the thickness and irregularity of the GBM; and 4, diffuse endocapillary hypercellularity, segmental necrosis, crescents and hyalinized end-stage glomeruli. Similarly, the severity of tubulointerstitial nephritis (TIN) was graded on a 0–4 scale, based on the extent of tubular atrophy, inflammatory infiltrates and interstitial fibrosis, as detailed previously [10].
Data analysis
For intergroup comparisons, Student's t-test was used (SigmaStat version 2.0; Jandel Scientific, San Rafael, CA, USA). Heatmap diagrams with row-wise and column-wise clustering were generated using Cluster and TreeView software (versions 2.2 and 1.6, respectively; http://rana.lbl.gov/EisenSoftware.htm). In these diagrams, fluorescence intensities that were higher than the row mean were coloured red, those that fell below the row mean were coloured green and cells with signals close to the mean were left black. Missing data were denoted using grey.
Results
To permit high-throughput autoantibody detection, 16-pad nitrocellulose-coated FAST™ slides were used as the carriers of 84 protein antigens. We selected BXSB, BWF1, NZM2410 and MRL/lpr mice as lupus-prone disease strains, and used B6 mice as the negative controls. These lupus-prone mice have different genetic backgrounds but share clinical phenotypes of lupus. Having previously optimized the slide precoating chemistry, antigen coating concentrations, antibody/serum dilutions to use and the specificity and sensitivity profiles of the array [4], sera from all mouse strains were compared with respect to their reactivity profiles against the different autoantigens.
The sera from lupus mice, but not B6 mice, reacted strongly to most glomerular and nuclear antigens, as illustrated by the heatmaps in Fig. 1a,b. Both IgG and IgM autoantibody reactivities in each lupus mouse strain were compared between the different sample groups. For most autoantibody types, there was a significant increase in reactivity level for NZM2410, MRL/lpr and BWF1 mice compared with B6 (Fig. 2). However, no statistically significant differences were found between BXSB and B6 mice other than anti-dsDNA, which showed an increase (P < 0·01). Most of the IgG autoantibodies demonstrated a stepwise increase in antibody reactivities in the following order: BXSB, BWF1, NZM2410 and MRL/lpr, with MRL/lpr exhibiting the highest concentrations of IgG autoantibodies (Fig. 2). With the MRL/lpr lupus sera, the strongest IgG autoreactivity was noted against dsDNA and Matrigel, with nfi ranging from nearly 8000 to 30 000 nfi (Fig. 2). Compared with B6 sera, the sera from lupus mice such as MRL/lpr and NZM2410 also exhibited stronger IgG reactivities against myosin, collagen I–IV and Matrigel as well as chondroitin sulphate, lipopolysaccharide (LPS) and several other antigens, although these signals were somewhat weaker (100–1000 nfi) (Fig. 1a). Reactivity to some of the other glomerular antigens examined (e.g. amyloid, C1q, gliadin, etc.) was either absent or barely above background (data not shown).
Fig. 1.
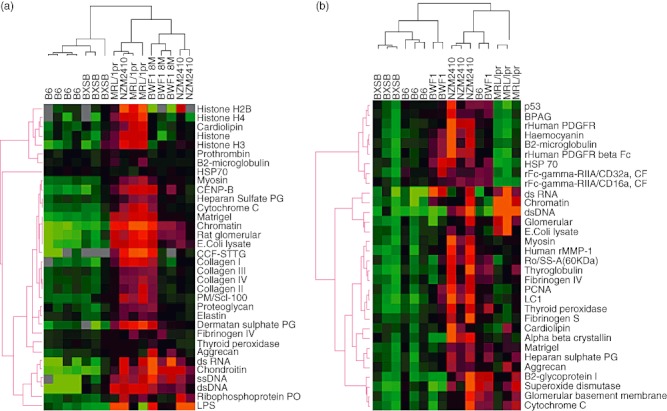
The use of autoantigen arrays to detect autoantibodies in murine lupus sera. Dilutions (1:200) of various sera were applied to HydroGel slides coated with different glomerular and nuclear antigens. Sera from B6, BXSB, New Zealand black (NZB)/NZ white (NZW) F1 female (BWF1), New Zealand mixed (NZM)2410, Murphy Roths large (MRL)/lpr mice were applied to the arrays and developed using cyanin (Cy)-dye coupled anti-mouse immunoglobulin (Ig)G (a) and IgM (b). Three to four serum samples from each mouse strain were studied and the data are summarized in a heatmap that shows the relative IgG and IgM seroreactivities of each. For all antigens, the reactivity intensities are depicted on a relative scale where reactivities above the array mean are red, while reactivities below are green. In addition, a clustering algorithm was used to group sera that exhibited similar reactivity patterns (dendrogram at top) and to cluster together antigens that were targeted similarly by the different test sera (dendrogram at left).
Fig. 2.
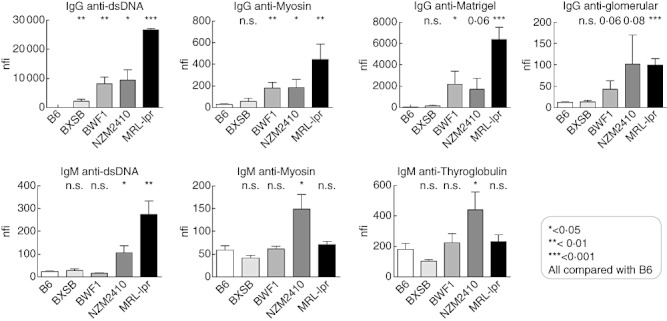
Immunoglobulin (Ig)G and IgM reactivity profiles to selected antigens in murine lupus, as determined using the antigen arrays. Above: the IgG seroreactivities to dsDNA, Matrigel, myosin and glomerular sonicate determined by autoantigen arrays in BXSB, New Zealand black (NZB)/NZ white (NZW) F1 female (BWF1), New Zealand mixed (NZM)2410, Murphy Roths large (MRL)/lpr sera (n = 3) are compared with the corresponding B6 levels (n = 4). P-values at the top indicate t-test results between different lupus strains compared with B6. *P < 0·05; **P < 0·01; ***P < 0·001. Below: the IgM seroreactivities using autoantigen arrays noted in lupus mice sera (n = 3) are compared with the corresponding B6 levels (n = 4). P-values at the top compare the BXSB, BWF1, NZM2410, MRL/lpr strains with B6.
The presence of serum IgM autoantibodies was also examined using the multiplexed antigen array technique. Among the mouse strains examined, most of the IgM autoantibodies demonstrated a stepwise increase in the following order: BXSB, BWF1, MRL/lpr and NZM2410, with NZM2410 exhibiting the highest level of IgM autoantibodies, even compared with MRL/lpr (Figs 1b and 2). As depicted in Fig. 1b, the strongest reactivity was again noted against dsDNA, chromatin and total glomerular sonicate in lupus sera, especially from MRL/lpr and NZM2410 mice. No reactivity was observed for these antigens in control sera. Weaker, but significant, concentrations of IgM autoantibodies were also noted against the same subset of antigens targeted by the IgG antibodies including myosin, Matrigel and thyroglobulin. Unlike the IgG autoantibodies, reactivity of IgM autoantibodies to dsDNA, chromatin and total glomerular sonicate was much weaker, ranging from 100 to 1000 nfi even in MRL/lpr lupus mice, and reactivity to other antigens was similar (Fig. 2). In summary, MRL/lpr and NZM2410 mice had increased amounts of serum IgM autoantibodies compared with other lupus strains, and BXSB exhibited the weakest serum Ig reactivities of all the lupus strains tested. Whereas the IgM autoantibodies in MRL/lpr mice were nuclear-antigen skewed, the IgM autoantibodies in NZM2410 mice appeared to be polyreactive (Fig. 1b).
For independent validation of the array results, we assayed antibody reactivity to ssDNA, dsDNA and chromatin (histone/DNA complexes) using ELISA. ELISA results corresponded well with our autoantigen array results. Both IgG and IgM ANAs showed significantly increased reactivity levels in NZM2410, MRL/lpr and BWF1 mice compared with B6 controls, with a stepwise increase in antibody reactivities in the following order: BXSB, BWF1, NZM2410 and MRL/lpr, with MRL/lpr exhibiting the highest concentrations of autoantibodies (Fig. 3). B6 mice exhibited very low-level ANAs, consistent with the array results.
Fig. 3.
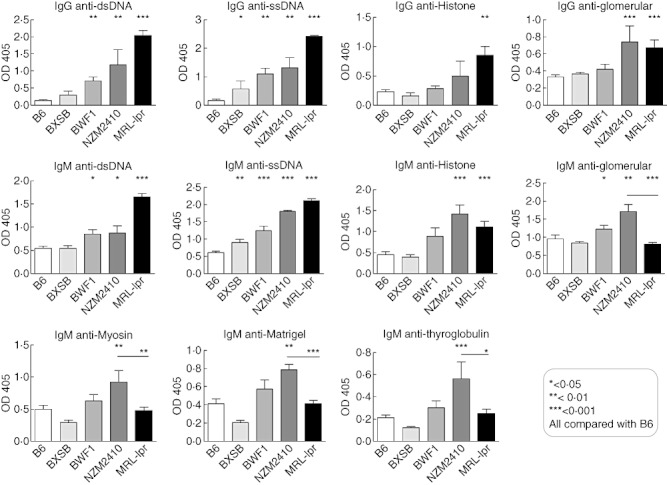
Enzyme-linked immunosorbent assay (ELISA) validation of serum levels of immunoglobulin (Ig)M and IgG antibodies to various antigens in BXSB, New Zealand black (NZB)/NZ white (NZW) F1 female (BWF1), New Zealand mixed (NZM)2410, Murphy Roths large (MRL)/lpr mice compared with B6 mice. IgM and IgG antibodies to the indicated nuclear and non-nuclear antigens were measured by ELISA. Each bar represents the mean optical density (OD)405 readings in each mouse strain, with error bars indicating standard deviation. The horizontal lines represent the mean levels of serum autoantibodies in each group of mice. P-values are the result of a Student's t-test comparison of BXSB (n = 3), BWF1 (n = 9), NZM2410 (n = 3), MRL/lpr (n = 6) mice with B6 mice (n = 5).
We also assayed IgM and IgG antibodies to glomerular lysate, myosin, Matrigel and thyroglobulin by ELISA and found that they also confirmed our autoantigen array results. IgG antibody levels showed significantly increased reactivity mainly in NZM2410 and MRL/lpr strains compared with B6. Furthermore, a stepwise increase in antibody reactivities was found in the following order: BXSB, BWF1, NZM2410 and MRL/lpr, with MRL/lpr mice exhibiting the highest concentrations of autoantibodies and BXSB exhibiting normal levels compared with B6. In contrast, IgM autoantibody levels reached the highest level in NZM2410 mice, rather than in MRL/lpr mice. Thus, compared to MRL/lpr mice, NZM2410 mice exhibited significantly higher levels of IgM anti-glomerular (P < 0·0001), IgM anti-Matrigel (P < 0·0001), IgM anti- thyroglobulin (P < 0·01) and IgM anti-myosin (P < 0·05) autoantibodies (Fig. 3). Although the BWF1 strain also exhibited increased IgM anti-glomerular antibodies relative to MRL/lpr mice (Fig. 3), it did not show statistical differences when reactivity levels for myosin, Matrigel or thyroglobulin were examined. Overall, these ELISA results confirmed the array-based findings.
Given that the NZM2410 and MRL/lpr murine lupus strains exhibited very different serological profiles (i.e. predominant IgG anti-nuclear reactivity versus IgM polyreactivity) that were reminiscent of the serological profiles that appeared to distinguish patients with severe lupus nephritis from others (4), we sought to determine if these two strains differed in renal disease. Whereas the MRL/lpr and NZM2410 mice exhibited a similar degree of glomerular and tubulointerstitial disease score, the MRL/lpr mice exhibited significantly more glomerular crescent formation (Fig. 4), consistent with the significantly elevated BUN and serum creatinine seen in this strain (Fig. 4).
Fig. 4.
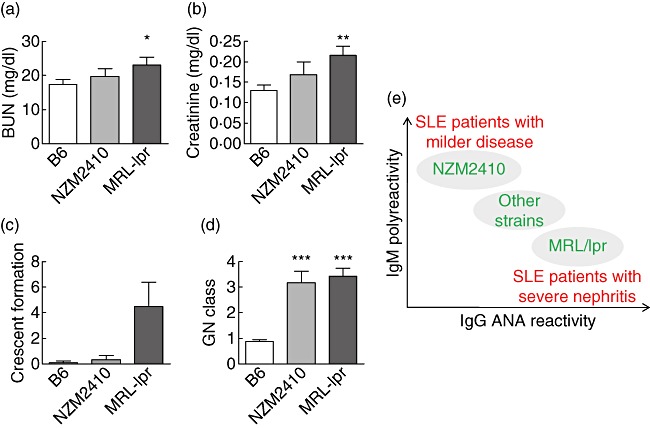
Degree of renal disease in B6, New Zealand mixed (NZM)2410 and Murphy Roths large (MRL)/lpr mice. Blood and kidney specimens from all strains were collected and analysed terminally. Mean value (±standard deviation) of the blood–urea–nitrogen (BUN) (a), creatinine (b) and kidney pathology results (c,d) in each strain are shown in bar-charts. Kidneys were examined by light microscopy for evidence and grade of glomerulonephritis (GN) (pathology score reflects GN class), glomerular crescent formation (expressed as a percentage of 100 glomeruli examined per mouse kidney), periglomerular infiltration, the grade of tubulointerstitial nephritis (TIN), as detailed in Materials and methods. Each bar represents a mouse strain. Data from NZM2410 (n = 3) and MRL/lpr (n = 6) strains were compared with the data from B6 (n = 17) using the t-test, and the corresponding P-values are depicted. (e) In previous array-based screens of human systemic lupus erythematosus (SLE) sera we noted that patients with strong immunoglobulin (Ig)G reactivity to DNA or glomerular antigens had the most severe renal disease, whereas patients with IgM polyreactivity had less severe disease (as indicated in red). Similarly, the present study illustrates that certain murine lupus strains may also recapitulate these differences seen in patients, as indicated in green. Hence, in both species, IgG anti-DNA reactivity and IgM polyreactivity emerge as two principle components that may help to discriminate lupus subjects with severe (renal) disease from those who do not.
Discussion
A wide range of autoantibodies has been identified in patients with SLE, and the detection of ANAs has long been a major component of the diagnostic approach in this disease. However, the spectrum of autoantibodies that could reasonably be measured is limited by the availability of reagents and technical obstacles to large-scale assays. The recent advent of multiplexed slide-based arraying approaches has made it possible to assay and screen simultaneously a large number of proteins or antibodies from a small amount of sera [4],[5].
In our previous studies, a multiplexed autoantigen array bearing about 30 antigens known to be expressed in the glomerular milieu was constructed and used to study serum autoantibodies in lupus patients and mice with active disease [4]. The use of these autoantigen arrays revealed five distinct clusters of IgG autoreactivity in the sera of lupus patients, with two of these being IgG reactivity clusters (DNA/chromatin/glomeruli and laminin/myosin/Matrigel/vimentin/heparan sulphate) that showed association with disease severity and classes III/IV GN. Human lupus sera also displayed two distinct IgM autoantibody clusters, one reactive to DNA and the other apparently polyreactive. Interestingly, the presence of IgM polyreactivity in patient sera was associated with reduced disease severity [4].
In order to ascertain how the serology in commonly studied mouse models of lupus might resemble the different serology profiles seen in SLE patients, we compared different anti-glomerular and anti-nuclear antibodies in several lupus strains using the same autoantigen arrays. Because all specificities were assayed using the same conditions on the same slides and normalized in an identical manner, this allowed us to compare reliably the relative amounts of the different antibody specificities [4].
The serology in MRL/lpr mice resembled most closely the serology in patients with severe lupus nephritis (LN). Thus, the observed degree of IgG autoreactivity to dsDNA and chromatin ranged from 10 000 to 30 000 nfi in MRL/lpr lupus mice (Fig. 2 and data not shown). These values were 500–1400-fold higher than the corresponding autoantibody levels in B6 control mice, and higher than all other murine lupus strains examined. In contrast, the presence of IgM autoantibodies was less remarkable. Whereas IgM anti-nuclear antibodies were elevated (Figs 1 and 2), IgM antibodies to non-nuclear or basement membrane autoantigens were only slightly increased in MRL/lpr mice, being 1·1–1·3-fold higher than control B6 levels (Fig. 3). Indeed, MRL/lpr sera exhibited similar patterns when total immunoglobulin was assayed – whereas MRL/lpr sera exhibited 4–8-fold increased levels of total serum IgG compared to BWF1, BXSB and NZM2410, these strains did not differ in their total IgM levels (data not plotted).
In contrast to the other strains, the serology in NZM2410 mice was strikingly different. Although IgG autoantibodies were also elevated, the profile of elevated apparently polyreactive IgM antibodies in this strain was unique, targeting multiple nuclear and non-nuclear antigens. It should be pointed out, however, that the apparent polyreactivity of the NZM2410 sera needs to be qualified further by examining monoclonal antibodies derived from these mice. Monoclonal IgM antibodies derived from NZM2410 mice do indeed bind multiple antigens, including oppositely charged histones and DNA [11]; however, a substantial fraction of the IgM monoclonals exhibited the ability to bind multiple antigen because of DNA containing nuclear material in their antigen-binding pockets [11]. These previous studies have also revealed that IgM monoclonal antibodies isolated from NZM2410 mice were less pathogenic than the IgG counterparts [11]. Previously, genetic dissection studies have also revealed that the locus that is most probably responsible for this IgM-skewed serological phenotype is Sle2 on chromosome 4 [12], a locus associated with B1 cell expansion and polyreactive antibodies.
The difference in serology between the MRL/lpr and NZM2410 strains is associated with another phenotypical difference. Whereas MRL/lpr mice exhibit proliferative lupus nephritis, renal disease in NZM2410 mice is less proliferative and more sclerotic [13]. When we compared the degree of nephritis in the NZM2410 and MRL/lpr mice used in this study, the latter mice exhibited increased azotaemia compared to the NZM2410 mice (Fig. 4). Although the two strains had comparable degrees of glomerular and tubulointerstitial inflammation, the MRL/lpr mice had significantly more glomerular crescent formation (Fig. 4). Although it is not clear if the difference in renal pathology in these two strains is related directly to the difference in serology, a very recent study offers direct evidence that serum IgM autoantibodies may be more protective in lupus [14].
We found that the BWF1 and BXSB strains had less pronounced serological phenotypes. Whereas the BWF1 mice exhibited intermediate levels of IgG and IgM autoantibodies, the BXSB mice exhibited only modest levels of autoantibodies. This has also been suggested in a previous study, which showed that MRL/lpr mice produce the largest numbers and highest percentage of cell-surface reactive IgG2a (22·4%)- and IgG3 (10·6%)-producing clones, followed by NZB mice and BXSB mice [15].
Most importantly, the present findings resonate well with previous observations in human SLE. Both SLE patients and mice exhibit a spectrum of IgM and IgG autoantibody reactivities, which can be resolved in two dimensions, dependent upon the predominant isotype (IgM versus IgG) and dominant autoantigen specificity (polyreactivity versus ANA-specificity), as illustrated in Fig. 4e. In general, it appears that SLE patients and lupus-prone mouse strains that have a dominant IgG anti-nuclear serology have more severe (renal) disease, whereas strains and patients with overwhelming IgM polyreactivity experience less severe disease. Thus, these array-based studies illustrate that the commonly studied different murine models of lupus reflect collectively different subsets of human SLE, as defined by serology and disease severity. Hence, rather than focusing on a single mouse model that best resembles human SLE, it would be prudent to learn from all these diverse mouse models, which mirror collectively the complexity of the human disease.
Many previous studies have also shown that IgG antibodies, including ANA as well as anti-myosin antibody, correlate with disease activity, while IgM polyreactivity may or may not be indicative of lupus. Burlingame et al. reported that IgG reactivity with the (H2A–H2B)–DNA complex, a subunit of the nucleosome, is present in the majority of patients with SLE, in >90% of patients with lupus induced by procainamide and in individual patients with lupus induced by a variety of other drugs, but is not seen in people taking these medications who are clinically asymptomatic [16]. Again, they found that IgG, but not other classes (IgM and IgA) of anti-(H2A–H2B)–DNA, is an early sign of procainamide-induced lupus [17]. Pateraki et al. have also found that sera from SLE patients had significantly higher IgG concentrations for antigens such as dsDNA, actin, tubulin, thyroglobulin, myosin and myoglobin compared with healthy controls [18]. Whereas anti-chromatin IgG was linked with the pathogenic process of lupus and glomerular immune complex deposition IgM, which was driven mainly by DNA-free histones, appear predominantly in asymptomatic patients [17],[19]. Fattal et al. have also investigated antibodies in SLE sera using an antigen microarray containing hundreds of antigens and found increases in IgG reactivities specifically to dsDNA, ssDNA, Epstein–Barr virus (EBV) and hyaluronic acid. However, specific IgM reactivities to myeloperoxidase (MPO), CD99, collagen III, insulin-like growth factor binding protein 1 (IGFBP1) and cardiolipin were decreased [20]. The association of severe SLE with decreased natural IgM autoantibodies suggests that these autoantibodies might indeed be protective against lupus nephritis.
In a scenario where IgG autoantibodies are elevated and IgM autoantibodies are decreased, one may anticipate two non-mutually exclusive processes taking place. First, the IgG autoantibodies may be directly pathogenic, playing a role in triggering and driving lupus nephritis. Secondly, the IgM autoantibodies may be playing an active role to suppress disease. Evidence for the first includes several studies that demonstrate the nephritogenic potential of monoclonal IgG autoantibodies upon adoptive transfer into healthy mice [11]. Evidence for the second possibility has only been published recently, where the adoptive transfer of IgM anti-DNA antibodies suppressed lupus nephritis actively in a mouse model [14]. Clearly, both processes may be operative simultaneously. Besides serving as a disease predictive tool, whether or not comprehensive array-based profiling could also help in dissecting underlying disease mechanisms remains to be explored.
Disclosures
None of the authors have any financial interests or benefits from commercial sources that relate to this work.
References
- 1.Arbuckle MR, McClain MT, Rubertone MV, et al. Development of autoantibodies before the clinical onset of systemic lupus erythematosus. N Engl J Med. 2003;349:1526–33. doi: 10.1056/NEJMoa021933. [DOI] [PubMed] [Google Scholar]
- 2.Pisetsky DS, McCarty GA, Peters DV. Mechanisms of autoantibody production in autoimmune MRL mice. J Exp Med. 1980;152:1302–10. doi: 10.1084/jem.152.5.1302. [DOI] [PMC free article] [PubMed] [Google Scholar]
- 3.Warren RW, Caster SA, Roths JB, Murphy ED, Pisetsky DS. The influence of the lpr gene on B cell activation: differential antibody expression in lpr congenic mouse strains. Clin Immunol Immunopathol. 1984;31:65–77. doi: 10.1016/0090-1229(84)90190-9. [DOI] [PubMed] [Google Scholar]
- 4.Li QZ, Xie C, Wu T, et al. Identification of autoantibody clusters that best predict lupus disease activity using glomerular autoantigen arrays. J Clin Invest. 2005;115:3428–39. doi: 10.1172/JCI23587. [DOI] [PMC free article] [PubMed] [Google Scholar]
- 5.Li QZ, Zhou J, Wandstrat AE, et al. Autoantigen array autoantibody profiles for insights into systemic lupus erythematosus and incomplete lupus syndromes. Clin Exp Immunol. 2007;147:60–70. doi: 10.1111/j.1365-2249.2006.03251.x. [DOI] [PMC free article] [PubMed] [Google Scholar]
- 6.Xie C, Sharma R, Wang H, Zhou XJ, Mohan C. Strain distribution pattern of susceptibility to immune-mediated nephritis. J Immunol. 2004;172:5047–55. doi: 10.4049/jimmunol.172.8.5047. [DOI] [PubMed] [Google Scholar]
- 7.Mohan C, Adams S, Stanik V, Datta SK. Nucleosomes: a major immunogen for pathogenic autoantibody-inducing T cells of lupus. J Exp Med. 1993;177:1367–81. doi: 10.1084/jem.177.5.1367. [DOI] [PMC free article] [PubMed] [Google Scholar]
- 8.Mohan C, Morel L, Yang P, et al. Genetic dissection of SLE pathogenesis: a recipe for nephrophilic autoantibodies. J Clin Invest. 1999;103:1685–95. doi: 10.1172/JCI5827. [DOI] [PMC free article] [PubMed] [Google Scholar]
- 9.Xie C, Zhou XJ, Liu X, Mohan C. Enhanced intrinsic susceptibility to renal disease in the lupus facilitating NZW strain. Arthritis Rheum. 2003;48:1080–92. doi: 10.1002/art.10887. [DOI] [PubMed] [Google Scholar]
- 10.Zhou XJ, Laszik Z, Wang XQ, Silva FG, Vaziri ND. Association of renal injury with increased oxygen free radical activity and altered nitric oxide metabolism in chronic experimental hemosiderosis. Lab Invest. 2000;80:1905–14. doi: 10.1038/labinvest.3780200. [DOI] [PubMed] [Google Scholar]
- 11.Liang Z, Xie C, Chen C, et al. Pathogenic profiles and molecular signatures of antinuclear autoantibodies rescued from NZM2410 lupus mice. J Exp Med. 2004;199:381–98. doi: 10.1084/jem.20030132. [DOI] [PMC free article] [PubMed] [Google Scholar]
- 12.Mohan C, Morel L, Yang P, Wakeland EK. Genetic dissection of systemic lupus erythematosus pathogenesis: Sle2 on murine chromosome 4 leads to B cell hyperactivity. J Immunol. 1997;159:454–65. [PubMed] [Google Scholar]
- 13.Theofilopoulos AN, Dixon FJ. Murine models of systemic lupus erythematosus. Adv Immunol. 1985;37:269–390. doi: 10.1016/s0065-2776(08)60342-9. [DOI] [PubMed] [Google Scholar]
- 14.Jiang C, Zhao ML, Scearce RM, Diaz M. Activation-induced deaminase- deficient MRL/lpr mice secrete high levels of protective antibodies against lupus nephritis. Arthritis Rheum. 2011;63:1086–96. doi: 10.1002/art.30230. [DOI] [PMC free article] [PubMed] [Google Scholar]
- 15.Yin BW, Wong GY, Lloyd KO, Oettgen HF, Welt S. Increased yields of IgG2a- and IgG3-secreting hybridomas after fusion of B cells from mice with autoimmune diseases. J Immunol Methods. 1991;144:165–73. doi: 10.1016/0022-1759(91)90083-r. [DOI] [PubMed] [Google Scholar]
- 16.Burlingame RW, Rubin RL. Autoantibody to the nucleosome subunit (H2A–H2B)–DNA is an early and ubiquitous feature of lupus-like conditions. Mol Biol Rep. 1996;23:159–66. doi: 10.1007/BF00351164. [DOI] [PubMed] [Google Scholar]
- 17.Rubin RL, Burlingame RW, Arnott JE, Totoritis MC, McNally EM, Johnson AD. IgG but not other classes of anti-[(H2A–H2B)–DNA] is an early sign of procainamide-induced lupus. J Immunol. 1995;154:2483–93. [PubMed] [Google Scholar]
- 18.Pateraki E, Kaklamani E, Kaklamanis P, Portocalas R, Aessopos A. AutoANA in systemic lupus erythematosus and normal subjects. Clin Rheumatol. 1986;5:338–45. doi: 10.1007/BF02054252. [DOI] [PubMed] [Google Scholar]
- 19.Burlingame RW, Rubin RL. Drug-induced anti-histone autoantinuclear autoantibodies display two patterns of reactivity with substructures of chromatin. J Clin Invest. 1991;88:680–90. doi: 10.1172/JCI115353. [DOI] [PMC free article] [PubMed] [Google Scholar]
- 20.Fattal I, Shental N, Mevorach D, et al. An antibody profile of systemic lupus erythematosus detected by antigen microarray. Immunology. 2010;130:337–43. doi: 10.1111/j.1365-2567.2010.03245.x. [DOI] [PMC free article] [PubMed] [Google Scholar]