

Abstract
Biomechanical analyses are commonly conducted to investigate how craniofacial form relates to function, particularly in relation to dietary adaptations. However, in the absence of corresponding muscle activation patterns, incomplete muscle data recorded experimentally for different individuals during different feeding tasks are frequently substituted. This study uses finite element analysis (FEA) to examine the sensitivity of the mechanical response of a Macaca fascicularis cranium to varying muscle activation patterns predicted via multibody dynamic analysis. Relative to the effects of varying bite location, the consequences of simulated variations in muscle activation patterns and of the inclusion/exclusion of whole muscle groups were investigated. The resulting cranial deformations were compared using two approaches; strain maps and geometric morphometric analyses. The results indicate that, with bite force magnitude controlled, the variations among the mechanical responses of the cranium to bite location far outweigh those observed as a consequence of varying muscle activations. However, zygomatic deformation was an exception, with the activation levels of superficial masseter being most influential in this regard. The anterior portion of temporalis deforms the cranial vault, but the remaining muscles have less profound effects. This study for the first time systematically quantifies the sensitivity of an FEA model of a primate skull to widely varying masticatory muscle activations and finds that, with the exception of the zygomatic arch, reasonable variants of muscle loading for a second molar bite have considerably less effect on cranial deformation and the resulting strain map than does varying molar bite point. The implication is that FEA models of biting crania will generally produce acceptable estimates of deformation under load as long as muscle activations and forces are reasonably approximated. In any one FEA study, the biological significance of the error in applied muscle forces is best judged against the magnitude of the effect that is being investigated.
Keywords: Cranial deformation, finite element analysis, geometric morphometrics, multibody dynamic analysis, muscle activation, sensitivity study
Introduction
In this paper we assess the sensitivity of a finite element analysis (FEA) model of a macaque cranium to varying muscle loads because there is often uncertainty about what muscle loads should be applied in such studies. The magnitude of force produced by a muscle is a product of its physiological cross-sectional area (PCSA), maximum muscle stress (N cm−2) and degree of muscle activation. During biting, the masticatory system functions as a lever transferring forces generated by jaw-closing muscles to the items held between the teeth. As the jaw opens and closes, muscles vary in their lines of action and their force production capacity. Consequently, for a specific biting task, the recruitment patterns of the muscles of mastication will vary according to the degree of jaw opening, bite location, bite direction and magnitude of biting force required (Pruim et al. 1978; Manns et al. 1979; Hylander & Johnson, 1985; van Eijden, 1990; Lindauer et al. 1993; van Eijden et al. 1993; Mao & Osborn, 1994; Blanksma & van Eijden, 1995; Paphangkorakit & Osborn, 1997; Spencer, 1998; Farella et al. 2002; Olmsted et al. 2005). In recent years, many in vivo electromyographic (EMG) studies have been conducted in relation to primate masticatory function (Hylander et al. 2000, 2005; Ross & Hylander, 2000; Vinyard et al. 2005, 2006; Wall et al. 2006). Muscle activations recorded experimentally have consistently demonstrated a high degree of variability interspecifically, intraspecifically, within an individual, during different feeding tasks and during different masticatory cycles of a particular feeding bout (Doty & Bosma, 1956; Shaffer & Lauder, 1985; German et al. 2008; Vinyard et al. 2008). EMG activity has been shown to vary due to differences in the food material and mechanical properties (Agrawal et al. 1998; Hylander et al. 2000; Peyron et al. 2002; Vinyard et al. 2008), and to be related to differences in muscle morphology, including: the mechanical advantages of muscles (Maynard Smith & Savage, 1959; Herring, 1992); muscle internal anatomy (Herring et al. 1979; van Eijden et al. 1997; van Eijden & Turkawski, 2001; Vinyard & Taylor, 2010); and other factors, such as the morphology of the teeth and bones (Hylander et al. 2000, 2005; Vinyard et al. 2005, 2006, 2008). The jaw-closing muscles are also architecturally complex, meaning that when carrying out submaximal bites they can be recruited in different ways (Hylander, 1979), yet achieve the same force.
This variability in muscle activation patterns adds a degree of complexity to biomechanical modelling. In particular, over the last decade, functional morphologists have applied the engineering approach of FEA to a range of extant and extinct primate species (e.g. Ross et al. 2005, 2011; Strait et al. 2007, 2009; Kupczik et al. 2007; Wroe et al. 2007; Panagiotopoulou et al. 2010; Wang et al. 2010; Chalk et al. 2011; Cobb & Panagiotopoulou, 2011; Gröning et al. 2011), with the aim of understanding skull anatomy, adaptation and development, with regard to masticatory biomechanics. However, in order to carry out FE modelling and simulate a feeding task, the relevant muscle loading is required. Ideally the skull under examination should possess individually specific muscle activation patterns recorded in vivo. However, to date this has not been the case and, indeed, is not feasible for most comparative studies of primates. Thus, while it is known from EMG experimental studies that the activation patterns of the masticatory muscles vary between individuals and during different feeding tasks, muscle activation patterns acquired for one individual experimentally are often substituted in FEAs of different individuals (Ross et al. 2005, 2011; Strait et al. 2007, 2009; Kupczik et al. 2007; Wroe et al. 2007; Panagiotopoulou et al. 2010; Wang et al. 2010; Chalk et al. 2011; Cobb & Panagiotopoulou, 2011; Gröning et al. 2011). Muscle loadings used in biomechanical models are therefore frequently not related to the specific individual being studied, yet the effects such assumptions have on skull deformation and FEA interpretation are not well understood. Applying non-individual specific loadings is almost inevitable, particularly for fossils where muscle data are completely lacking (Strait et al. 2009). The effects need to be understood because errors in applied muscle forces could well swamp the effects under investigation, for instance, differences in skull deformations between different (e.g. molar bites in) simulated feeding tasks.
Here we aim to assess the impacts of errors in applied muscle loads by using varying muscle activations in a single FE model of a macaque cranium (Macaca fascicularis). In order to create a series of loading conditions where only the muscle activation pattern varies (i.e. bite direction, magnitude and gape remain constant and thus controlled for), we use multibody dynamics analysis (MDA). Using MDA we can estimate muscle activations based on an optimisation criterion, in this case, minimising total muscle energy (proportional to muscle stress) for various biting tasks (Rasmussen & Voigt, 2001; Heintz & Gutierrez-Farewik, 2007). Using this approach a number of activation patterns can be predicted for the same individual, reflecting the variability of recruitment patterns found in vivo (Hylander, 1979), but all producing the same bite (direction and magnitude) with the masticatory apparatus held in equilibrium. The optimisation criterion can also be used to produce extreme experimental muscle activation patterns, reflecting what may occur, for example, when various muscles of mastication are omitted from the model (e.g. when their force vectors are unknown, or for model simplification). Using these pseudo-realistic muscle loadings, the role that each muscle of mastication plays in subsequent cranial deformation during biting can be examined. Such an approach would not be feasible using in vivo data.
Multibody dynamics analysis has been applied extensively to locomotor studies, and more recently to studies of masticatory biomechanics in fish (Westneat, 2003), pigs (Koolstra & van Eijden, 1997, 1999; Langenbach et al. 2002, 2006), lizards (Moazen et al. 2008a; Curtis et al. 2010), humans (Langenbach & Hannam, 1999; Sellers & Crompton, 2004; Koolstra & van Eijden, 2005) and non-human primates (Curtis et al. 2008). We use MDA here to simulate biting forces of 100 N (which are less than the maximal forces predicted by MDA at all bite points) at various bite points along the dental row, and to predict the optimal muscle activation pattern for the individual. In order to test the sensitivity of FEAs to muscle activation patterns, we subsequently generate permutations of these that produce the same sub-maximal bite force of 100 N at one particular bite location, the upper second molar, while the system is held in equilibrium. This results in several activation scenarios which, while different in relative and absolute activation patterns of muscle, all produce the required biting task and force. These varying loading conditions are then applied to a FE model, and we examine how it deforms in response to these varying loading regimens (Koolstra & van Eijden, 2005; Curtis et al. 2008, 2010; Moazen et al. 2008b).
Materials and methods
Model creation
The cranium and mandible of an adult male M. fascicularis (referred to as Mac17) were segmented from a MicroCT (voxel size: 0.142 × 0.142 × 0.142 mm; X-Tek HMX 160 μCT system; X-Tek Systems, Tring, UK) using Avizo image-processing software (Visualisation Sciences Group, USA). Bone and teeth were separated from the surrounding air by a user-defined density threshold based on the half-maximum height protocol (Spoor et al. 1993). The model was subsequently downsampled to a voxel size of 0.428 × 0.428 × 0.428 mm to reduce processing time. During a previous dissection of this macaque (Kupczik et al. 2007), muscle attachment points were recorded and PCSA calculated for the main muscles of mastication following the protocol in Anapol & Barry (1996). These anatomical data are used in subsequent FE modelling and MDA.
Multibody dynamics model
A three-dimensional multibody model of Mac17 was developed within ADAMS (MSC Software, USA). The model incorporated a fixed cranium, a moveable mandible with 6 degrees of freedom, three-dimensional representations of the temporomandibular joints (TMJs) and the main muscles of mastication (Fig. 1a). Both jaw-closing and -opening muscles were modeled, although jaw-opening muscles are not considered further in this study because their activations are negligible. The jaw-closing muscles include the fan-shaped temporalis muscle (PCSA of 4.94 cm2) divided equally into anterior and posterior functional parts; the deep (1.40 cm2) and superficial bellies of masseter (1.99 cm2), the medial pterygoid (2.61 cm2), and the superior head of the lateral pterygoid. The superior head of the lateral pterygoid was modelled because it has been previously associated with posterior retraction of the mandible caused by biting (Osborn & Baragar, 1985; Osborn, 1995; Hiraba et al. 2000). This muscle was not dissected, instead PCSA data published in Anton (2000) for the upper range of M. fascicularis females were used (0.14 cm2). All muscle groups were modelled as strands passing from origin to insertion, including extremes of attachment areas. The temporalis muscle was wrapped over the surface of the cranium by splitting the strands into five serial sub-strands connected to one another by small contact spheres that slide over the surface of the cranium as they act (see Curtis et al. 2008 for further details).
Fig. 1.
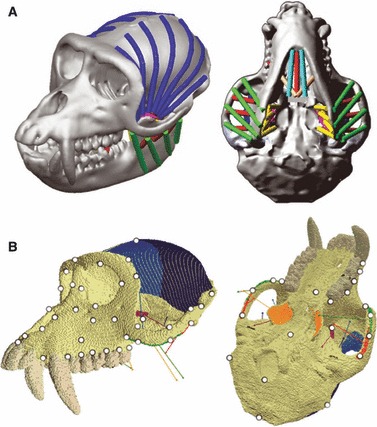
(a) MDA model of M. fascicularis showing a left M2 bite at 3 degrees of jaw opening, the jaw-closing muscles are represented as strands: green; superficial masseter, red; deep masseter, yellow; medial pterygoid; pink; sup. lat. pterygoid and blue; post. and ant. temporalis. (b) Macaca fascicularis FE model boundary conditions. Jaw-closing muscle forces from MDA are applied to the coloured regions, and the common vector of action for each muscled region is shown by a line in the same colour; green; superficial masseter, red; deep masseter, orange; medial pterygoid; purple; sup. lat. Pterygoid; dark blue; post. temporalis and light blue; ant. temporalis. The glenoid fossae are constrained in all directions and the bite points are constrained in the y (vertical). Seventy landmarks used in the GMM analyses to assess deformation of the skull under the various loading scenarios are displayed as white dots.
Hill-type muscle models were applied (van Ruijven & Weijs, 1990), comprising an active muscle force (contractile element) in series with a passive muscle force (elastic element). Peak muscle forces (Fmax) were calculated as PCSA multiplied by a muscle stress constant of 37 N cm−2 (Weijs & Hillen, 1985). The muscle force generated in any particular biting task is the product of Fmax, the muscle’s active force/length relationship (FA), an activation factor (FQ) and a passive muscle tension (FP). In our modelling the passive tension of the muscle reached a maximum of 0.3 N and FA was constant. Thus, the force produced by each muscle group in each particular bite is principally controlled by the unknown activation factor FQ. The activation factor was specified as a design variable within a specialist unit of ADAMS (ADAMS/Insight), and was defined to have a range of 0–1 (i.e. no activity–100% activity).
To estimate muscle activation factors (FQ) biting simulations were carried out in ADAMS using a spring element positioned unilaterally (on the left side of the skull) between the upper and lower teeth in question. The jaw was opened so that 3 degrees of rotation at the joint was produced. While this produced a different gape at each tooth, the muscle orientation and stretch remained the same, keeping FA and FP constant. The jaw was first opened (during which time the spring element was specified to carry no resistance) and then a biting simulation was undertaken with the spring element made stiff. The force generated in the spring element is equivalent to bite force. The location of the mandibular condyle on the articular eminence at this gape angle was determined from the measurement of 130 macaque heads that were scanned following death with jaws at different gapes (assuming a linear fit, R2 = 0.87; JF Shi, unpublished data). To compensate for the totally unconstrained contact between the condylar head and articular surface, antero-posterior and medio-lateral bushing sensors were included at each joint to simulate the stabilising role of the joint capsule and temporomandibular ligament (Koolstra & van Eijden, 1999, 2001; Koolstra, 2002). Each MDA solution then predicted the muscle forces needed to produce not only the required bite force but also minimal reaction forces in the bushings. Using these output data from multiple (non-optimal) solutions, optimisation was then carried out to determine the optimum muscle recruitment solutions for the specified bite force at each of the different bite locations. The optimisation criterion we used was the minimisation of squared muscle stress, which appears to effectively predict muscle recruitment patterns in M. fascicularis under various biting scenarios (JF Shi, N Curtis, LC Fitton, P O’Higgins, MJ Fagan, unpublished data). Optimisation was achieved using a genetic algorithm available within ADAMS.
Muscle activation patterns were predicted for unilateral bites: first incisor (I1), second incisor (I2), first premolar (P1), second premolar (P2), first molar (M1), second molar (M2) and third molar (M3), with the jaw rotated to 3 degrees. Canine bites were excluded from the present analyses because the large gapes required during canine biting would have altered the lengths and orientations of the muscles and introduced additional sources of error. These biting tasks were simulated with the model optimised to produce a force of 100 N, which is less than the maximum predicted at each bite point.
In order to test the sensitivity of the FE models to variations in activation patterns 10 different (sub-optimal) activation patterns, each producing a 100 N bite at the M2, were also derived by limiting the peak activation of a particular muscle and optimising all muscle forces as before. Six further optimised loadcases were derived omitting various muscles or muscle parts to investigate the effects of selective exclusion (deactivation). These activation patterns were applied to a series of 24 FEAs, described below, in order to assess the impact on cranial deformation of varying bite points, forces, muscle activations and exclusions.
FEAs
The segmented 3D volume of the Mac17 cranium was exported as BMP stacks and converted, into eight-noded linear brick FE meshes, by direct voxel conversion (i.e. each voxel was converted into a FE). This resulted in FE models consisting of 724 095 elements. The FEA was performed using VOX-FE, our custom FEA pre- and post-processing voxel-based software (Liu et al. 2012). A Young’s modulus of 17 GPa was assigned to bone (Kupczik et al. 2007) and teeth. All materials were modelled as linear elastic and isotropic with a Poisson’s ratio of 0.3. The model was constrained at the working (left) side tooth in the infero-superior direction and the glenoid fossae in all three directions (x, y, z; Fig. 1b). Muscle forces for each loadcase were calculated by multiplying PCSA by muscle intrinsic stress (37 N cm−2; Weijs & Hillen, 1985) to obtain the maximum muscle force and then scaling to actual muscle force using the % activation predicted via MDA. Muscle attachments were observed from previous dissections, and muscle orientations, at 3 degrees of jaw rotation, were obtained from MDA. The predicted muscle forces were incorporated into FE models with each loadcase run sequentially. The voxel-based models were solved using VOX-FE.
FEA interpretation
The deformations resulting from the FEA were represented by series of strain maps (Figs 2, 4 and 6) to facilitate visual comparison of results. Further, large-scale deformation of the cranium was quantitatively compared between loadcases (Figs 3, 5, and 7) using geometric morphometric approaches (O’Higgins et al. 2011) applied to the 3D coordinates of the same landmark configuration taken from the unloaded and loaded models (Fig. 1b). The use of geometric morphometric methods (GMM) facilitates the assessment of variations in form (size and shape) among landmark configurations taken on different specimens (or in this case loadcases) using multivariate methods (Bookstein, 1991; O’Higgins, 1997; Dryden & Mardia, 1998; Rohlf, 2000; Slice, 2005, 2007). These methods lead to quantitative descriptions of cranial deformation under loading as represented by alterations in the size and shape of the landmark configuration. Such analyses do not consider forces, energies, material properties, which are best approached through standard engineering analyses of stress and strain. Rather they lead to visual appreciation and comparison of how whole or part skeletal elements deform in terms of changes in the form of landmark configurations. The distance metric used here is that of form space [shape including log(centroid size)]. Arguably using an alternative space in which size is retained without using the logarithm would give it a weighting more appropriate to engineering assessment of deformations. This issue requires further investigation and theoretical development in future studies. In any case, here we found negligible differences between these alternatives as size varies very little relative to shape among deformed crania.
Fig. 2.
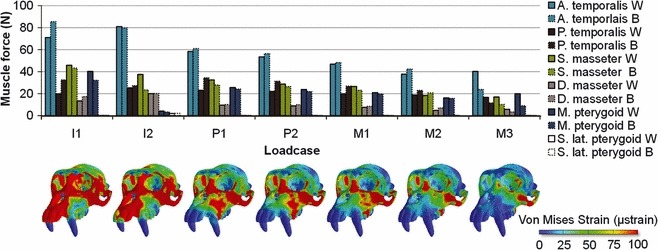
Muscle forces predicted via MDA during 100 N bites at each tooth for both working and balancing side muscles. Colour maps of von Mises strain are displayed beneath the corresponding loadcases.
Fig. 3.
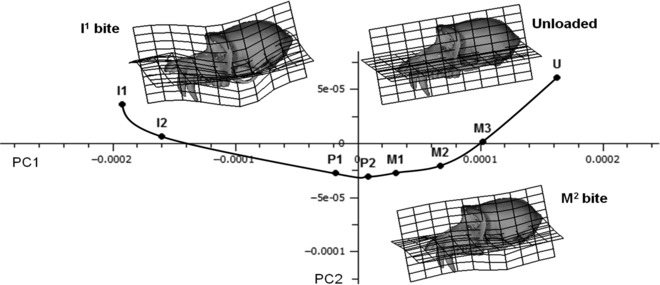
PCA of 70 Procrustes registered coordinates representing overall cranial deformation during different 100 N biting tasks. PC1 (91% total variance) vs. PC2 (7%). U represents the unloaded and thus undeformed macaque cranium; M3–I1 represents the deformations due to biting on specific teeth. A smooth curve joins these points. The deformations are visualised using transformation grids and a deformed surface. The grids are drawn vertically through the left zygomatic region, and horizontally through the maxilla and cranial base. The reference specimen for the transformation grids is U, with the target specimens being I1 and M2 bites.
It is of interest to understand the impact of landmark choice on the assessment of deformations. To these ends, sensitivity analyses were first carried out comparing deformations among different loadcases. A dense landmark configuration (comprising 300 points on surfaces and at the locations of some anatomical features, including those landmarks displayed in Fig. 1b) was located over the model using Avizo. Note that there is no issue of homology in comparing deformations as these analyses relate to the same FE model. The resulting Procrustes form distance matrix between all models (unloaded and loaded) was computed for sequential analysis using progressively reduced numbers of landmarks. The resulting matrices were then compared with that from the full set of landmarks. The resulting matrix correlations were very high (> 0.97) when landmarks were removed in such a way that anatomical coverage remained even, but when specific regions, especially the zygomatic arch, were denuded of landmarks the matrix correlations diminished markedly (∼0.7). Seventy anatomical landmarks (Fig. 1b) resulted in a distance matrix that strongly correlated (r = 0.96) with the matrix from 300 landmarks, and appears optimal in this study from the perspective of minimising computations while preserving information regarding all aspects of deformation.
In subsequent analyses the 70 landmarks from the unloaded case and each loadcase were subjected to generalised Procrustes analysis followed by principal components analysis of the resulting shape variables plus the natural log of centroid size (form space analysis, see above). The GMM analyses were carried out using the EVAN toolkit (http://www.evan.at/). Results are presented as principal component plots, and deformations (multiplied sufficiently to make them interpretable) are visualised using a warped macaque surface with superimposed transformation grids computed using triplets of thin plate splines between the reference and target loadcases. The resulting transformation grids indicate relative stretchings and contractions of the space in the vicinity of the landmark configuration, but because it is interpolated it cannot be used to assess strains, these are appropriately examined directly using the strain maps. Rather the visualisation is a convenient graphic to aid understanding of how the skull deforms at a much larger scale than is used to compute the strain map.
Loadcases: muscle activation patterns and biting force
In order to investigate the sensitivity of FEAs to variations in muscle activation patterns we focused on the effects on deformations arising from M2 bites of constant magnitude. Thus, 24 loadcases were run in total; eight using optimised activation patterns from MDA to simulate a 100 N bite on each tooth along the working side dental row; 10 representing different activation patterns that each produced 100 N bites on the M2; six representing 100 N bites on the M2 with a major jaw-closing muscle group excluded in each case.
Inevitably, the FEA simulation differed slightly in detail from the MDA. In the former, muscles were connected to every node on the surface where the muscles attached and possessed a simple force vector. In comparison, muscles in the MDA model were represented by series of strands, with wrapping of the temporalis (compare Fig. 1a and b). In consequence when the forces derived from MDA were applied to FEA, the resulting bite forces [assessed by computing the sum of reaction forces (N) at the constrained nodes located on the biting tooth] were not exactly the same as those predicted by MDA. Bite magnitude for this study varied by less than 3% for most loadcases, but some muscle activation patterns (especially for some excluding whole muscle groups) resulted in bite forces from FEA that were 10% less than predicted by MDA. Such differences in the bite reaction forces predicted between models were unacceptable in this study. Therefore, the resulting cranial deformations for each loadcase were scaled linearly to ensure a response to a constant 100 N bite reaction force (rather than, e.g. a 95 N bite). This scaling was carried out by first computing the actual bite forces produced in the FEA, and then the strains and deformations (in the GMM analyses) were scaled according to the ratio between measured bite force and 100 N bite. This scaling was acceptable because it was a linear elastic analysis and the magnitude of biting force has previously been shown not to influence the muscle recruitment pattern (van Eijden, 1990; Mao & Osborn, 1994; Farella et al. 2002).
Results
Optimised muscle activations from MDA resulting in 100 N bites at each tooth
We first characterised the effects on cranial deformation of varying the bite location. Loadcases were predicted for fully MDA-optimised 100 N unilateral bites at each tooth along the left side dental row. This allowed us to later assess the magnitudes of ‘errors’ associated with muscle activation patterns by relating deformations due only to variations in muscle activation to the differences in cranial deformation due to bite point.
Figure 2 presents the muscle forces (calculated from the predicted working and balancing side activations) used to generate 100 N of vertical bite force at each tooth along the dental row together with maps of surface von Mises strains for each bite. Anterior temporalis and superficial masseter have the greatest activations (and thus increase in force) during the more mesial incisor bites, with the posterior temporalis increasing slightly in relative activation during biting on the more distal molars. As expected from simple lever mechanics, in order to maintain a 100 N bite, absolute muscle activations are greater when biting at the mesial than the distal teeth (Fig. 2). Consequently, when compared with the other loadcases the incisor bites generate relatively higher levels of strain in the nasal, premaxillary and circum-orbital regions (Fig. 2). The P1, P2 and M1 bites produced similar patterns and levels of strain distribution. During these bites there is a graded reduction in the magnitudes of muscle activations from more mesial to more distal bite locations, but the pattern of relative muscle activations appears quite similar; 100 N bites at M2 and M3 require much less muscle activation than do bites at the incisors, and somewhat less than bites at the premolars and first molar. Not surprisingly this, combined with the structural characteristics of the beam-like rostrum, results in generally lower levels of von Mises strain in premolar and molar bites than in incisor bites of 100 N. The distribution of von Mises strain magnitudes differs markedly between molar and incisor bites, with peri-nasal regions showing large strains in the case of incisor bites, and the lateral and more posterior aspects of the maxillary alveolus being more strained in more distal bites. In all cases the zygomatic region shows large von Mises strains but these diminish with more distal bite points, in concert with the diminution of superficial and deep masseter activation. The overall impression is of a clear trend in the spatial distribution of von Mises strain magnitudes and general diminution in the overall level of strain as the bite point shifts from incisors to molars.
Form space principal components analysis (PCA) leads to an alternative representation of these deformations. Thus, the plot of PC1 (91% total variance) vs. PC2 (7%) in Fig. 3 indicates that the most distal bites deform the cranium least, with the point representing the cranium deformed by the M3 bite being closest to the unloaded skull (U) and progressively more mesial bites resulting in progressively greater distance from the unloaded. Additionally, the points representing the deformed cranium from successively more mesial or distal bites are arranged in an ordered, smooth curve.
The deformations that this curve represents are visualised in Fig. 3 using two warped surface models with superimposed transformation grids computed between the unloaded specimen (U – with reference grids and surface shown in Fig. 3) and M2 and I1 bites. The warpings have been exaggerated by a factor of 500 to aid visualisation because the actual magnitudes of the deformations are very small. With decreasing PC1 scores (M3–I1 bites) there is an increase in dorso-ventral bending of the rostrum. PC2 appears to reflect torsion within the rostrum, with unilateral biting on P2 producing the greatest degree and incisor bites the least. During all biting tasks there is a considerable degree of downward deflection of the zygomatic arch. Higher PCs show little of interest and account for a very small percentage of total variance. The low dimensionality reflects the simplicity of our experiment; simulated loadcases differing principally in bite point and overall absolute (rather than relative) muscle activation.
Ten different activation patterns each producing the same bite
The 10 different muscle activation combinations and loads producing 100 N of vertical bite force at M2 are presented in Fig. 4. Compared with the fully optimised M2 loadcase used in this study (Fig. 2), muscle activations were allowed to vary while maintaining a bite force of 100 N. In consequence, medial pterygoid force differed by up to 15.51 N; anterior temporalis, 15.23 N; superficial masseter −13.07 N; posterior temporalis, −11.08 N; deep masseter, −9.68 N; and superior lateral pterygoid, −1.16 N. While small, these differences are representative of ‘errors’ in muscle forces that are frequently introduced to FEA studies of cranial function. Furthermore, they vary considerably more than the activation patterns predicted here for different bites. With increasing anterior temporalis activation there is frequently an accompanying decrease in superficial masseter muscle activity and vice versa; however, the relationship is not consistent and in some cases other muscles have increased activation to compensate for the loss in overall muscle force when these two main muscles decrease in activation.
Fig. 4.
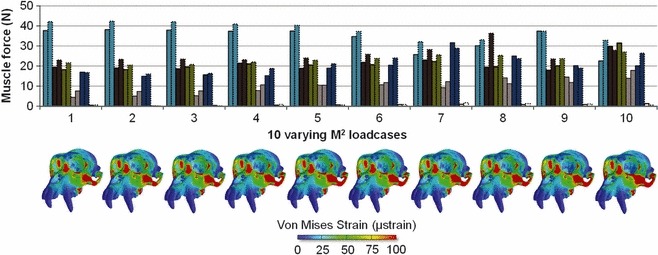
Ten different muscle activation patterns (loadcases) predicted via MDA, each produces a 100 N bite at the M2. Colour maps of von Mises strain are displayed beneath the corresponding loadcases.
The corresponding von Mises strain maps are shown in Fig. 4. Visually and within the limits of the contour ranges, they appear similar to that for the fully optimised muscle activation M2 loadcase in Fig. 2, differing principally in the extent to which strains are large over the zygomatic arch and maxillary root. The cases have been ordered according to the combined force of deep and superficial masseter, and this ordering corresponds to ordering of magnitudes of zygomatic strain. Other regions of high strain, for example the nasal region and orbital rim, appear relatively unaffected by alterations in masseter activity. Interestingly, loadcases 7 and 2, in which the medial pterygoid was more or less active, produced no obvious difference in the facial strain distribution, although some isolated increases in von Mises strain were evident at elements closer to the muscle’s origin.
Form space PCA was carried out on these 10 variants of muscle activation and the deformed crania resulting from bites of the fully optimised M1, M2 and M3 loadcases as well as the unloaded cranium to facilitate assessment of the effects of altered muscle activation in relation to the effects of varying bite point. PC1 accounts for 90% of the total variance and PC2 explains 5%. Subsequent PCs represent a small and diminishing proportion of total variance.
The resulting plot of PC1 vs. PC2 is presented in Fig. 5a. As in Fig. 3 the points representing fully optimised bites are ordered along PC1 according to their position in the dental row. The 10 variants of muscle activation for M2 bite are scattered in the vicinity of the points representing fully optimised M2 and M1 bites, forming an ellipse whose major axis is approximately as long as the distance between M1 and M3 and, in this projection, at approximately 45 degrees to the vector connecting these bites. The points representing the deformed crania due to varying muscle activation patterns are approximately ordered along this axis according to activation of masseter (combined deep and superficial), with that with greatest masseter activation (loadcase 10) being most distant from the curve connecting the molar bites. The transformation grids superimposed over the warped surface (warp magnified × 500 to facilitate visualisation) representing form variation along this axis indicate that a major aspect of the variation in deformation among different muscle activations comprises the extent of downward deflection of the zygomatic arch. Loadcases 7 and 8 fall out of sequence and, compared with the other loadcases, they simulate greater medial pterygoid muscle activation; 25.05 N (loadcase 8) and 31.70 N (loadcase 7) than occurs in the rest (between 14.98 N and 20.45 N).
Fig. 5.
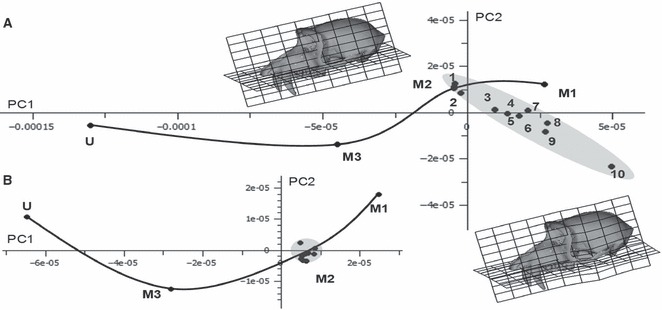
(a) PCA of 70 Procrustes registered coordinates representing overall cranial deformation during 10 different loadcases on the M2. Loadcase numbers correspond to those in Fig. 4. Different muscle activation patterns (each producing 100 N) are applied during each loadcase. PC1 (90% of total variance) vs. PC2 (5%). The undeformed (U) cranium and those due to M1 and M3 bites are also included to provide comparison. The reference (upper left) for the transformation grids and surface warps is the M2 loadcase, with the target (lower right, deformation × 500) being loadcase 10. (b) PCA, plot of PC1 (87%) vs. PC2 (10%) of a subset of 54 landmarks omitting those from the zygomatic arch. Loadcases not labelled, the outlier above the curve is loadcase 10.
Figure 5b presents a similar analysis excluding zygomatic landmarks. PC1 explains 87.53% of the variance and PC2 9.51%. The variation among the 10 experimental loadcases is much reduced, and they all lie close to the fully optimised loadcase when compared with differences in deformation due to bite point.
Muscle groups deactivated
A similar but more dramatic experiment involved the deactivation of each of the six muscles or muscle groups on both working and balancing sides before MDA optimisation of muscle action. The resulting relative activations are shown in Fig. 6 together with the resulting maps of von Mises strain. In general, masseter and, to a lesser extent, medial pterygoid compensate for temporalis inactivity and vice versa. The result is that the strain maps, while all bearing similarity to that from the fully optimised model, show considerable variability, particularly with regard to zygomatic arch and zygoma strain, associated with variations in masseteric activation.
Fig. 6.
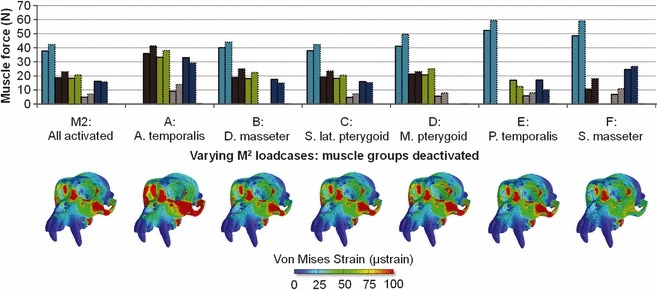
Muscle forces predicted via MDA for M2 bite, while 100 N of biting force is produced at the M2 with the following muscles deactivated: A, ant. temporalis; B, deep masseter; C, sup. lat. pterygoid; D, medial pterygoid; E, post. temporalis; F, sup. masseter. Bottom: resulting von Mises strain maps.
These results are reflected in the PCA of Fig. 7a (PC1 86% total variance vs. PC2 8% total variance). The scatter of experimental loadcases is very long; spanning a greater distance in this plot than is evident between the fully optimised molar loadcases, and it is again at approximately 45 degrees to the vector connecting M1 and M3. The extremes of this distribution are represented by loadcase F in which superficial masseter is deactivated, and loadcase A with anterior temporalis deactivated. Visualisations of the warped surface with transformation grids computed between F and A (insets; × 500 magnification) indicate that with anterior temporalis deactivated (A) there is considerable inferior deflection of the zygomatic arch when compared with loadcase F. The remaining loadcases with deactivated muscles or part muscles lie between A and F.
Fig. 7.

(a) PCA of 70 landmarks representing overall cranial deformation when various muscle groups are deactivated. PC1 (86% of total variance) vs. PC2 (8%). Loadcases and labels as in Fig. 6. The undeformed (U) cranium and those due to M1 and M3 bites are also included to provide comparison. Note that loadcase C is overlain by the full M2. The reference (upper left inset) for the transformation grids and surface warps is loadcase F (deactivated superficial masseter), with the target (lower right inset, deformation × 500) being loadcase A (deactivated anterior temporalis). (b) PCA from the same FEA analyses, but of a subset of 54 landmarks, excluding the zygomatic arch. Labelling as above. PC1 accounts for 79% of total variance and PC2 for 10%. (c) PC1 (79% total variance) vs. PC3 (8%) from the same analysis excluding zygomatic arch landmarks. The reference (lower right inset) for the transformation grids and surface warps is loadcase A (deactivated anterior temporalis), with the target (lower right inset, deformation × 2000) being loadcase F (deactivated superficial masseter).
Thus, as in the study of loadcases 1–10 (Fig. 5a), the variation among loadcases A–F is dominated by inferior bending of the zygomatic arch. Similarly to Fig. 5b, when zygomatic arch landmarks are omitted (Fig. 7b), the degree of variation apparent among deformed crania due to these loadcases diminishes markedly; they all lie close to the fully optimised M2 loadcase in the new PC plot (PC1 79% total variance vs. PC2 10% total variance). However, PC3 remains informative (8% variance), and a plot of this against PC1 (Fig. 7c) shows that the scatter of these loadcases is quite large relative to the distances between fully optimised molar loadcases. Visualisation of the differences between loadcases A (reference) and F (target) using a warped surface and transformation grids (× 2000, four times greater magnification of warping than in Fig. 7c) indicates that these principally relate to a relative vertical compression of the vault and deformation of the periorbital region in loadcase F, due to the increased action of temporalis.
Discussion
In using FEA to assess the response of a cranium to biting loads, numerous decisions have to be made in the process of model building and loading regarding, among other things, model geometry, material properties and boundary conditions, including muscle activation patterns and loads. These all impact on the ways in which the cranium deforms, and the last of these, varying muscle loadings, is the subject of this study. In order to make reliable statements based on FEA it is important that the errors introduced by modelling decisions are small in relation to the effects that are being assessed. Here we have assessed errors due to muscle loadings in relation to the effects of varying bite point in a single model of an adult M. fascicularis.
As different points along the dental row are simulated, using MDA-optimised muscle activations, the ways in which the cranium deforms vary. In this analysis more mesial bites (incisors) required considerably greater muscle force in order to achieve the same 100 N bite than was the case at the molars. This contributed, together with skull geometry, which in this study was invariant, to greater deformation of the cranium with mesial bites than with distal as assessed by both the strain maps of Fig. 2 and the PCA of Fig. 3. These visualisations indicate that besides magnitude, the deformations differ in nature between bites, with more mesial bites causing greater superior bending of the maxilla with respect to the orbits and braincase while torsion is more characteristic of distal bite points, particularly in the premolar region. General patterns of strain during all bites (incisor to molar) are consistent with previous work conducted on macaques, in which strain in the supraorbital region is recorded as being lower than that seen in the lateral orbital wall, which itself is lower than that recorded from the zygomatic arch (Hylander et al. 1991; Hylander & Johnson, 1992, 1997; Ross & Hylander, 1996; Ravosa et al. 2000a,b). Levels of strain in the interorbital region are also highest during mesial bites, reflecting the suggestions of others (Ross, 2001) that bending moments in this region will be greatest during incision as a consequence of a longer bite force moment arm. In the PCA of Fig. 3 the trend in deformation with bite point is described by a smooth curve with the first PC approximating the degree of dorso-ventral bending and the second, twisting or torsion. For the more mesial teeth this trend generally fits well within the simple beam mechanics theory of maxillary function (Greaves, 1985; Ross, 2001; Rafferty et al. 2003; Metzger et al. 2005), which suggests that dorso-ventral bending predominates during anterior bites and torsion predominates during posterior bites. Increased levels of torsion were observed in the premolar region compared with the molar, with the highest levels observed during P2 bites. In Mac17 the P1, P2 and M1 teeth are located anterior to the anterior-most attachment of the muscles, whereas the M2 and M3 are located posterior to the muscles. This may help explain the reduction in torsion observed during these more posterior bites, with the muscle possibly contributing to the counteraction of torque in the craniofacial region superior to these bites (Ross, 2008). The reduction in torsion observed during the molar bites compared with the premolar may also be a consequence of the geometry and increased cross-sectional area of the region immediately above the molar tooth row, whereas the premolars are anterior to this region and located at the part of the rostrum that is more (hemi) cylindrical (Ross, 2001). The P2 teeth are also the most laterally located teeth in the dental row, which may further explain the higher degree of torsion during bites on this tooth.
We utilise this reference analysis to assess ‘error’ when using different muscle forces in the FEA to produce the same 100 N bite at M2. Two experiments were carried out, one using all modelled muscles but with varying activations, and the second where MDA-optimised forces applied in FEA were computed with different muscles or muscle parts missing. In the former, differences in muscle loads were smaller than in the second. The resulting strain maps (Figs 4 and 6) all bear a general similarity to that arising from the fully MDA-optimised loading scenario (Fig. 2; M2), but there are key differences. The strain maps show a similar degree but different pattern of variation to that encountered along the molar row in the reference analysis of bite points. PCAs (Figs 5a and 7a) clarify the modes of variation in deformation due to varying loadings, and indicate that while variations due to ‘errors’ in loading are large with respect to the effect of bite point these are different in character from those due to bite point. Thus, the angle between among-bite-point and among-’error’ vectors in Figs 5a and 7a is approximately 45 degrees. The strain maps of Figs 4 and 6 and the visualisations from the PCAs (Figs 5a and 7a) both indicate that the principal effect of varying muscle activations is on the zygomatic arch. This region varies in the extent to which it is deflected inferiorly according to the activity of, especially the superficial portion of masseter.
Further PCAs excluding zygomatic landmarks (Figs 5b, 7b) indicate that when this effect is ignored, the variations in deformation due to variations in muscle activation are small with respect to the differences among bite points. Indeed, when zygomatic landmarks are excluded all of the variants of muscle activation used in this study, which include loadcases where muscles or muscle parts have been eliminated entirely, do not produce ‘errors’ that could lead to mis-assignment of the deformation due to M2 bite as M1 or M3 bites on plots of PC1 vs. PC2 (Figs 5b, 7b). However, when zygomatic arch landmarks are omitted in the second assessment of ‘error’ (Fig. 7b, c), excluding muscles in part or completely, there is marked residual variation visible particularly on PC3 (Fig. 7b). This is because eliminating zygomatic arch landmarks in the PCA does not completely exclude the effects of superficial masseter in deforming the cranium; as superficial masseter contracts its main impact is on the zygomatic arch, but the malar region and lateral orbital rim are also deformed.
Conversely, when superficial masseter is absent, temporalis and especially anterior temporalis compensates with greatly increased activation, the resulting force vertically compresses the vault. In consequence, omitting superficial masseter or anterior temporalis introduces deformations of the cranium which, even excluding the effect on the zygomatic arch, are of similar magnitude, but quite different in nature, to the differences in deformation due to M2 vs. M3 bite points. While the effects of altered anterior temporalis activation are small when compared with those due to variations in superficial masseter activation, they are likely significant if the mechanical response of the vault to masticatory loads is of interest.
Omission of key masticatory muscles is an unlikely source of error in FEA simulations of biting; however, these analysis do point to the zygomatic arch as being particularly sensitive to ‘errors’ in muscle loads, with masseter loading being responsible for a large proportion of the variation in strains observed during M2 bites with varied loadings. In practical terms this means that cranial FEAs simulating biting are most likely to fail to match reality in the zygomatic arch and zygoma. This region is known to possess a steep strain gradient (Hylander & Johnson, 1997). Interestingly, in relation to this, a recent study (Curtis et al. 2011) has suggested that the temporalis fasciae might play a key role in mitigating the effects of superficial masseter on the zygomatic arch by exerting a superiorly directed force on the arch as temporalis contraction tenses them. This would have the benefit of not only considerably reducing the localised impact on the zygomatic region of errors in masticatory loading, but also lead to a considerable reduction of the very large strains, and steep strain gradient commonly found in FEA simulations of this structure. These have hitherto required zygomatic arch form and function to be explained in relation to varying strain sensitivities throughout the skull (Ross & Hylander, 1996). Further in vivo work is needed to test this hypothesised temporal fascial mechanism, but it is possible that future studies should include tensed temporalis fascia in FEA models.
The sensitivity of the above FE results to masseter muscle loadings highlights concerns over comparative studies that focus on the zygomatic region when comparable muscle data are completely lacking. However, our findings indicate (ignoring the zygomatic arch) that when bite force is held constant, this macaque cranial FEA model is relatively insensitive to reasonable variants of muscle loading during an M2 bite when compared with the effects of varying bite point. Consequently, in the absence of in vivo data for the individual being studied, and for those asking broad questions regarding cranial deformation, a common (reasonable) pattern of relative activation (in this case predicted via MDA), which is scaled to create equal bite force magnitudes, could be used without much detriment to FEA results. This is important because it suggests, in studies of fossils and of living rare or large animals where dissection and EMG measurement of muscles is not feasible, we can still make reasonable FEA predictions of cranial deformation. It must be highlighted, however, that solution by MDA in the present study ensured that all variants in muscle loadings not only produced the required bite force, but also minimal reaction forces at the TMJ. This will not be the case where randomly estimated muscle loads are applied.
Finally, it should be noted that our results apply specifically to the cranium with simple compressive bite forces, and that similar studies are required for other skeletal elements, such as the mandible. Furthermore, sensitivity analyses of muscle activity were conducted only during an M2 bite. It is therefore possible that during other bites, particularly the more mesial incisor bites, cranial deformation is more sensitive to muscle activation patterns. An extension of this sensitivity study to different biting points would be informative. Nonetheless, this study contributes important new data to our understanding of the sensitivity of cranial FEAs in terms of the mechanical response of the cranium to different loadcases. It suggests that, if controlled for, errors in muscle activation patterns may have minimal impact on FE interpretation, opening up the opportunity for future comparative functional analyses, including extinct taxa, where muscle data are limited or absent.
Acknowledgments
We would like to thank Dr Jasmina Ludoski, University of Novi Sad Serbia, who contributed the sensitivity analysis of the impact of landmark choice on subsequent GMM analyses. We are also grateful to Roger Philips and Jia Lui for their part in the development of VOX-FE and the EVAN toolbox project development team, in particular Helgi Petur Gunnarsson for technical assistance. We are also grateful to Sam Cobb for helpful comments and discussions regarding the project and manuscript, and Neil Curtis for his help and advice regarding the MDA modelling and results. The work is or has been supported by research grants from The Leverhulme Trust (F/00224), BBSRC (BB/E013805; BB/E009204) and by EVAN (MRTN CT-2005-019564).
Author contributions
L.C.F. lead author, contributed substantially to the study design, analytic tools and methodologies, model building, acquisition of data, analysis and interpretation of results and drafting. J.F.S. contributed to model building, the acquisition of data and drafting. M.J.F. contributed to study design, the analysis and interpretation of results and drafting. P.O.H. contributed to study design, analytic tools and methodologies, the analysis and interpretation of results and drafting.
References
- Agrawal KR, Lucas PW, Bruce IC, et al. Food properties that influence neuromuscular activity during human mastication. J Dent Res. 1998;77:1931–1938. doi: 10.1177/00220345980770111101. [DOI] [PubMed] [Google Scholar]
- Anapol F, Barry K. Fiber architecture of the extensors of the hindlimb in semiterrestrial and arboreal guenons. Am J Phys Anthropol. 1996;99:429–447. doi: 10.1002/(SICI)1096-8644(199603)99:3<429::AID-AJPA5>3.0.CO;2-R. [DOI] [PubMed] [Google Scholar]
- Antón SC. Macaque pterygoid muscles: Internal architecture, fiber length, and cross-sectional area. Int J Primatology. 2000;21:131–156. [Google Scholar]
- Blanksma NG, van Eijden TM. Electromyographic heterogeneity in the human temporalis and masseter muscles during static biting, open/close excursions, and chewing. J Dent Res. 1995;74:1318–1327. doi: 10.1177/00220345950740061201. [DOI] [PubMed] [Google Scholar]
- Bookstein FL. Morphometric Tools for Landmark Data: Geometry and Biology. Cambridge: Cambridge University Press; 1991. [Google Scholar]
- Chalk J, Richmond BG, Ross CF, et al. A finite element analysis of masticatory stress hypotheses. Am J Phys Anthropol. 2011;145:1–10. doi: 10.1002/ajpa.21416. [DOI] [PubMed] [Google Scholar]
- Cobb SN, Panagiotopoulou O. Balancing the spatial demands of the developing dentition with the mechanical demands of the catarrhine mandibular symphysis. J Anat. 2011;218:96–111. doi: 10.1111/j.1469-7580.2010.01321.x. [DOI] [PMC free article] [PubMed] [Google Scholar] [Retracted]
- Curtis N, Kupczik K, O’Higgins P, et al. Predicting skull loading: applying multibody dynamics analysis to a macaque skull. Anat Rec. 2008;291:491–501. doi: 10.1002/ar.20689. [DOI] [PubMed] [Google Scholar]
- Curtis N, Jones M, Evans SE, et al. Predicting muscle activation patterns from motion and anatomy: modelling the skull of Sphenodon (Diapsida: rhynchocephalia) J R Soc Interface. 2010;7:153–160. doi: 10.1098/rsif.2009.0139. [DOI] [PMC free article] [PubMed] [Google Scholar]
- Curtis N, Witzel U, Fitton L, et al. The mechanical significance of the temporal fasciae in Macaca fascicularis: an investigation using finite element analysis. Anat Rec. 2011;294:1178–1190. doi: 10.1002/ar.21415. [DOI] [PubMed] [Google Scholar]
- Doty RW, Bosma JF. An electromyographic analysis of reflex deglutition. J Neurophysiol. 1956;19:44–60. doi: 10.1152/jn.1956.19.1.44. [DOI] [PubMed] [Google Scholar]
- Dryden IL, Mardia KV. Statistical Shape Analysis. London: John Wiley; 1998. [Google Scholar]
- Farella M, van Eijden T, Baccini M, et al. Task-related electromyographic spectral changes in the human masseter and temporalis muscles. Eur J Oral Sci. 2002;110:8–12. doi: 10.1034/j.1600-0722.2002.00128.x. [DOI] [PubMed] [Google Scholar]
- German RZ, Crompton AW, Thexton AJ. Variation in EMG activity: a hierarchical approach. Integr Comp Biol. 2008;48:283–293. doi: 10.1093/icb/icn022. [DOI] [PMC free article] [PubMed] [Google Scholar]
- Greaves WS. The mammalian postorbital bar as a torsion-resisting helical strut. J Zool. 1985;207:125–136. [Google Scholar]
- Gröning F, Liu J, Fagan MJ, et al. Why do humans have chins? Testing the mechanical significance of modern human symphyseal morphology with finite element analysis. Am J Phys Anthropol. 2011;144:593–606. doi: 10.1002/ajpa.21447. [DOI] [PubMed] [Google Scholar]
- Heintz S, Gutierrez-Farewik EM. Static optimization of muscle forces during gait in comparison to EMG-to-force processing approach. Gait Posture. 2007;26:279–288. doi: 10.1016/j.gaitpost.2006.09.074. [DOI] [PubMed] [Google Scholar]
- Herring SW. Muscles of mastication: architecture and functional organization. In: Davidovitch Z, editor. The Biological Mechanisms of Tooth Movement and Craniofacial Adaptation. Columbus, OH: Ohio State University; 1992. pp. 541–548. [Google Scholar]
- Herring SW, Grimm AF, Grimm BR. Functional heterogeneity in a multipinnate muscle. Am J Anat. 1979;154:563–576. doi: 10.1002/aja.1001540410. [DOI] [PubMed] [Google Scholar]
- Hiraba K, Hibino K, Hiranuma K, et al. EMG activities of two heads of the human lateral pterygoid muscle in relation to mandibular condyle movement and biting force. J Neurophysiol. 2000;83:2120–2137. doi: 10.1152/jn.2000.83.4.2120. [DOI] [PubMed] [Google Scholar]
- Hylander WL. Mandibular function in Galago crassicaudatus and Macaca fascicularis: an in vivo approach to stress analysis of the mandible. J Morphol. 1979;159:253–296. doi: 10.1002/jmor.1051590208. [DOI] [PubMed] [Google Scholar]
- Hylander WL, Johnson KR. Temporalis and masseter muscle function during incision in macaques and humans. Int J Primatol. 1985;6:289–322. [Google Scholar]
- Hylander WL, Johnson KR. Strain gradients in the craniofacial region of primates. In: Davidovitch Z, editor. The Biological Mechanisms of Tooth Movement and Craniofacial Adaptation. Columbus, OH: Ohio State University; 1992. pp. 559–569. [Google Scholar]
- Hylander W, Johnson K. In vivo bone strain patterns in the zygomatic arch of macaques and the significance of these patterns for functional interpretations of craniofacial form. Am J Phys Anthropol. 1997;102:203–232. doi: 10.1002/(SICI)1096-8644(199702)102:2<203::AID-AJPA5>3.0.CO;2-Z. [DOI] [PubMed] [Google Scholar]
- Hylander WL, Picq PG, Johnson K. Masticatory-stress hypotheses and the supraorbital region of primates. Am J Phys Anthropol. 1991;86:1–36. doi: 10.1002/ajpa.1330860102. [DOI] [PubMed] [Google Scholar]
- Hylander WL, Ravosa MJ, Ross CF, et al. Symphyseal fusion and jaw-adductor muscle force: an EMG study. Am J Phys Anthropol. 2000;112:469–492. doi: 10.1002/1096-8644(200008)112:4<469::AID-AJPA5>3.0.CO;2-V. [DOI] [PubMed] [Google Scholar]
- Hylander WL, Wall CE, Vinyard CJ, et al. Temporalis function in anthropoids and strepsirrhines: an EMG study. Am J Phys Anthropol. 2005;128:35–56. doi: 10.1002/ajpa.20058. [DOI] [PubMed] [Google Scholar]
- Koolstra JH. Dynamics of the human masticatory system. Crit Rev Oral Biol Med. 2002;13:366–376. doi: 10.1177/154411130201300406. [DOI] [PubMed] [Google Scholar]
- Koolstra JH, van Eijden TMGJ. Dynamics of the human masticatory muscles during a jaw open-close movement. J Biomech. 1997;30:883–889. doi: 10.1016/s0021-9290(97)00047-x. [DOI] [PubMed] [Google Scholar]
- Koolstra JH, van Eijden TMGJ. Three-dimensional dynamical capabilities of the human masticatory muscles. J Biomech. 1999;32:145–152. doi: 10.1016/s0021-9290(98)00160-2. [DOI] [PubMed] [Google Scholar]
- Koolstra JH, van Eijden TMGJ. A method to predict muscle control in the kinematically and mechanically indeterminate human masticatory system. J Biomech. 2001;34:1179–1188. doi: 10.1016/s0021-9290(01)00053-7. [DOI] [PubMed] [Google Scholar]
- Koolstra JM, van Eijden TMGJ. Combined finite-element and rigid-body analysis of human jaw joint dynamics. J Biomech. 2005;38:2431–2439. doi: 10.1016/j.jbiomech.2004.10.014. [DOI] [PubMed] [Google Scholar]
- Kupczik K, Dobson CA, Fagan MJ, et al. Assessing mechanical function of the zygomatic region in macaques: validation and sensitivity testing of finite element models. J Anat. 2007;210:41–53. doi: 10.1111/j.1469-7580.2006.00662.x. [DOI] [PMC free article] [PubMed] [Google Scholar]
- Langenbach GEJ, Hannam AG. The role of passive muscle tensions in a three-dimensional dynamic model of the human jaw. Arch Oral Biol. 1999;44:557–573. doi: 10.1016/s0003-9969(99)00034-5. [DOI] [PubMed] [Google Scholar]
- Langenbach GEJ, Zhang F, Herring SW, et al. Modelling the masticatory biomechanics of a pig. J Anat. 2002;201:383–393. doi: 10.1046/j.0021-8782.2002.00108.x. [DOI] [PMC free article] [PubMed] [Google Scholar]
- Langenbach GEJ, Zhang F, Herring SW, et al. Dynamic mechanics in the pig mandibular symphysis. J Anat. 2006;209:69–78. doi: 10.1111/j.1469-7580.2006.00584.x. [DOI] [PMC free article] [PubMed] [Google Scholar]
- Lindauer S, Gay T, Rendall J. The effect of jaw opening on masticatory muscle EMG-force characteristics. J Dent Res. 1993;71:51–55. doi: 10.1177/00220345930720010701. [DOI] [PubMed] [Google Scholar]
- Liu J, Shi L, Fitton LC, et al. The application of muscle wrapping to voxel-based finite element models of skeletal structures. Biomech Model Mechanobiol. 2012;11:35–47. doi: 10.1007/s10237-011-0291-5. [DOI] [PubMed] [Google Scholar]
- Manns A, Miralles R, Palazzi C. EMG, bite force, and elongation of the masseter muscle under isometric voluntary contractions and variations of vertical dimension. J Prosthet Dent. 1979;42:674–682. doi: 10.1016/0022-3913(79)90200-2. [DOI] [PubMed] [Google Scholar]
- Mao J, Osborn JW. Direction of a bite force determines the pattern of activity in jaw-closing muscles. J Dent Res. 1994;73:1112–1120. doi: 10.1177/00220345940730051401. [DOI] [PubMed] [Google Scholar]
- Maynard Smith J, Savage RJG. The mechanics of mammalian jaws. School Sci Rev. 1959;141:289–301. [Google Scholar]
- Metzger KA, William DJT, Ross CF. Comparison of beam theory and finite-element analysis with in vivo bone strain data from the alligator cranium. Anat Rec A Discov Mol Cell Evol Biol. 2005;283:331–348. doi: 10.1002/ar.a.20167. [DOI] [PubMed] [Google Scholar]
- Moazen M, Curtis N, Evans SE, et al. Rigid body analysis of the lizard skull: modelling the skull of Uromastyx hardwickii. J Biomech. 2008a;41:1274–1280. doi: 10.1016/j.jbiomech.2008.01.012. [DOI] [PubMed] [Google Scholar]
- Moazen M, Curtis N, Evans SE, et al. Combined finite element and multibody dynamics analysis of biting in a Uromastyx hardwickii lizard skull. J Anat. 2008b;213:499–508. doi: 10.1111/j.1469-7580.2008.00980.x. [DOI] [PMC free article] [PubMed] [Google Scholar]
- O’Higgins P. Methodological issues in the description of forms. In: Lestrel PE, editor. Fourier Descriptors and their Applications in Biology. Cambridge: Cambridge University Press; 1997. pp. 74–105. [Google Scholar]
- O’Higgins P, Cobb SN, Fitton LC, et al. Combining geometric morphometrics and functional simulation: an emerging toolkit for virtual functional analyses. J Anat. 2011;218:3–15. doi: 10.1111/j.1469-7580.2010.01301.x. [DOI] [PMC free article] [PubMed] [Google Scholar]
- Olmsted MJ, Wall CE, Vinyard CJ, et al. Human bite force: the relation between EMG activity and bite force at a standardized gape. Am J Phys Anthropol Suppl. 2005;40:160–161. [Google Scholar]
- Osborn JW. Biomechanical implications of lateral pterygoid contribution to biting and jaw opening in humans. Arch Oral Biol. 1995;40:1099–1108. doi: 10.1016/0003-9969(95)00088-7. [DOI] [PubMed] [Google Scholar]
- Osborn JW, Baragar FA. Predicted pattern of human muscle activity during clenching derived from a computer assisted model: symmetric vertical bite forces. J Biomech. 1985;18:599–612. doi: 10.1016/0021-9290(85)90014-4. [DOI] [PubMed] [Google Scholar]
- Panagiotopoulou O, Curtis N, O’Higgins P, et al. Modelling subcortical bone in finite element analyses: a validation and sensitivity study in the macaque mandible. J Biomech. 2010;43:1063–1611. doi: 10.1016/j.jbiomech.2009.12.027. [DOI] [PubMed] [Google Scholar]
- Paphangkorakit J, Osborn J. Effect of jaw opening on the direction and magnitude of human incisal bite forces. J Dent Res. 1997;76:561–567. doi: 10.1177/00220345970760010601. [DOI] [PubMed] [Google Scholar]
- Peyron MA, Lassauzay C, Woda A. Effects of increased hardness on jaw movement and muscle activity during chewing of visco-elastic model foods. Exp Brain Res. 2002;142:41–51. doi: 10.1007/s00221-001-0916-5. [DOI] [PubMed] [Google Scholar]
- Pruim GJ, Ten Bosch JJ, de Jongh HJ. Jaw muscle EMG-activity and static loading of the mandible. J Biomech. 1978;11:389–395. doi: 10.1016/0021-9290(78)90073-8. [DOI] [PubMed] [Google Scholar]
- Rafferty KL, Herring SW, Marshall CD. Biomechanics of the rostrum and the role of facial sutures. J Morphol. 2003;257:33–44. doi: 10.1002/jmor.10104. [DOI] [PMC free article] [PubMed] [Google Scholar]
- Rasmussen J, Voigt M. Muscle recruitment by the min/max criterion – a comparative numerical study. J Biomech. 2001;34:409–415. doi: 10.1016/s0021-9290(00)00191-3. [DOI] [PubMed] [Google Scholar]
- Ravosa MJ, Johnson KR, Hylander WL. Strain in the galago facial skull. J Morphol. 2000a;245:51–66. doi: 10.1002/1097-4687(200007)245:1<51::AID-JMOR4>3.0.CO;2-7. [DOI] [PubMed] [Google Scholar]
- Ravosa MJ, Noble VE, Hylander WL, et al. Masticatory stress, orbital orientation and the evolution of the primate postorbital bar. J Hum Evol. 2000b;38:667–693. doi: 10.1006/jhev.1999.0380. [DOI] [PubMed] [Google Scholar]
- Rohlf FJ. On the use of shape spaces to compare morphometric methods. Hystrix. 2000;11:9–25. [Google Scholar]
- Ross CF. In vivo function of the craniofacial haft: the interorbital “pillar”. Am J Phys Anthropol. 2001;116:108–139. doi: 10.1002/ajpa.1106. [DOI] [PubMed] [Google Scholar]
- Ross CF. Does the primate face torque? In: Vinyard CJ, Ravosa MJ, Wall CE, editors. Primate Craniofacial Function and Biology. New York: Springer; 2008. pp. 63–81. [Google Scholar]
- Ross CF, Hylander WL. In vivo and in vitro bone strain in the owl monkey circumorbital region and the function of the postorbital septum. Am J Phys Anthropol. 1996;101:183–215. doi: 10.1002/(SICI)1096-8644(199610)101:2<183::AID-AJPA6>3.0.CO;2-3. [DOI] [PubMed] [Google Scholar]
- Ross CF, Hylander WL. Electromyography of the anterior temporalis and masseter muscles of owl monkeys (Aotustrivirgatus) and the function of the postorbital septum. Am J Phys Anthropol. 2000;112:455–468. doi: 10.1002/1096-8644(200008)112:4<455::AID-AJPA4>3.0.CO;2-4. [DOI] [PubMed] [Google Scholar]
- Ross CF, Patel BA, Slice DE, et al. Modeling masticatory muscle force in finite-element analysis: sensitivity analysis using principal coordinates analysis. Anat Rec A. 2005;283:288–299. doi: 10.1002/ar.a.20170. [DOI] [PubMed] [Google Scholar]
- Ross CF, Berthaume MA, Dechow PC, et al. In vivo bone strain and finite-element modeling of the craniofacial haft in catarrhine primates. J Anat. 2011;218:112–141. doi: 10.1111/j.1469-7580.2010.01322.x. [DOI] [PMC free article] [PubMed] [Google Scholar]
- Sellers WI, Crompton RH. Using sensitivity analysis to validate the predictions of a biomechanical model of bite forces. Ann Anat. 2004;186:89–95. doi: 10.1016/S0940-9602(04)80132-8. [DOI] [PubMed] [Google Scholar]
- Shaffer HB, Lauder GV. Aquatic prey capture in ambystomatid salamanders: patterns of variation in muscle activity. J Morphol. 1985;183:273–284. doi: 10.1002/jmor.1051830304. [DOI] [PubMed] [Google Scholar]
- Slice DE. Modern Morphometrics in Physical Anthropology. New York: Kluwer Academic; 2005. [Google Scholar]
- Slice DE. Geometric morphometrics. Annu Rev Anthropol. 2007;36:261–281. [Google Scholar]
- Spencer MA. Force production in the primate masticatory system: electromyographic tests of biomechanical hypotheses. J Hum Evol. 1998;34:25–54. doi: 10.1006/jhev.1997.0180. [DOI] [PubMed] [Google Scholar]
- Spoor CF, Zonneveld FW, Macho GA. Linear measurements of cortical bone and dental enamel by computed tomography: applications and problems. Am J Phys Anthrop. 1993;91:469–484. doi: 10.1002/ajpa.1330910405. [DOI] [PubMed] [Google Scholar]
- Strait DS, Richmond BG, Spencer MA, et al. Masticatory biomechanics and its relevance to early hominid phylogeny: an examination of palatal thickness using finite-element analysis. J Hum Evol. 2007;52:585–599. doi: 10.1016/j.jhevol.2006.11.019. [DOI] [PubMed] [Google Scholar]
- Strait DS, Weber GW, Neubauer S, et al. The feeding biomechanics and dietary ecology of Australopithecus africanus. Proc Natl Acad Sci USA. 2009;106:2124–2129. doi: 10.1073/pnas.0808730106. [DOI] [PMC free article] [PubMed] [Google Scholar]
- van Eijden TM. Jaw muscle activity in relation to the direction and point of application of bite force. J Dent Res. 1990;69:901–905. doi: 10.1177/00220345900690031401. [DOI] [PubMed] [Google Scholar]
- van Eijden TMGJ, Turkawski SJJ. Morphology and physiology of masticatory muscle units. Crit Rev Oral Biol Med. 2001;12:76–91. doi: 10.1177/10454411010120010601. [DOI] [PubMed] [Google Scholar]
- van Eijden TM, Blanksma NG, Brugman P. Amplitude and timing of EMG activity in the human masseter muscle during selected motor tasks. J Dent Res. 1993;72:599–606. doi: 10.1177/00220345930720030801. [DOI] [PubMed] [Google Scholar]
- van Eijden TMGJ, Korfage JAM, Brugman P. Architecture of the human jaw-closing and jaw-opening muscles. Anat Rec. 1997;248:464–474. doi: 10.1002/(sici)1097-0185(199707)248:3<464::aid-ar20>3.3.co;2-4. [DOI] [PubMed] [Google Scholar]
- van Ruijven LJ, Weijs WA. A new model for calculating muscle forces from electromyograms. Eur J Appl Physiol Occup Physiol. 1990;61:479–485. doi: 10.1007/BF00236071. [DOI] [PubMed] [Google Scholar]
- Vinyard CJ, Taylor AB. A preliminary analysis of the relationship between jaw-muscle architecture and jaw-muscle electromyography during chewing across primates. Anat Rec. 2010;293:572–582. doi: 10.1002/ar.21121. [DOI] [PMC free article] [PubMed] [Google Scholar]
- Vinyard CJ, Williams SH, Wall CE, et al. Jaw-muscle electromyography during chewing in Belanger’s treeshrews (Tupaiabelangeri. Am J Phys Anthropol. 2005;127:26–45. doi: 10.1002/ajpa.20176. [DOI] [PubMed] [Google Scholar]
- Vinyard CJ, Wall CE, Williams SH, et al. Masseter electromyography during chewing in ring-tailed lemurs (Lemur catta. Am J Phys Anthropol. 2006;130:85–95. doi: 10.1002/ajpa.20307. [DOI] [PubMed] [Google Scholar]
- Vinyard CJ, Wall CE, Williams SH, et al. Patterns of variation across primates in jaw-muscle electromyography during mastication. Integr Comp Biol. 2008;48:294–311. doi: 10.1093/icb/icn071. [DOI] [PubMed] [Google Scholar]
- Wall CE, Vinyard CJ, Johnson KR, et al. Phase II jaw movements and masseter muscle activity during chewing in Papio anubis. Am J Phys Anthropol. 2006;129:215–224. doi: 10.1002/ajpa.20290. [DOI] [PubMed] [Google Scholar]
- Wang Q, Smith AL, Strait DS, et al. The global impact of sutures assessed in a finite element model of a macaque cranium. Anat Rec. 2010;293:1477–1491. doi: 10.1002/ar.21203. [DOI] [PubMed] [Google Scholar]
- Weijs WA, Hillen B. Cross-sectional areas and estimated intrinsic strength of the human jaw muscles. Acta Morphol Neerl Scand. 1985;23:267–274. [PubMed] [Google Scholar]
- Westneat MW. A biomechanical model for analysis of muscle force, power output and lower jaw motion in fishes. J Theor Biol. 2003;223:269–281. doi: 10.1016/s0022-5193(03)00058-4. [DOI] [PubMed] [Google Scholar]
- Wroe S, Moreno K, Clausen P, et al. High-resolution three-dimensional computer simulation of hominid cranial mechanics. Anat Rec Adv Integr Anat Evol Biol. 2007;290:1248–1255. doi: 10.1002/ar.20594. [DOI] [PubMed] [Google Scholar]