

Background: PML is highly expressed in endothelial cells (ECs), but its role in ECs remains largely unexplored.
Results: PML is critical for TNFα- and IFNα-mediated inhibition of EC network formation and migration.
Conclusion: PML is an angiogenesis inhibitor following inflammation-associated cytokine signaling.
Significance: PML is a novel regulator of endothelial cell physiology.
Keywords: Cell Migration, Endothelial Cell, Transcription Regulation, Tumor Necrosis Factor (TNF), Vascular Biology, PML
Abstract
Promyelocytic leukemia protein (PML) is a tumor suppressor that is highly expressed in vascular endothelium and inflamed tissues, yet its role in inflammation-associated cytokine-regulated angiogenesis and underlying mechanism remains largely unclear. We show that tumor necrosis factor α (TNFα) and interferon α (IFNα) stimulate PML expression while suppressing EC network formation and migration, two key events during angiogenesis. By a knockdown approach, we demonstrate that PML is indispensable for TNFα- and IFNα-mediated inhibition of EC network formation. We further demonstrate that signal transducer and activator of transcription 1 (STAT1) binds PML promoter and that is an important regulator of PML expression. Knockdown of STAT1 reduces endogenous PML and blocks TNFα- and IFNα-induced PML accumulation and relieves TNFα- and IFNα-mediated inhibition of EC network formation. Our data also indicate that PML regulates EC migration, in part, by modulating expression of downstream genes, such as negatively regulating integrin β1 (ITGB1). In addition, knockdown of STAT1 or PML alleviates TNFα- and IFNα-mediated inhibition of ITGB1 expression. Antibody blockade demonstrates that ITGB1 is functionally important for PML- and STAT1-regulated EC migration. Taken together, our data provide novel mechanistic insights that PML functions as a negative regulator in EC network formation and migration.
Introduction
The promyelocytic leukemia protein (PML),2 initially identified as a fusion partner of retinoic acid receptor α (RARα) involved in acute promyelocytic leukemia (APL), regulates several cellular processes including proliferation, apoptosis, transcription, virus infection, and DNA damage signaling in response to extracellular stimuli (1–7). PML is the core scaffold component of a proteinaceous nuclear structure called PML nuclear bodies (NBs) (8). The precise function of PML NBs is not clear, but they are believed nuclear depots that sequester other factors to control cellular processes such as transcription (9, 10). While it is known that PML is highly expressed in vascular endothelium and inflamed tissues (8), its role in endothelial cells (ECs) is largely unknown.
The inflammation-associated cytokines tumor necrosis factor α (TNFα) and interferons (IFNs) exert their cellular effects through signaling cascades that involve extracellular receptors, and intracellular mediators (11–13). TNFα is released by activated macrophage at sites of inflammation and binds to TNFα receptors on the local vascular endothelium triggering multiple responses in these cells, including up-regulation of leukocyte adhesion molecules and increased endothelial permeability. TNFα possesses pro-apoptotic and anti-viral activities and is capable of inhibiting tumorigenesis; however it is also able to stimulate cell survival. As such, intracellular responses to TNFα are controversial and long-debated (13). Type I (IFNα and IFNβ) and type II (IFNγ) IFNs are induced in the innate and adaptive immune responses, respectively and are generally considered to be anti-viral and pro-apoptotic (12, 14). IFNα, released by leukocyte from inflamed tissues, activates macrophage, which in turn promotes the release of TNFα. Both TNFα and IFNα affect gene transcription in local ECs; however, the molecular networks downstream of TNFα and IFNα in ECs are still not fully elucidated.
Angiogenesis is a hallmark of tumor development and chronic inflammatory diseases (15–18). It is believed that cytokines, including TNFα, and IFNα, are important regulators of angiogenesis in local endothelium (13, 14, 17). Angiogenesis is a complex process and represents a systemic morphological alteration that involves enzymatic degradation and remodeling of the extracellular matrix, migration, apoptosis, and proliferation of ECs (16). IFNs elicit anti-angiogenic activity (14), whereas TNFα has pro- or anti-angiogenic activity probably depending on the dose, duration of treatment, and cell type (19–21). Therefore, identification of downstream effectors that mediate TNFα and IFNα activity in ECs will help understand the mechanisms by which these two cytokines regulate physiological and pathological angiogenesis.
We have recently demonstrated that TNFα potently induces PML and regulates the expression of the matrix-associated metalloproteinase MMP-10 in ECs (9). Our current study supports a model in which STAT1 and PML play a role in TNFα- and IFNα-mediated inhibition of EC network formation and migration.
EXPERIMENTAL PROCEDURES
Reagents and Antibodies
Human TNFα was purchased from Promega (G5241). Human IFNα (11200) and IFNγ (11500) were purchased from R&D systems. IKK inhibitor VII was purchased from EMD Millipore (401486). The Matrigel kit for in vitro EC network formation assays was purchased from Chemicon (ECM625). The commercial antibodies used in this manuscript are from Santa Cruz Biotechnology, α-PML (sc-996, sc-5621), α-STAT1 (sc-346), α-ITGB1 (sc-6622), α-Mouse IgG conjugated with HRP (sc-2005), α-goat IgG conjugated with HRP (sc-2033); from Upstate α-acetyl-histone H3 (α-AcH3, 06-599); from Sigma, α-β-actin (A5441), from Invitrogen, normal goat IgG (10200); Alexa Fluor 488 μm goat anti rabbit (A-11008), Alexa Fluor 594 μm goat anti mouse (A-11005); from Millipore, α-rabbit-IgG conjugated with HRP (12-348).
Cell Culture, Drug Treatment, and siRNA Transfection
Human umbilical vein endothelial cells (HUVECs, Lonza, C2519A) were maintained in endothelial cell growth medium-2 (EGM-2, Lonza, CC-4176). Human microvascular endothelial cells (HMVECs, Lonza, CC-2543) were maintained in microvascular endothelial cell growth medium-2 (EGM-2MV, Lonza, CC-4147). Cells of <5 passages were used in this study. For cytokine treatment, unless otherwise specified, conditions were TNFα (20 ng/ml), IFNα (1000 units/ml), or IFNγ (1000 units/ml) for 16 h. Non-targeting control (D-001810-01), luciferase (D-001210-02), PML (J-006547-05 and J-006547-07), and STAT1 (J-003543-06 and J-003543-08) siRNAs and transfection reagent DharmaFECT1 (T-2001) were purchased from Thermo Scientific.
Inhibition of NF-κB by IKK Inhibitor VII
HUVECs were concurrently treated with TNFα (20 ng/ml) in the presence of vehicle, 100 nm, or 200 nm IKK inhibitor VII. Cells were collected, and aliquots of the cells were subjected to whole cell extract preparation, immunofluorescence microscopy, and total RNA preparation.
Total RNA Extraction, RT-PCR, and Real-time PCR
Cells were harvested, and total RNA was extracted with a PrepEase kit (USB/Affymetrix), quantified by A260/A280 spectrometry. 2 μg of total RNAs were used for RT-PCR. The cDNA pool was generated from each RNA sample with Superscript3 Reverse Transcriptase (Invitrogen) according to the manufacturer's instructions. The specific cDNAs of interest and internal controls were quantified by real-time PCR using an iCycler (Bio-Rad) platform with 2×iQ SYBR Green Supermix (Bio-Rad) and appropriate primer sets. The PCR program ran for 40 cycles with three steps of 95 °C for 10 s, 55 °C for 20 s, and 72 °C for 30 s. Melting curves were acquired after PCR to ensure the homogeneity of the PCR products. The relative quantities of genes of interest were normalized to an internal control (GAPDH or 18s rRNA) and depicted as mean ± S.D. from three independent experiments. The primer sequences are shown in supplemental Table S1.
Western Blotting and Quantification of Band Intensity
To prepare whole cell extracts, cells were harvested and lysed in RIPA lysis buffer (1% Nonidet P-40, 0.5% sodium deoxycholate, 0.1% SDS in 1× PBS) supplemented with a protease inhibitor mixture (Roche). The extracts were fractionated by SDS-PAGE and transferred to PVDF membranes (Millipore). Membranes were blocked in 10% nonfat milk in 1× PBS supplemented with 0.1% Tween-20 (PBST) for 1 h and followed by incubation with primary antibodies in PBST for 1 h. The membranes were rinsed and washed in PBST and incubated with HRP-conjugated secondary antibodies in PBST for 1 h. The membranes were incubated with chemiluminescent substrate for HRP (Thermo Sci. 34080) and exposed on autoradiography film (Denville Sci.). For quantification of band density, films were scanned, and the integrated density of each band was quantified with the “Analyze: Gels” tools in ImageJ software (v1.42a, NIH). The densities of proteins of interest were normalized to that of an internal control, and the first lane was set as 1 to reflect the fold change in the remaining lanes.
Immunofluorescence Microscopy
HUVECs, plated on glass cover slips, were treated with or without TNFα and IFNα for 16 h, and the same protocol was followed for HUVECs transfected with siRNAs. The cells were fixed in 1% paraformaldehyde in 1× PBS for 30 min at room temperature, permeabilized in 1× PBS supplemented with 0.1% Triton X-100 and 10% goat serum for 10 min, washed three times with 1× PBS, and blocked in 1× PBS containing 10% goat serum and 0.1% Tween-20 for 1 h followed by incubation with primary antibodies for 1 h. After washing, Alexa Fluor secondary antibodies were added for 1 h in the dark. Cover slips were mounted on slides using Vectashield mounting medium with DAPI (Vector Laboratories), visualized and images captured on a Leica immunofluorescence microscopy. Unless specified, all images were taken under same microscope setting.
In Vitro EC Network Formation Assay
The assays were performed following the manufacturer's protocol (Lonza ECM625). Under our experimental conditions, we did not observe significant differences in apoptosis or viability of HUVEC transfected with or without siRNAs against PML or a control siRNA (data not shown). Briefly, HUVECs or HMVECs were transfected with control siRNA or siRNAs against PML for 72 h, and followed by a 16–20 h treatment with TNFα (10 ng/ml), IFNα (103 units/ml), or IFNγ (103 units/ml). Subsequently, the cells were trypsinized and counted. Equal numbers of HUVECs were plated on matrix gel (Chemicon ECM625) pre-coated 96-well plate (1 × 10⁵/well) or chamber system (2.5 × 10⁵/chamber, Lab-Tek 4808). A fraction of the cells was plated for Western blotting to examine PML knockdown efficiency. After seeding the cells on the ECM, the images of network formation from randomly chosen fields (plate, n = 12; chamber, n = 8) were taken at 3, 8, and 20 h. The trends of change in network formation are similar for these time points. The images taken at 20 h are presented. The numbers of branch points were quantified and depicted as mean ± S.D. For statistics used in Figs. 1, 2, 3, and 4, unpaired two-tail t-tests were applied, and the p values were presented as *, p < 0.05; **, p < 0.01; ***, p < 0.001; #, p < 0.00001; and ns (not significant, p > 0.05).
FIGURE 1.

Effects PML knockdown and TNFα on network formation in HUVECs and HMVECs. In vitro network formation in HUVECs (A–D) and HMVECs (E) following PML knockdown. HUVECs or HMVECs were transiently transfected with non-targeting or PML siRNAs for 72 h before the assays. Representative fields of HUVEC-formed networks (A, C) and branch points (B, D, and E) were quantified as described in “Experimental Procedures.” Mean ± S.D. (n = 12). An aliquot of cells was plated for Western blotting (A and E) to examine PML expression levels. Endogenous PML shows a major band around 120 kDa in ECs. C–D, dose-dependent effects of TNFα treatment on HUVEC network formation. Representative fields (C) and the quantitation, mean ± S.D. (n = 6) (D). Statistics: unpaired two-tail t-tests (**, p < 0.001; ***, p < 0.0001).
FIGURE 2.

Effects of TNFα, IFNα, and IFNγ on PML protein levels and network formation in HUVECs and HMVECs. HUVECs (A–C) and HMVECs (D–E) were pre-treated with vehicle control, TNFα (20 ng/ml), IFNα (103 units/ml), or IFNγ (103 units/ml) for 16 h followed by in vitro EC network formation assays and quantification of branch points, mean ± S.D. (n = 12). An aliquot of HUVECs (C) or HMVECs (E) was used for Western blotting analysis with α-PML and α-β-actin antibodies. Statistics: unpaired two-tail t-tests (***, p < 0.0001).
FIGURE 3.

PML is essential for TNFα-, IFNα-, and IFNγ-mediated inhibition of EC network formation. A and B, HUVECs were transiently transfected with siControl or siPML for 72 h, and treated with TNFα (20 ng/ml), IFNα (103 units/ml), or IFNγ (103 units/ml) for 16 h. The cells were subsequently trypsinized and counted. Equal numbers of cells were plated on the matrix gel for in vitro EC network formation assays. Images shown were taken 20 h after seeding the cells on the extracellular matrix gel (A). Quantitation of branch points is shown as mean ± S.D. (n = 12) (B). C, an aliquot of HUVECs from A and B was plated for Western blotting to examine PML expression. D, similar to B, in vitro EC network formation assays in HMVECs. Statistics: unpaired two-tail t-tests (***, p < 0.0001).
FIGURE 4.

STAT1 participates in the TNFα- and IFNα-induced PML expression and inhibition of EC network formation in HUVECs. A, effects of STAT1 knockdown on PML mRNA levels analyzed by qRT-PCR. B, effects of TNFα and IFNα on endogenous STAT1 and PML protein levels in HUVECs assayed by Western blotting. C, effects of STAT1 knockdown by two siRNAs on PML protein levels following TNFα and IFNα treatment assayed by Western blotting. B and C, Western blotting bands were quantified by Image J as described in “Experimental Procedures.” ND, not detectable. D, effects of STAT1 knockdown on PML NBs examined by immunofluorescence microscopy (DAPI, blue; STAT1, green; PML, red). The microscopic parameters were set identically for all images taken. E, association of STAT1 with the PML promoter following TNFα and IFNα treatment assayed by chromatin immunoprecipitation followed by quantification with qPCR. HUVECs treated with TNFα (20 ng/ml) or IFNα (103 units/ml) for 16 h followed by ChIP assays as described in “Experimental Procedures.” Putative STAT binding sites were predicted with Genomatix. TNFα and IFNα increase acetylation of histone H3 flanking STAT1 binding sites at the PML promoter. F, effects of knockdown of STAT1 on TNFα- and IFNα-mediated inhibition of EC network formation in HUVECs. Quantitation of branch points after in vitro EC network formation assays was as described in Fig. 1, mean ± S.D. (n = 8). Statistics: unpaired two-tail t-tests (**, p < 0.001; ***, p < 0.0001; ns, not significant).
Chromatin Immunoprecipitation (ChIP) Assays
This protocol was adapted with modification as previously described (22). Briefly, 1 × 10⁶ HUVECs were used for each immunoprecipitation. Crosslinked nuclei were sonicated on a sonic dismembrator (Fisher 550α) with power setting 4 of 120 s total processing time in a 10s-pulse-50s-idle manner to shear the chromatin to around 600 bp. The retrieved DNA was quantified by qPCR. Each ChIP experiment had 2–3 biological repeats. The antibodies used were listed under “Reagents and Antibodies.” The input signal was set to 1, and others were normalized as percentage of input. The primer sequences are listed in supplemental Table S1.
In Vitro Wound-healing Assay
The assay was adapted from a previous protocol with modification (23). Confluent HUVECs plated in a 6-well plate, 16–20 h after treatment of TNFα, IFNα, or IFNγ and 72 h post-transfection of siRNA if applied, were scratched with a pipette tip to create wounds. Normal IgG or blocking antibody against integrin β1 (α-ITGB1, 10 μg/ml) was supplemented in media during the assay if specified. Randomly chosen fields (n = 16) were used for imaging, and the images were taken at identical locations at time 0 and overnight. The wound widths were measured by Photoshop (Adobe) software, normalized and represented as the percentage of wound measured at time 0 (mean ± S.D.). All statistics were performed with unpaired two-tailed t test.
Transwell Migration Assay
Boyden chambers with 8 μm pore size were purchased from Corning (3422). HUVECs were transfected with control or PML siRNAs for 72 h. The cells were trypsinized, counted and 1 × 10⁵ cells/well were plated on 6.5 mm diameter inserts in the upper chamber of the apparatus. Migration was allowed to proceed overnight. For migration toward serum (10% FBS), the cells were starved in medium containing 1% FBS for 24 h and migrated toward medium supplemented 10% FBS placed in the lower chamber. For migration toward extracellular matrix (ECM), the bottom of the inserts was coated with ECM (Chemicon, ECM625), and both upper and lower chambers contained normal culture medium. After migration, the cells that had migrated through the inserts and attached to the underneath of the inserts were fixed in 4% paraformaldehyde for 10 min and stained in crystal violet for 15 min. The inserts were then air dried and subjected to cell counting under light microscopy with 40× magnification. The experiments were done in duplicate, and 8 random fields were counted from each insert. The unpaired two-tail t-tests were used to determine the significance of differences in migration between the different conditions.
Microarray Analyses
Human umbilical vein endothelial cells (HUVECs) were transfected with control siRNA or two different PML siRNA for 72 h, and total RNA was extracted by a PrepEase Kit (USB/Affymetrix). The total RNAs were sent to the Genomics Core at Cleveland Clinic Foundation for microarray with HumanRef-8_V2_0_R0_11223162_A (Illumina) chip. Each sample had technical duplicates. All statistical analysis was done in R/Bioconductor (24, 25).
Statistical Analysis of Microarray Data
Data were analyzed in the R/Bioconductor environment (24, 25). Briefly, the raw data were exported by BeadStudio (Illumina, v3.2.3) with background subtracted and imported and preprocessed by lumi package (26, 27). Data were transformed by the Variance-Stabilizing Transformation (VST) package (28) and then normalized by the Robust Spline Normalization (RSN) package (28). The significantly changed gene list was retrieved by a general linear model and empirical Bayes method through the Linear Models for Microarray Data (limma) package (29). The false discovery rate (FDR) was adjusted by Benjamini and Hochberg's method. Changes in expression level of >2 fold and p < 0.01 were considered significant. Gene ontology analysis was done by a hypergeometric test through the GeneAnswers package (30).
Accession Number of Microarray Data
The microarray data are deposited in the Gene Expression Omnibus (GEO) database. The accession number of the data set is GSE29238.
RESULTS
To examine the role of PML in EC network formation, we carried out PML knockdown followed by in vitro network formation assay to assess the ability of ECs to undergo angiogenesis. We found that that knocking down PML potentiated the in vitro angiogenesis of primary human umbilical vein endothelial cells (HUVECs) (Fig. 1, A and B). TNFα has been shown to have an ambiguous role in endothelial angiogenesis (20, 21), cell migration, and adhesion (21, 31–33). Interestingly, we have previously shown that TNFα induces PML protein accumulation in HUVECs (9). To better understand the role of PML in TNFα-regulated angiogenesis, we determined the effect of TNFα on EC network formation and found that TNFα inhibited network formation in ECs in a dose-dependent manner (Fig. 1, C and D). Similarly, knockdown of PML increased network formation in microvascular endothelial cells (HMVECs) (Fig. 1E). PML is highly expressed in inflamed tissues and normal vascular endothelium (8). Part of the inflammatory response includes changes in the vascular endothelium induced by inflammation-associated cytokines. We were therefore interested in whether PML is up-regulated in ECs treated with other cytokines, such as IFNs and what effects these cytokines had on ECs. To test this, HUVECs were treated with TNFα, IFNα, or IFNγ for 16 h followed by in vitro EC network formation assays. We found that these cytokines inhibited in vitro network formation and induced PML protein levels in HUVECs (Fig. 2, A–C). A similar observation was obtained in HMVECs (Fig. 2, D and E).
The observations that PML knockdown promotes EC network formation and that TNFα, IFNα, and IFNγ induce PML expression and inhibited EC network formation raised the possibility that induction of PML is mechanistically involved in the ability of these cytokines to inhibit network formation. To test this, we performed siRNA knockdown of PML followed by TNFα, IFNα, or IFNγ treatment and in vitro network formation assays in HUVECs and HMVECs. We found that knockdown of PML significantly alleviated TNFα-, IFNα-, and IFNγ-mediated inhibition of network formation in HUVECs (Fig. 3, A and B). A fraction of cells were plated and harvested for Western blotting to determine PML knockdown efficiency (Fig. 3C). Furthermore, TNFα and IFNα were more potent inducers of PML accumulation than IFNγ, which correlates with the efficiency of inhibition in the network formation assays. In addition, these cytokines significantly inhibited network formation in HMVECs (Fig. 3D). Similarly, a fraction of HMVECs from experiments in Fig. 3D was harvested to verify PML knockdown efficiency (data not shown). No significant differences in apoptosis of HUVEC treated with vehicle, TNFα, or IFNα were observed under our experimental settings (data not shown).
The signal transducers and activators of transcription (STAT) are the primary transcription factors that mediate type I interferon activity (12, 14). By microarray analysis, we found that STAT1 is the most abundant of the STAT family member transcripts in HUVECs. In addition, PML is known as an IFNs-stimulated gene (34). We suspected that STAT1 regulates PML transcription in HUVECs following IFNα treatment. Indeed, IFNα was capable of inducing STAT1 and PML mRNA (Fig. 4A) and protein levels (Fig. 4B) as well as PML NBs formation (supplemental Fig. S1). Knockdown of STAT1 by siRNA significantly abolished the ability of IFNα to induce PML mRNA, protein levels, and formation of PML NBs (Fig. 4, A, C, D). Surprisingly, we also observed that TNFα, when treated solely at non-apoptotic dose (20 ng/ml), modestly induced STAT1 mRNA accumulation and protein levels (Fig. 4, A–D). Although the mechanism by which TNFα induces STAT1 in HUVECs is currently unclear, knockdown of STAT1 abolished TNFα-mediated induction of PML (Fig. 4, A, C, D). These data indicate that STAT1 positively regulates PML expression following TNFα and IFNα treatment. We analyzed PML promoter and identified two putative STAT binding sites upstream of the transcription start site predicted by Genomatix (Fig. 4E). These two putative STAT binding sites are different from a previously mapped STAT responsive element in the exon 2 of the PML gene (34). By chromatin immunoprecipitation assays, we show that STAT1 binds to these two putative sites following TNFα and IFNα treatment and that TNFα and IFNα treatment also increased the acetylation of histone H3 in these two sites compared with vehicle (Fig. 4E). To test whether STAT1 plays a role in TNFα- and IFNα-mediated inhibition of EC network formation, we transiently knocked down STAT1 and assessed the ability of TNFα and IFNα to inhibit EC network formation. We found that knockdown of STAT1 significantly relieved TNFα- and IFNα-mediated inhibition of network formation (Fig. 4F). These data indicate that STAT1 is critical for basal and TNFα- and IFNα-induced expression of PML mRNA and protein and that STAT1 is important for TNFα- and IFNα-mediated inhibition of EC network formation.
EC migration is an essential step during network formation. To further assess the role of PML in EC angiogenesis, we analyzed how PML regulates EC migration. The observation that knockdown of PML promoted HUVEC migration (supplemental Fig. S2) indicated that PML may regulate expression of genes involved in cell migration. We carried out a microarray analysis using total RNA extracted from HUVECs either treated with a control siRNA or with two different PML siRNAs. We identified a panel of altered genes known to be involved in cell migration and angiogenesis following PML knockdown. A heatmap presentation (Fig. 5A) shows that some of the known angiostatic genes were down-regulated while other known angiogenic genes were up-regulated after knockdown of PML. Of the significantly up-regulated genes, we focused our study on integrin β1 (ITGB1). β integrins play an important role in endothelial cell migration during angiogenesis (31). Among the 8 human β integrins (namely ITGB1–8), ITGB1, ITGB3, and ITGB5 are expressed in endothelial cells and ITGB1 is the predominant form (31, 33). Indeed, our microarray analysis showed that ITGB1 is the most highly expressed β integrin in HUVECs, although expression of ITGB3 and ITGB5 was also detectable. We also found that knockown of PML specifically up-regulates ITGB1 but not ITGB3 or ITGB5 (data not shown). We therefore focused on ITGB1. ITGB1 has been implicated in ischemic neovascularization (35), cell-to-cell and cell-to-extracellular matrix adhesion and cell migration (36, 37). We hypothesized that PML regulates EC migration, in part, by modulating ITGB1 expression. To test this, we first confirmed that knockdown of PML resulted in increased ITGB1 mRNA and protein accumulation in HUVECs (Fig. 5, B and C). In addition, TNFα, IFNα, and IFNγ treatment, which increase PML level (Fig. 2), suppressed ITGB1 mRNA and protein levels in both HUVECs and HMVECs (Fig. 5, D and E). We also examined and found that knockdown of PML does not significantly alter the expression of VEGFA, VEGFB, and VEGFC (data not shown).
FIGURE 5.

PML, TNFα, and IFNα inhibit integrin β1 (ITGB1) expression. A, heatmap of a panel of significantly altered genes (>2-fold, p < 0.01) involved in cell migration and angiogenesis identified by microarray gene expression analyses in HUVECs. siCTRL (control siRNA), two PML siRNAs (siPML-1 and siPML-2). Row z-score uses a green-black-red color scheme to represent relatively low-median-high expression levels. Official gene symbols are labeled beside each row. B, effects of knockdown of PML on ITGB1 mRNA examined by qRT-PCR. Fold change is calculated as siPML/siControl. C, effects of knockdown of PML on ITGB1 protein level as assayed by Western blotting in HUVECs. D and E, effects of TNFα and IFNs treatment on ITGB1 accumulation in HUVECs and HMVECs at the mRNA level quantified by qRT-PCR (D) and at the protein level examined by Western blotting (E).
We also found that knockdown of STAT1 or PML by two different siRNAs relieved the TNFα- and IFNα-mediated reduction of ITGB1 protein levels in HUVECs (Fig. 6, A and B). Furthermore, to verify that ITGB1 is important for endothelial cell migration, we used a neutralizing antibody to block ITGB1 from interacting with extracellular matrix in the in vitro wound-healing assays. We found that addition of the ITGB1 neutralizing antibody significantly impaired HUVEC migration and further inhibited the migration of HUVEC pre-treated with TNFα or IFNα (Fig. 6C). To test whether ITGB1 plays a role in STAT1- and PML-mediated inhibition of EC migration, we knocked down STAT1 or PML by two different siRNAs followed by the addition of ITGB1 neutralizing antibody in the in vitro wound-healing assays. We found that knockdown of STAT1 or PML promoted cell migration, while ITGB1 neutralizing antibody significantly impaired cell migration in STAT1 or PML knockdown HUVECs (Fig. 6D).
FIGURE 6.

PML and STAT1 are required for TNFα and IFNα to inhibit integrin β1 (ITGB1) expression. A and B, effects of knockdown of STAT1 (A) or PML (B) on TNFα- and IFNα-mediated reduction of ITGB1 expression assayed by Western blotting. C, effects of ITGB1 blocking antibody on HUVEC wound-healing migration following TNFα or IFNα treatment. The width of the initial wound was set as 100%, mean ± S.D. (n = 16). closed means wound width percentage is 0%. D, effects of ITGB1 blocking antibody on HUVEC wound-healing migration following knockdown of STAT1 or PML. siCTRL (control siRNA), two STAT1 siRNAs (siSTAT1–1 and siSTAT1–2), and two PML siRNAs (siPML-1 and siPML-2). An aliquot of the cells was used to determine STAT1 and PML knockdown efficiency as assayed by Western blotting (top panel), and the wound width percentages were quantified (bottom panel). Unpaired two-tail t test (**, p < 0.01; ***, p < 0.001; #, p < 0.00001).
Because in vitro wound-healing assays measure EC migration in a context of EC monolayer integrity, to better assess the role of PML on EC migration, we carried out transwell migration assays. We found that concurrent treatment of TNFα and IFNα suppressed HUVEC transwell migration toward higher concentration of fetal bovine serum (FBS) (Fig. 7A). However, knockdown of PML promoted the HUVEC transwell migration in the presence of TNFα and IFNα. Consistent with FBS-directed migration, we found that TNFα and IFNα inhibited HUVEC transwell migration to an independent attractant, extracellular matrix (ECM), and that knockdown of PML promoted HUVEC transwell migration and relieved TNFα- and IFNα-mediated inhibition (Fig. 7B). These results demonstrated that the ability of TNFα and IFNα to inhibit transwell migration partly depends on PML.
FIGURE 7.
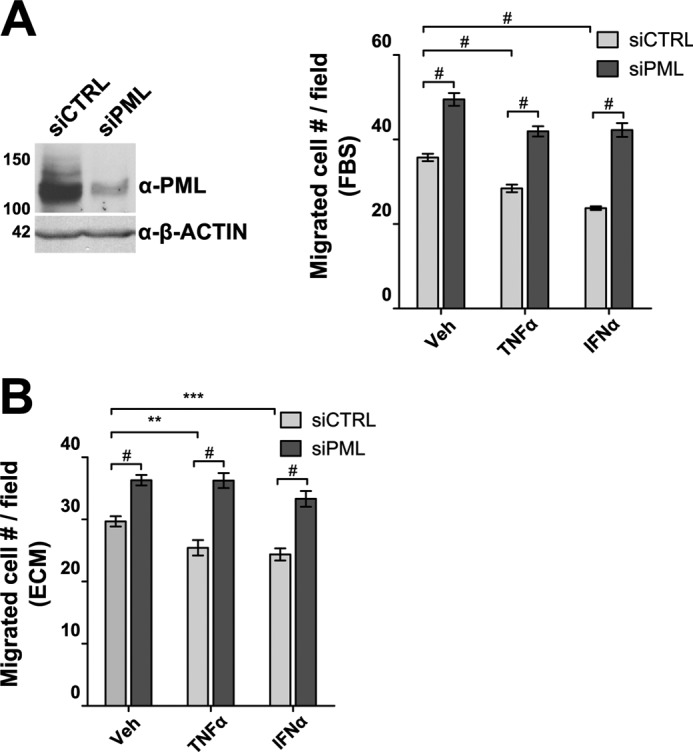
PML regulates transwell migration of endothelial cells. PML was knocked down by a mixture of two siRNAs (siPML-1 and siPML-2) followed by transwell migration assays. A, migration toward 10% fetal bovine serum, FBS. Assays were performed in the presence of TNFα (20 ng/ml) or IFNα (103 units/ml) following 72 h of transfection of control siRNA (siCTRL) or PML siRNA (siPML). An aliquot of cells was harvested and Western blotting was performed to examine PML knockdown efficiency (left panel). Migration assays were quantified as described in “Experimental Procedures.” B, transwell migration toward the ECM. Experiments were conducted as described in A except that ECM was used to replace FBS. Unpaired two-tail t test was used to determine the statistical significance (**, p < 0.01; ***, p < 0.001; #, p < 0.00001).
DISCUSSION
Angiogenesis is one of the hallmarks in tumorigenesis and inflammatory diseases (15–18). Inflammation-associated cytokines, such as TNFα and IFNα invoke various cellular responses after binding to cell surface receptors, however their roles in angiogenesis are not fully understood (13, 38–40). PML is a tumor suppressor and highly expressed in ECs but its role in ECs remains largely unknown. In this study, we show that PML has a novel inhibitory role in regulating EC network formation and migration in response to TNFα and IFNα. Our data demonstrate that PML is an important mediator for TNFα- and IFNα-mediated inhibition of EC network formation and migration. We are first to show that besides IFNα, TNFα also up-regulates PML mRNA, in part, through transcriptional factor STAT1 in ECs. Through microarray analysis in ECs, we identified ITGB1 as a potential PML target gene involved in cell migration and angiogenesis. In addition, our data indicate that TNFα and IFNα negatively regulate the expression of ITGB1 in a PML-dependent manner. The ITGB1 antibody significantly blocked PML knockdown-mediated increase in EC migration, suggesting that ITGB1 is partially responsible for PML-regulated EC migration. Transwell chamber migration assays also confirmed that PML suppression of EC migration and its importance for TNFα- and IFNα-mediated reduction of EC migration. Together, our study provides concrete evidence implicating an angiostatic role of PML in EC physiology.
STAT1 is activated by IFNα and IFNγ in several non-endothelial cells (41–43) and by IFNγ in HUVEC (44). PML is an interferon-stimulated gene (34); however, whether STAT1 plays a role in IFNα-induced PML mRNA accumulation in ECs and the mechanisms underlying this regulation remained largely unknown. Functionally, we show for the first time that knockdown of STAT1 significantly reduced basal as well as TNFα- and IFNα-induced PML levels. These data indicate that STAT1 positively regulates PML gene transcription in response to cytokine treatment. Consistent with the hypothesis, we demonstrate that TNFα and IFNα treatment increased STAT1 binding to the PML promoter at two novel STAT binding sites. These data suggest that STAT transcription factors account for the transcriptional induction of PML expression following TNFα or IFNα treatment. To our knowledge, we are first to show that STAT1 can be induced by TNFα in ECs, though to a lesser extent than IFNα. A possible mechanism is that TNFα treatment stimulates ECs to release interleukins (ILs) through NF-κB pathway (12, 14). ILs, such as IL15, have been shown to mildly activate STAT1 signaling (45). However, full understanding of this process requires future studies.
Cytokine signaling plays pivotal roles to modulate EC activities through mechanisms that are yet to be fully elucidated. PML is highly expressed in ECs (8); however its precise role in cytokine-modulated angiogenesis is not understood. Our data show that TNFα and IFNα induced PML mRNA and protein accumulation in ECs. Furthermore, by a knockdown approach, we demonstrate that PML is an important effector that mediates the inhibitory effects by TNFα and IFNα on network formation in both HUVECs and HMVECs. Interestingly, we noticed that knockdown of PML does not fully abolish the inhibition of EC network formation by cytokines. This suggests that PML-independent pathways are also involved, although this could be due to incomplete knockdown of PML in cytokine-treated cells (Fig. 3). The TNF family member, TRAIL and IFNα have been reported to induce apoptosis in cancer cells (46, 47). However, we did not observe significant differences in apoptosis between cells treated with vehicle, TNFα or IFNα in human primary endothelial cells, as judged by trypan blue and crystal violet cell viability assays (data not shown). Therefore, we do not think apoptosis accounts for the reduced tube formation observed in TNFα- or IFNα-treated HUVECs. Instead, we conclude that the ability of PML to inhibit EC network formation is likely achieved through alterations in target gene expression that ultimately lead to remodeling of the extracellular matrix, migration, apoptosis, and proliferation. Consistent with this notion, PML−/− mice exhibited increased neovascularization following ischemic hypoxia, partly through down-regulation of HIF1α, a master angiogenic regulator (40). While HIF1α regulates VEGF transcription, the PML−/− mouse of neovascularization model also reported a modest increase in plasma VEGF concentration (40), raising the possibility that PML regulates VEGF gene transcription. In addition, we previously demonstrated that PML is critical for basal and TNFα-induced accumulation of MMP-10, a pivotal regulator in remodeling of the extracellular matrix (9). To further investigate the mechanisms underlying regulation of angiogenesis by PML in human endothelial cells, we performed a microarray analysis and identified an array of significantly changed genes involved in cell migration and angiogenesis. Surprisingly, our microarray analysis results suggest that knockdown of PML by two indepenent siRNAs in HUVECs does not significantly alter VEGF family gene transcription (VEGFA, VEGFB, and VEGFC). One possibility is that the reported modest increase of circulating VEGF in PML−/− mouse model (40) results from certain non-endothelium mechanism. Alternatively, we still cannot rule out the potential species difference between human and mouse. Interestingly, some other known angiostatic genes were down-regulated while other angiogenic factors were up-regulated as shown by our microarray analysis results in HUVECs. This expression profile conveys a picture of the molecular basis by which knockdown of PML promotes angiogenesis in ECs and identifies potential novel PML target genes in endothelial cells.
An early major event downstream of TNFα signaling is the activation of NF-κB transcription factor (13). NF-κB activation has been shown to be angiogenic (48). Concurrent treatment with TNFα and IKK inhibitor VII, a previously reported (49–51) selective IKK inhibitor which inhibits NF-κB activation by blocking IκB degradation, efficiently inhibited NF-κB nuclear translocation (supplemental Fig. S3A) and target gene induction (supplemental Fig. S3B), but showed no obvious effects on TNFα- or IFNα-mediated induction of PML protein accumulation (supplemental Fig. S3C). However, the observation that PML inhibits NF-κB transcription activity (52) raises the possibility that part of the TNFα effect may depend upon the antagonism between PML and NF-κB signaling. As a tumor suppressor (53, 54), PML expression is subject to regulation by a host of extracellular stimuli (10). Interestingly, PML protein levels in many cancerous tissues are expressed at a lower level than that in normal tissues (54). We suspect that in some cancerous tissues, TNFα may have lost its ability to induce PML expression and thus becomes pro-angiogenic.
Previous studies have suggested that STAT1 negatively regulates angiogenesis (55). Knockdown of STAT1 in HUVECs blocks IFNγ-mediated inhibition of EC network formation. Furthermore, STAT1 inhibits angiogenesis by suppressing the expression of proangiogenic genes, including bFGF, MMP-2, MMP-9 in response to IFNβ treatment (56). In addition, STAT1 is also involved in IFNγ-mediated inhibition of monocyte migration (57) and integrin-mediated cell adhesion (58). Our data expand the molecular understanding of the role of STAT1 in EC angiogenesis by demonstrating that STAT1 is important for TNFα- and IFNα-mediated inhibition of angiogenesis in part by activating PML expression. Furthermore, we demonstrate that in response to TNFα and IFNα, STAT1 regulates HUVEC migration, in part, through an ITGB1-dependent manner.
Endothelial cell migration is an important process during angiogenesis and transcriptional regulation of certain key genes could be one of the regulatory mechanisms involved in this multiple-faceted process. Among the significantly changed genes we identified by microarray analyses, we focused on ITGB1. We hypothesized that PML regulates EC migration at least partially by regulating ITGB1 expression. Indeed, we not only confirmed ITGB1 is suppressed by PML and inhibited by TNFα and IFNα in a STAT1- and PML-dependent manner, we also demonstrated that ITGB1 is functionally important in STAT1- and PML-regulated HUVEC migration. These data suggest that both PML and STAT1 are important regulators of ITGB1 expression in ECs. Furthermore, antibody experiments show that blocking ITGB1 delays the wound healing even in the presence of TNFα and IFNα, though to a lesser extent compared with vehicle treatment (Fig. 6C). These data suggest that the ability of TNFα and IFNα inhibit EC migration requires both ITGB1-dependent and independent pathways. Interestingly, we also noticed that in α-ITGB1 antibody treated ECs, knockdown of PML resulted in relatively faster migration than the control siRNA-transfected cells and STAT1 knockdown cells (Fig. 6D). This suggests that PML inhibits EC migration through both ITGB1-dependent and -independent pathways. Overall, these data support a model in which ITGB1 is an important effector for EC migration downstream of cytokine signaling, STAT1 and PML.
Acknowledgments
We thank Drs. David Samols, Edward Stavnezer, Ganes Sen, and George Stark for their comments on the manuscript.
This work was supported, in whole or in part, by National Institutes of Health, R01 DK078965 and HL093269 (to H. Y. K.).
The microarray data are deposited in the Gene Expression Omnibus (GEO) database. The accession number of the data set is GSE29238.

This article contains supplemental Table S1 and Figs. S1–S3.
- PML
- promyelocytic leukemia protein
- EC
- endothelial cell
- TNF
- tumor necrosis factor
- ECM
- extracellular matrix
- HUVEC
- human umbilical vein endothelial cell.
REFERENCES
- 1. Crowder C., Dahle Ø., Davis R. E., Gabrielsen O. S., Rudikoff S. (2005) PML mediates IFN-α-induced apoptosis in myeloma by regulating TRAIL induction. Blood 105, 1280–1287 [DOI] [PubMed] [Google Scholar]
- 2. Kakizuka A., Miller W. H., Jr., Umesono K., Warrell R. P., Jr., Frankel S. R., Murty V. V., Dmitrovsky E., Evans R. M. (1991) Chromosomal translocation t(15;17) in human acute promyelocytic leukemia fuses RARα with a novel putative transcription factor, PML. Cell 66, 663–674 [DOI] [PubMed] [Google Scholar]
- 3. de Thé H., Lavau C., Marchio A., Chomienne C., Degos L., Dejean A. (1991) The PML-RARα fusion mRNA generated by the t(15;17) translocation in acute promyelocytic leukemia encodes a functionally altered RAR. Cell 66, 675–684 [DOI] [PubMed] [Google Scholar]
- 4. Everett R. D. (2001) DNA viruses and viral proteins that interact with PML nuclear bodies. Oncogene 20, 7266–7273 [DOI] [PubMed] [Google Scholar]
- 5. Negorev D., Maul G. G. (2001) Cellular proteins localized at and interacting within ND10/PML nuclear bodies/PODs suggest functions of a nuclear depot. Oncogene 20, 7234–7242 [DOI] [PubMed] [Google Scholar]
- 6. Lehembre F., Müller S., Pandolfi P. P., Dejean A. (2001) Regulation of Pax3 transcriptional activity by SUMO-1-modified PML. Oncogene 20, 1–9 [DOI] [PubMed] [Google Scholar]
- 7. Bernardi R., Guernah I., Jin D., Grisendi S., Alimonti A., Teruya-Feldstein J., Cordon-Cardo C., Simon M. C., Rafii S., Pandolfi P. P. (2006) PML inhibits HIF-1α translation and neoangiogenesis through repression of mTOR. Nature 442, 779–785 [DOI] [PubMed] [Google Scholar]
- 8. Terris B., Baldin V., Dubois S., Degott C., Flejou J. F., Hénin D., Dejean A. (1995) PML nuclear bodies are general targets for inflammation and cell proliferation. Cancer Res. 55, 1590–1597 [PubMed] [Google Scholar]
- 9. Gao C., Cheng X., Lam M., Liu Y., Liu Q., Chang K. S., Kao H. Y. (2008) Signal-dependent regulation of transcription by histone deacetylase 7 involves recruitment to promyelocytic leukemia protein nuclear bodies. Mol. Biol. Cell 19, 3020–3027 [DOI] [PMC free article] [PubMed] [Google Scholar]
- 10. Reineke E. L., Kao H. Y. (2009) Targeting promyelocytic leukemia protein: a means to regulating PML nuclear bodies. Int. J. Biol. Sci. 5, 366–376 [DOI] [PMC free article] [PubMed] [Google Scholar]
- 11. Aggarwal B. B. (2003) Signaling pathways of the TNF superfamily: a double-edged sword. Nature Reviews. Immunology 3, 745–756 [DOI] [PubMed] [Google Scholar]
- 12. Sen G. C. (2001) Viruses and interferons. Annu. Rev. Microbiol. 55, 255–281 [DOI] [PubMed] [Google Scholar]
- 13. Locksley R. M., Killeen N., Lenardo M. J. (2001) The TNF and TNF receptor superfamilies: integrating mammalian biology. Cell 104, 487–501 [DOI] [PubMed] [Google Scholar]
- 14. Borden E. C., Sen G. C., Uze G., Silverman R. H., Ransohoff R. M., Foster G. R., Stark G. R. (2007) Interferons at age 50: past, current and future impact on biomedicine. Nature Reviews. Drug Discovery 6, 975–990 [DOI] [PMC free article] [PubMed] [Google Scholar]
- 15. Albini A., Tosetti F., Benelli R., Noonan D. M. (2005) Tumor inflammatory angiogenesis and its chemoprevention. Cancer Res. 65, 10637–10641 [DOI] [PubMed] [Google Scholar]
- 16. Bergers G., Benjamin L. E. (2003) Tumorigenesis and the angiogenic switch. Nat. Rev. Cancer 3, 401–410 [DOI] [PubMed] [Google Scholar]
- 17. Folkman J. (2006) Angiogenesis. Annu. Rev. Med. 57, 1–18 [DOI] [PubMed] [Google Scholar]
- 18. Medina J., Arroyo A. G., Sánchez-Madrid F., Moreno-Otero R. (2004) Angiogenesis in chronic inflammatory liver disease. Hepatology 39, 1185–1195 [DOI] [PubMed] [Google Scholar]
- 19. Leibovich S. J., Polverini P. J., Shepard H. M., Wiseman D. M., Shively V., Nuseir N. (1987) Macrophage-induced angiogenesis is mediated by tumour necrosis factor-α. Nature 329, 630–632 [DOI] [PubMed] [Google Scholar]
- 20. Rosenbaum J. T., Howes E. L., Jr., Rubin R. M., Samples J. R. (1988) Ocular inflammatory effects of intravitreally-injected tumor necrosis factor. Am. J. Pathol. 133, 47–53 [PMC free article] [PubMed] [Google Scholar]
- 21. Sunderkötter C., Roth J., Sorg C. (1990) Immunohistochemical detection of bFGF and TNF-α in the course of inflammatory angiogenesis in the mouse cornea. Am. J. Pathol. 137, 511–515 [PMC free article] [PubMed] [Google Scholar]
- 22. Cheng X., Kao H. Y. (2009) G protein pathway suppressor 2 (GPS2) is a transcriptional corepressor important for estrogen receptor α-mediated transcriptional regulation. J. Biol. Chem. 284, 36395–36404 [DOI] [PMC free article] [PubMed] [Google Scholar]
- 23. Mottet D., Bellahcène A., Pirotte S., Waltregny D., Deroanne C., Lamour V., Lidereau R., Castronovo V. (2007) Histone deacetylase 7 silencing alters endothelial cell migration, a key step in angiogenesis. Circ. Res. 101, 1237–1246 [DOI] [PubMed] [Google Scholar]
- 24. Team R. D. C. (2009) R: A Language and Environment for Statistical Computing, R Foundation for Statistical Computing, Vienna, Austria [Google Scholar]
- 25. Gentleman R. C., Carey V. J., Bates D. M., Bolstad B., Dettling M., Dudoit S., Ellis B., Gautier L., Ge Y., Gentry J., Hornik K., Hothorn T., Huber W., Iacus S., Irizarry R., Leisch F., Li C., Maechler M., Rossini A. J., Sawitzki G., Smith C., Smyth G., Tierney L., Yang J. Y., Zhang J. (2004) Bioconductor: open software development for computational biology and bioinformatics. Genome Biol. 5, R80. [DOI] [PMC free article] [PubMed] [Google Scholar]
- 26. Du P, Kibbe W. A., Lin S. M. (2008) lumi: a pipeline for processing Illumina microarray. Bioinformatics 24, 1547–1548 [DOI] [PubMed] [Google Scholar]
- 27. Du P, Kibbe W. A., Lin S. M. (2007) nuID: a universal naming scheme of oligonucleotides for illumina, affymetrix, and other microarrays. Biol. Direct 2, 16. [DOI] [PMC free article] [PubMed] [Google Scholar]
- 28. Lin S. M., Du P, Huber W., Kibbe W. A. (2008) Model-based variance-stabilizing transformation for Illumina microarray data. Nucleic Acids Res. 36, e11. [DOI] [PMC free article] [PubMed] [Google Scholar]
- 29. Smyth G. K. (2005) Bioinformatics and Computational Biology Solutions using R and Bioconductor, Vol. 420, pp. 397–420 [Google Scholar]
- 30. Feng G., Du P, Krett N. L., Tessel M., Rosen S., Kibbe W. A., Lin S. M. (2010) A collection of bioconductor methods to visualize gene-list annotations. BMC Res. Notes 3, 10. [DOI] [PMC free article] [PubMed] [Google Scholar]
- 31. Avraamides C. J., Garmy-Susini B., Varner J. A. (2008) Integrins in angiogenesis and lymphangiogenesis. Nature Reviews Cancer 8, 604–617 [DOI] [PMC free article] [PubMed] [Google Scholar]
- 32. Miele M. E., Bennett C. F., Miller B. E., Welch D. R. (1994) Enhanced metastatic ability of TNF-α-treated malignant melanoma cells is reduced by intercellular adhesion molecule-1 (ICAM-1, CD54) antisense oligonucleotides. Exp. Cell Res. 214, 231–241 [DOI] [PubMed] [Google Scholar]
- 33. Nakao S., Kuwano T., Ishibashi T., Kuwano M., Ono M. (2003) Synergistic effect of TNF-α in soluble VCAM-1-induced angiogenesis through α4 integrins. J. Immunol. 170, 5704–5711 [DOI] [PubMed] [Google Scholar]
- 34. Stadler M., Chelbi-Alix M. K., Koken M. H., Venturini L., Lee C., Saïb A., Quignon F., Pelicano L., Guillemin M. C., Schindler C. (1995) Transcriptional induction of the PML growth suppressor gene by interferons is mediated through an ISRE and a GAS element. Oncogene 11, 2565–2573 [PubMed] [Google Scholar]
- 35. Caporali A., Pani E., Horrevoets A. J., Kraenkel N., Oikawa A., Sala-Newby G. B., Meloni M., Cristofaro B., Graiani G., Leroyer A. S., Boulanger C. M., Spinetti G., Yoon S. O., Madeddu P., Emanueli C. (2008) Neurotrophin p75 receptor (p75NTR) promotes endothelial cell apoptosis and inhibits angiogenesis: implications for diabetes-induced impaired neovascularization in ischemic limb muscles. Circ. Res. 103, e15-e26 [DOI] [PMC free article] [PubMed] [Google Scholar]
- 36. Breau M. A., Dahmani A., Broders-Bondon F., Thiery J. P., Dufour S. (2009) β1 integrins are required for the invasion of the caecum and proximal hindgut by enteric neural crest cells. Development 136, 2791–2801 [DOI] [PubMed] [Google Scholar]
- 37. Reineke E. L., Liu Y., Kao H. Y. (2010) Promyelocytic leukemia protein controls cell migration in response to hydrogen peroxide and insulin-like growth factor-1. J. Biol. Chem. 285, 9485–9492 [DOI] [PMC free article] [PubMed] [Google Scholar]
- 38. Hehlgans T., Pfeffer K. (2005) The intriguing biology of the tumour necrosis factor/tumour necrosis factor receptor superfamily: players, rules and the games. Immunology 115, 1–20 [DOI] [PMC free article] [PubMed] [Google Scholar]
- 39. Mathew S. J., Haubert D., Krönke M., Leptin M. (2009) Looking beyond death: a morphogenetic role for the TNF signaling pathway. J. Cell Sci. 122, 1939–1946 [DOI] [PubMed] [Google Scholar]
- 40. Mbow M. L., Sarisky R. T. (2004) What is disrupting IFN-α's antiviral activity? Trends Biotechnol. 22, 395–399 [DOI] [PubMed] [Google Scholar]
- 41. Takaoka A., Tanaka N., Mitani Y., Miyazaki T., Fujii H., Sato M., Kovarik P., Decker T., Schlessinger J., Taniguchi T. (1999) Protein-tyrosine kinase Pyk2 mediates the Jak-dependent activation of MAPK and Stat1 in IFN-γ, but not IFN-α, signaling. EMBO J. 18, 2480–2488 [DOI] [PMC free article] [PubMed] [Google Scholar]
- 42. Uddin S., Lekmine F., Sharma N., Majchrzak B., Mayer I., Young P. R., Bokoch G. M., Fish E. N., Platanias L. C. (2000) The Rac1/p38 mitogen-activated protein kinase pathway is required for interferon α-dependent transcriptional activation but not serine phosphorylation of Stat proteins. J. Biol. Chem. 275, 27634–27640 [DOI] [PubMed] [Google Scholar]
- 43. Wong L. H., Sim H., Chatterjee-Kishore M., Hatzinisiriou I., Devenish R. J., Stark G., Ralph S. J. (2002) Isolation and characterization of a human STAT1 gene regulatory element. Inducibility by interferon (IFN) types I and II and role of IFN regulatory factor-1. J. Biol. Chem. 277, 19408–19417 [DOI] [PubMed] [Google Scholar]
- 44. Mahboubi K., Pober J. S. (2002) Activation of signal transducer and activator of transcription 1 (STAT1) is not sufficient for the induction of STAT1-dependent genes in endothelial cells. Comparison of interferon-γ and oncostatin M. J. Biol. Chem. 277, 8012–8021 [DOI] [PubMed] [Google Scholar]
- 45. de Totero D., Meazza R., Capaia M., Fabbi M., Azzarone B., Balleari E., Gobbi M., Cutrona G., Ferrarini M., Ferrini S. (2008) The opposite effects of IL-15 and IL-21 on CLL B cells correlate with differential activation of the JAK/STAT and ERK1/2 pathways. Blood 111, 517–524 [DOI] [PubMed] [Google Scholar]
- 46. Wang S., El-Deiry W. S. (2003) TRAIL and apoptosis induction by TNF-family death receptors. Oncogene 22, 8628–8633 [DOI] [PubMed] [Google Scholar]
- 47. Caraglia M., Abbruzzese A., Leardi A., Pepe S., Budillon A., Baldassare G., Selleri C., Lorenzo S. D., Fabbrocini A., Giuberti G., Vitale G., Lupoli G., Bianco A. R., Tagliaferri P. (1999) Interferon-α induces apoptosis in human KB cells through a stress-dependent mitogen-activated protein kinase pathway that is antagonized by epidermal growth factor. Cell Death Differ. 6, 773–780 [DOI] [PubMed] [Google Scholar]
- 48. Karin M. (2006) Nuclear factor-κB in cancer development and progression. Nature 441, 431–436 [DOI] [PubMed] [Google Scholar]
- 49. Gambaryan S., Kobsar A., Rukoyatkina N., Herterich S., Geiger J., Smolenski A., Lohmann S. M., Walter U. (2010) Thrombin and collagen induce a feedback inhibitory signaling pathway in platelets involving dissociation of the catalytic subunit of protein kinase A from an NFκB-IκB complex. J. Biol. Chem. 285, 18352–18363 [DOI] [PMC free article] [PubMed] [Google Scholar]
- 50. Dougan M., Li D., Neuberg D., Mihm M., Googe P., Wong K. K., Dranoff G. (2011) A dual role for the immune response in a mouse model of inflammation-associated lung cancer. J. Clin. Invest. 121, 2436–2446 [DOI] [PMC free article] [PubMed] [Google Scholar]
- 51. Pradhan M., Bembinster L. A., Baumgarten S. C., Frasor J. (2010) Proinflammatory cytokines enhance estrogen-dependent expression of the multidrug transporter gene ABCG2 through estrogen receptor and NF{κ}B cooperativity at adjacent response elements. J. Biol. Chem. 285, 31100–31106 [DOI] [PMC free article] [PubMed] [Google Scholar]
- 52. Wu W. S., Xu Z. X., Hittelman W. N., Salomoni P., Pandolfi P. P., Chang K. S. (2003) Promyelocytic leukemia protein sensitizes tumor necrosis factor α-induced apoptosis by inhibiting the NF-κB survival pathway. J. Biol. Chem. 278, 12294–12304 [DOI] [PubMed] [Google Scholar]
- 53. Rego E. M., Wang Z. G., Peruzzi D., He L. Z., Cordon-Cardo C., Pandolfi P. P. (2001) Role of promyelocytic leukemia (PML) protein in tumor suppression. J. Exp. Med. 193, 521–529 [DOI] [PMC free article] [PubMed] [Google Scholar]
- 54. Reineke E. L., Kao H. Y. (2009) PML: An emerging tumor suppressor and a target with therapeutic potential. Cancer Ther. 7, 219–226 [PMC free article] [PubMed] [Google Scholar]
- 55. Battle T. E., Lynch R. A., Frank D. A. (2006) Signal transducer and activator of transcription 1 activation in endothelial cells is a negative regulator of angiogenesis. Cancer Res. 66, 3649–3657 [DOI] [PubMed] [Google Scholar]
- 56. Huang S., Bucana C. D., Van Arsdall M., Fidler I. J. (2002) Stat1 negatively regulates angiogenesis, tumorigenicity, and metastasis of tumor cells. Oncogene 21, 2504–2512 [DOI] [PubMed] [Google Scholar]
- 57. Hu Y., Hu X., Boumsell L., Ivashkiv L. B. (2008) IFN-γ and STAT1 arrest monocyte migration and modulate RAC/CDC42 pathways. J. Immunol. 180, 8057–8065 [DOI] [PMC free article] [PubMed] [Google Scholar]
- 58. Xie B., Zhao J., Kitagawa M., Durbin J., Madri J. A., Guan J. L., Fu X. Y. (2001) Focal adhesion kinase activates Stat1 in integrin-mediated cell migration and adhesion. J. Biol. Chem. 276, 19512–19523 [DOI] [PubMed] [Google Scholar]