

Background: The functional signaling unit of G-protein-coupled receptors is debated to be a monomer, dimer, or higher order oligomer.
Results: Fluorescence correlation spectroscopy and photon counting histogram analysis, with single molecule sensitivity, identified 5-HT2C receptor dimers without monomers or tetramers.
Conclusion: Dimers are the basic signaling unit.
Significance: Bivalent ligands may have therapeutic potential.
Keywords: Fluorescence Correlation Spectroscopy, G Protein-coupled Receptors (GPCR), Protein Complexes, Receptor Structure-Function, Serotonin, 5-HT2C Receptor, FCS, GPCR, Photon Counting Histogram (PCH), Oligomer, Homodimer
Abstract
Fluorescence correlation spectroscopy (FCS) and photon counting histogram (PCH) are techniques with single molecule sensitivity that are well suited for examining the biophysical properties of protein complexes in living cells. In the present study, FCS and PCH were applied to determine the diffusion coefficient and oligomeric size of G-protein-coupled receptors. FCS was used to record fluctuations in fluorescence intensity arising from fluorescence-tagged 5-hydroxytryptamine 2C (5-HT2C) receptors diffusing within the plasma membrane of HEK293 cells and rat hippocampal neurons. Autocorrelation analysis yielded diffusion coefficients ranging from 0.8 to 1.2 μm2/s for fluorescence-tagged receptors. Because the molecular brightness of a fluorescent protein is directly proportional to the number of fluorescent proteins traveling together within a protein complex, it can be used to determine the oligomeric size of the protein complex. FCS and PCH analysis of fluorescence-tagged 5-HT2C receptors provided molecular brightness values that were twice that of GFP and YFP monomeric controls, similar to a dimeric GFP control, and unaltered by 5-HT. Bimolecular fluorescence complementation of the N- and C-terminal halves of YFP attached to 5-HT2C receptors was observed in endoplasmic reticulum/Golgi and plasma membranes with a brightness equal to monomeric YFP. When GFP-tagged 5-HT2C receptors were co-expressed with a large excess of untagged, non-fluorescent 5-HT2C receptors, the molecular brightness was reduced by half. PCH analysis of the FCS data were best described by a one-component dimer model without monomers or tetramers. Therefore, it is concluded that 5-HT2C receptors freely diffusing within the plasma membrane are dimeric.
Introduction
Approximately 4% of the human genome encodes G-protein-coupled receptors (GPCRs),2 one of the largest families of plasma membrane signaling proteins in the human body. These receptors have been successful targets for drug development, with a significant fraction of currently prescribed medications targeting GPCR. Although GPCR were discovered decades ago, there is still great debate as to what constitutes the functional signaling unit in vivo. Is it a monomer, dimer, or higher order oligomer? Several studies have reported that monomeric GPCR can be functional with respect to G-protein activation (1, 2) and that GPCR monomers can be detected in recombinant cells (3–5). However, GPCR dimers/oligomers have been identified in native tissues and primary cultures (6–8), and it has been reported that G-protein activation is maximal for the dimeric form of 5-HT receptors (8–10). In addition, dimerization has been reported to be an essential step in proper protein folding for exit from the endoplasmic reticulum (11–13). For class A GPCRs, homo- and heterodimerization have been reported to regulate ligand binding, second messenger activation, and receptor trafficking, and agonists have been reported to increase, decrease, or have no effect on GPCR dimerization (reviewed in Ref. 14). In the case of class C GABAB receptors, the functional significance of dimerization is clear. Heterodimerization between GABABR1 and GABABR2 receptors in the endoplasmic reticulum is essential for trafficking and expression of functional heterodimers on the plasma membrane (15–17).
Currently, there is no consensus as to the oligomeric size of class A GPCR. Studies of class A GPCR have reported dimers (8, 18–20), tetramers (21, 22), and higher order oligomers (13, 23). The most commonly employed methods include co-immunoprecipitation, resonance energy transfer (RET), and bimolecular fluorescence complementation (BiFC). Although co-immunoprecipitation provides information about direct protein-protein interactions, it requires solubilization of the proteins and thus cannot be applied to live cells. RET and BiFC can be applied to living cells, but they provide an indirect measure of protein-protein interaction by measuring the proximity of fluorescent probes attached to the parent proteins. More recently, single particle tracking methods, such as total internal reflection fluorescence imaging (TIRF), have been employed. Studies using TIRF imaging have suggested that M1 muscarinic receptors (24) and N-formyl peptide receptors (25) may exist in a monomer-dimer equilibrium on the plasma membrane. Although these studies represent a significant advance in terms of understanding receptor distribution and dynamics in plasma membranes, TIRF imaging has a limit of resolution of 200 nm and lacks single molecule sensitivity for proteins on the order of 5 nm, such as GPCR.
Fluorescence correlation spectroscopy (FCS) provides a good alternative for investigating the diffusion and oligomerization of plasma membrane proteins. It requires very low protein expression levels, making it suitable for studying receptors at physiological expression levels, and it has single molecule sensitivity. FCS records the fluctuations in fluorescence intensity arising from individual fluorescent molecules in a temporal manner (26, 27). Combining confocal microscopy with FCS has led to the development of sensitive methods for monitoring protein dynamics in living cells (28–34). Confocal microscopy-based FCS experiments are performed by focusing a laser beam into a small diffraction-limited spot (0.3 μm) using a high numerical aperture objective to obtain a detection or observation volume on the order of 10−15 liters. As individual fluorescent molecules pass through the observation volume and are excited by a laser, the emitted fluorescence is recorded by a photon-counting detector. The autocorrelation of the fluorescence signal depicts the fluctuations in fluorescence intensity as a function of particle number and diffusion time. FCS has been used to monitor diffusion and ligand binding for ion channels, tyrosine kinase receptors, and GPCRs (reviewed in Ref. 35). Fluorescence cross-correlation spectroscopy, which compares the autocorrelation signals from two different fluorescent probes, has been applied to study homo- and heterodimers of somatostatin receptors (36), epidermal growth factor receptors (37), ciliary neurotrophic factor receptors (38), and estrogen receptors (39).
Information about the oligomeric size of a protein cluster can be obtained by analyzing the amplitude of the fluctuations in fluorescence intensity measured in an FCS experiment. A photon counting histogram (PCH) can be generated from the FCS data and used to determine the molecular brightness of a given fluorescent species or a mixture of fluorescent species of differing molecular brightness. PCH theory was developed and applied as a confocal microscopy-based method to measure the number of photon counts produced by individual fluorescent molecules in a small, laser-illuminated observation volume (40). The term “molecular brightness” is used to describe the number of photon counts per molecule. Because the molecular brightness of a protein oligomer is directly proportional to the number of fluorescent molecules within the protein complex, it can be used to determine the oligomeric size of a protein complex. Molecular brightness analysis has been used to explore the oligomeric state of nuclear retinoid X receptors (41), epidermal growth factor receptors (42), urokinase plasminogen activator receptors (43), dynamin 2 (44), and HIV-1 Gag (34), but it has yet to be applied to GPCRs.
In the present study, the serotonin 5-HT2C receptor was chosen as a model class A GPCR to investigate receptor diffusion dynamics and oligomer size using FCS and PCH. 5-HT2C receptors are widely expressed throughout the brain in regions including the choroid plexus, hippocampus, hypothalamus, striatum, and cortex (45, 46). They have been proposed to play a role in appetite, mood, sleep, endocrine regulation, and drug addiction (46–48). Many different classes of psychoactive agents interact with 5-HT2C receptors, including hallucinogens, antipsychotics, antidepressants, and anxiolytics. Thus, the 5-HT2C receptor has been targeted for drug development for obesity, anxiety, depression, and schizophrenia (48). RET and cysteine cross-linking studies are consistent with the hypothesis that 5-HT2C receptors form homodimers in recombinant cells (9, 11, 49).
FCS combined with confocal microscopy is a powerful method for determining the number and molecular brightness of individual fluorescence-tagged proteins as a measure of their oligomeric status. The present study describes the application of BiFC with FCS and PCH analysis for monitoring the diffusion dynamics and determining the oligomeric size of 5-HT2C receptors freely diffusing within the plasma membrane of living cells.
EXPERIMENTAL PROCEDURES
Plasmid DNA Constructs
cDNA encoding the 5-HT2C receptor (VSV isoform) was cloned into the pEGFP, pEYFP, and mCherry vectors (Clontech) at EcoRI/BamHI to create chimeric receptors with fluorescent tags on the C terminus of the 5-HT2C receptor. A tandem GFP construct was made by PCR of the GFP open reading frame and subsequently cloned back into the pEGFP plasmid. Site-directed mutagenesis (Stratagene) was used to create an A206K mutation in all GFP constructs to eliminate potential aggregation (50). BiFC pairs (N-YFP and C-YFP) were made by site-directed mutagenesis using the 5-HT2C/YFP cDNA as the starting template. 5-HT2C/N-YFP was made by inserting a stop codon at amino acid 156 of YFP. 5-HT2C/C-YFP was made by inserting a BamHI site at amino acid 156 of the YFP, followed by BamHI digest to remove amino acids 1–155 of the YFP, and subsequent religation. β-Arrestin2 was a generous gift of the Lefkowitz laboratory and was cloned into pECFP plasmid to create the β-arrestin/CFP construct used in the β-arrestin recruitment assay.
Cell Culture and Transfection
HEK293 cells (ATCC) were cultured in Dulbecco's minimal essential medium (Cellgro) with 10% FBS (HyClone) in a humidified chamber at 37 °C, 5% CO2. HEK293 cells were plated in 6-well plates fitted with 25-mm poly-d-lysine-coated glass coverslips (Fisher) at a density of 7 × 10⁵ cells/coverslip and transfected with 30 ng of the indicated plasmid DNA using Lipofectamine reagent (Invitrogen) for 5 h. Following transfection, cells were cultured in DMEM (without phenol red) with 10% charcoal-stripped serum (Invitrogen) for 20 h at 37 °C, 5% CO2.
This transfection protocol results in 5-HT2C receptor expression levels of 1.1 ± 0.2 pmol/mg protein, determined by radioligand binding using a Kd concentration (1 nm) of [3H]mesulergine measured as described previously (9). For a typical transfection efficiency of 30%, this yields an approximate 5-HT2C receptor expression level of 6 pmol/mg protein for the transfected HEK293 cells used in the FCS studies. Previous studies have determined endogenous 5-HT2C receptor expression levels in choroid plexus epithelial cells to be in the range of 5–10 pmol/mg protein (51).
Neuronal cultures were prepared from hippocampi of fetal Sprague-Dawley rats (Taconic Farms) at gestational day 19 as described previously (52). Briefly, hippocampi were dissected and dissociated in HEPES-buffered salt solution with trypsin (0.25% for 15 min at 37 °C) and triturated with a fire-polished pipette. Dissociated neurons were washed in HEPES-buffered salt solution and were transfected with plasmid containing 5-HT2C/YFP cDNA using the Nucleofector kit from Amaxa according to the manufacturer's instructions. Following transfection, neurons were plated in MEM with 10% heat-inactivated horse serum at a density of 6,000 cells/cm2 on glass coverslips precoated with poly-d-lysine. Neurons were allowed to adhere to coverslips for 3 h, and then the coverslips were placed in 60-mm dishes of confluent astrocytes in serum-free neuron maintenance medium (MEM with N2 supplement, 0.1 mm pyruvate, 10 mm HEPES, conditioned by exposure to confluent cortical astrocytes for 2 days) and positioned so that they faced but did not contact the astrocytes. Twenty-four hours post-transfection, coverslips with plated neurons were washed twice with HEPES-buffered MEM (without phenol red) and placed in a viewing chamber with 1 ml of HEPES-buffered MEM (without phenol red) in preparation for the FCS experiments.
For 5-HT treatment, 5-HT was diluted in HEPES-buffered MEM (without phenol red) and was added directly to the viewing chamber to a final concentration of 50 nm. FCS measurements were initiated 1 min following the addition of 5-HT.
FCS
For FCS measurements, cells were washed twice with HEPES-buffered MEM (without phenol red), and the coverslip was placed in a viewing chamber with 1 ml of HEPES-buffered MEM (without phenol red). FCS measurements were made using a Zeiss LSM-510 confocal microscope equipped with a ConfoCor3 unit (Carl Zeiss) at the Center for Cell Analysis and Modeling, University of Connecticut Health Center (Farmington, CT). One-photon excitation with a continuous argon ion laser was performed using a ×40 (numerical aperture 1.2) C-apochromat water immersion objective to create an observation volume on the order of 0.5 fl. Because the observation volume is not illuminated homogenously, optimal positioning of the plasma membrane within the center of the observation volume is critical for accurate determination of the molecular brightness of fluorescence-tagged membrane proteins. FCS measurements were made on the apical plasma membrane (directly above the cell nucleus) of HEK293 cells or the hippocampal neuronal cell body, transfected with fluorescence-tagged 5-HT2C receptors. Positioning of the plasma membrane in the center of the observation volume was achieved by scanning the sample along the z axis while simultaneously monitoring the photon count rate. The z position corresponding to the maximal photon counts/molecule was selected. FCS measurements were recorded at 23 °C in HEPES-buffered MEM (without phenol red) for 100 s, as 10 consecutive 10-s intervals. As fluorescence-tagged receptors enter and diffuse through the observation volume they are excited by the laser. GFP, YFP, and mCherry were excited at 488, 514, and 563 nm, respectively, with a laser intensity of 0.15 milliwatt. The time-dependent fluctuations in fluorescence intensity were recorded on an avalanche photodiode as follows. Emitted fluorescence that was captured by the objective was passed through a dichroic mirror and an appropriate band pass filter and was focused onto the avalanche photodiode using a pinhole of 1 Airy unit (32 μm). The recordings were analyzed by a digital temporal correlator (using non-linear least-squares minimization, Zeiss Aim 4.2 software) to calculate the autocorrelation function G(τ), which represents the time-dependent decay in fluorescence fluctuation intensity as in Equation 1,
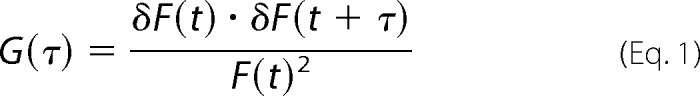 |
where G(τ) represents the 〈time average〉 of the change in fluorescence fluctuation intensity (δF) at some time point (t) and at a time interval later (t + τ), divided by the square of the average fluorescence intensity (I). Autocorrelation analyses were performed using the Zeiss Aim 4.2 software package with an autocorrelation bin time of 0.2 μs. The resulting autocorrelation curve depicts the fluorescence intensity fluctuations as a function of particle number and diffusion time. The average dwell time of the fluorescent species within the observation volume (τD) is calculated from the midpoint of the autocorrelation curve. The diffusion coefficient (D) for fluorescence-tagged plasma membrane proteins can then be calculated as in Equation 2, where ωr represents the radial waist of the observation volume (0.28 μm).
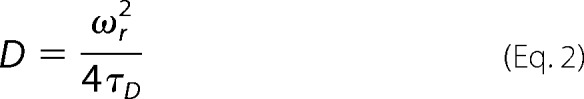 |
The amplitude of the autocorrelation function at time 0, G(0), is inversely related to the number of molecules (NPSF) and calculated as in Equation 3,
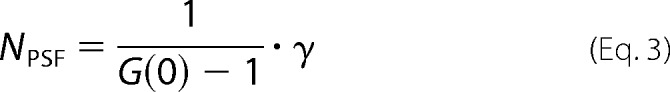 |
where γ represents the point spread function (PSF) describing the shape of the observation volume. For one-photon excitation, the observation volume is best described by a three-dimensional Gaussian model where γ = 0.35. Topography studies have provided clear and convincing images demonstrating the three-dimensional nature of plasma membranes (53). Thus, a valid case can be made for choosing a three-dimensional model for determining particle number and brightness. The average fluorescence intensity or average count rate (k) measured for a given sample depends on the number of fluorescent molecules (NPSF) and their molecular brightness (ϵ), as described in Equation 4.
Thus, dividing the count rate (k) by the number of molecules (NPSF) provides an estimate of the molecular brightness (ϵ) of the sample.
As controls, pEYFP and pEGFP plasmids were expressed in the cytosol of transfected HEK293 cells to estimate the molecular brightness of monomeric forms of YFP and GFP (with an A206K mutation to eliminate dimer formation) (50). A tandem construct (GFP-GFP with A206K mutations) was used to determine the molecular brightness of a dimer. For cytosolic YFP and GFP, FCS measurements were made in the cytoplasm near the nuclear envelope in the midportion of the cell to avoid sample thickness-dependent bias in brightness (54). A dilute solution (5 nm) of purified monomeric GFP was used for comparison with cytosolic GFP to evaluate the contribution of background autofluorescence from cytoplasmic proteins. In addition, two plasma membrane controls were used: a 5-HT2C/YFP BiFC pair and co-expression of 5-HT2C/GFP with a large excess of untagged, non-fluorescent 5-HT2C receptor.
PCH
Fluorescence fluctuation data recorded during an FCS experiment can be used to generate photon counting histograms, which provide quantitative information about the number of fluorescent molecules and the number of photon counts per molecule (40). In the present study, cells transfected with fluorescence-tagged 5-HT2C receptors were selected with an average plasma membrane photon count rate ranging from 50 to 150 kHz. Membrane regions containing ruffles, filopodia, and high concentrations of fluorescent proteins (>200 kHz) were avoided. Ten measurements were made on the upper plasma membrane of each cell by monitoring the photon count rate for 100 s, as 10 consecutive 10-s observation periods. Although the laser intensity was set to 0.15 milliwatt to minimize photobleaching, some photobleaching was apparent during the first 10-s observation period. Molecular brightness values were determined for each 10-s observation period. The average molecular brightness from the 2nd through 10th observation periods was then calculated and reported as the molecular brightness for that cell. Segments of the fluorescence intensity trace that showed large spikes or drifts in fluorescence intensity (due to cell movement) were excluded from the analysis. To generate a histogram, each 10-s observation period was broken down into 1 million intervals or bins (PCH bin time = 10 μs). Histograms were constructed (using the PCH module in the Zeiss Aim 4.2 software) in which the number of 10-μs bins was plotted on the y axis and photon counts on the x axis. The resulting histogram depicts the number of bins that registered 1,2,3 photon counts etc. during one 10-s observation period. Because a constant intensity light source produces a photon count distribution that follows Poisson statistics, as fluorescent molecules enter and diffuse through the non-homogenously illuminated observation volume, the fluctuations in fluorescence intensity result in a broadening of the Poisson distribution. This super-Poisson characteristic is observed in the tail of the PCH curve. The data were fit to a one-component model, where concentration and molecular brightness were allowed to be free, and the first order correction was fixed at zero. Reduced χ2 analysis was used to determine the goodness of fit.
RESULTS
BiFC with FCS and PCH analysis was applied to study the diffusion dynamics and oligomeric size of 5-HT2C receptors in HEK293 cells and primary hippocampal neurons. Previously, we have shown that 5-HT2C receptors with C-terminal fluorescent tags exhibit normal trafficking and signaling properties in HEK293 cells (55). Reported EC50 values for 5-HT-stimulated inositol phosphate production were 2.4 ± 0.5 and 2.8 ± 0.9 nm for fluorescence-tagged and -untagged receptors, respectively (55). Our previous studies using resonance energy transfer are consistent with the hypothesis that 5-HT2C receptors form homodimers (9, 11). In the present study, these results were confirmed using BiFC (Fig. 1). Plasma membrane YFP fluorescence was observed in HEK293 cells 20 h after co-transfection with 5-HT2C receptor cDNAs labeled with the N- and C-terminal halves of YFP (5-HT2C/N-YFP + 5-HT2C/C-YFP) as shown in Fig. 1A. Complementation of YFP fluorescence was lower following co-expression of 5-HT2C/N-YFP with β2-adrenergic/C-YFP (Fig. 1B) but was similar in cells co-expressing β2-adrenergic/N-YFP and β2-adrenergic/C-YFP (Fig. 1C). When cells co-transfected with 5-HT2C/N-YFP and 5-HT2C/C-YFP were examined 16 h post-transfection, YFP fluorescence was observed in the endoplasmic reticulum and Golgi apparatus (Fig. 1D).
FIGURE 1.

Confocal microscopy of HEK293 cells transfected with BiFC constructs. A, the N- and C-terminal halves of YFP were attached to the C-terminal end of 5-HT2C receptors and co-transfected (5-HT2C/N-YFP + 5-HT2C/C-YFP) into HEK293 cells. Plasma membrane YFP fluorescence, 20 h post-transfection, is shown in the first panel. The second panel shows the differential interference contrast microscopy image, and the third panel shows the fluorescence overlay on this image. Red scale bar, 10 μm. B, HEK 293 cells co-transfected with 5-HT2C/N-YFP + β2-adrenergic/C-YFP, imaged 20 h post-transfection. C, HEK293 cells co-transfected with β2-adrenergic/N-YFP + β2-adrenergic/C-YFP, imaged 20 h post-transfection. D, HEK293 cells co-transfected with 5-HT2C/N-YFP + 5-HT2C/C-YFP. Sixteen hours post-transfection, YFP fluorescence is observed in the endoplasmic reticulum/Golgi.
In transfected primary hippocampal neurons, 5-HT2C/YFP receptors are targeted to the plasma membrane of the cell body and along the axonal and dendritic membranes (Fig. 2). Endogenous 5-HT2C receptor expression in the hippocampus (occurring predominantly in CA3 and dentate gyrus) is low at postnatal day 3 (15% of maximal expression levels) but increases steadily over the subsequent 3 weeks of development (56). The cultures used in our study were isolated from fetal rats at gestational day 19 and were grown in culture for 1 day prior to the FCS experiments. Thus, it is unlikely that the neurons were expressing endogenous 5-HT2C receptors at the time of the FCS experiments.
FIGURE 2.

Confocal microscopy of an isolated rat hippocampal neuron transfected with 5-HT2C/YFP and maintained in culture for 1 day. The inset shows the upper plasma membrane of the cell body and the location (+) where an FCS recording was made. Red scale bar, 10 μm.
To determine the diffusion coefficient and oligomeric size of 5-HT2C receptors, FCS measurements were made on the upper plasma membrane of transfected hippocampal neurons (Fig. 2, inset) and HEK293 cells. When fluorescence-tagged 5-HT2C receptors, freely diffusing within the plasma membrane, enter the observation volume they are excited by the laser, and the resulting fluctuations in fluorescence intensity were recorded in real time (Fig. 3A). Autocorrelation analyses of the fluorescence fluctuations were performed using a non-linear least-squares fitting routine that graphically represents the autocorrelation function G(τ) on the ordinate and diffusion time on the abscissa (Fig. 3B). The diffusion of fluorescent 5-HT2C receptors within the plasma membrane is reported as the average dwell time (τD) of fluorescent 5-HT2C receptors within the observation volume and is calculated from the midpoint of the autocorrelation decay curve. The biphasic autocorrelation curves shown in Fig. 3B are best fit by a two-component model with a very fast component characteristic of the photophysical properties of the fluorescent probe (τD1) and a slower component representing the translational diffusion of the 5-HT2C receptor within the plasma membrane (τD2). For example, in HEK293 cells, the diffusion for 5-HT2C receptors tagged with GFP or mCherry (τD2) is the same, although the two probes have different photophysical properties and thus have different τD1 values. Residuals of the curve fit are shown in Fig. 3C.
FIGURE 3.
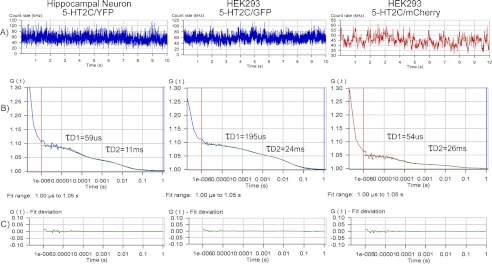
FCS recordings from the plasma membrane of hippocampal neurons expressing 5-HT2C/YFP and HEK293 cells expressing 5-HT2C/GFP or 5-HT2C/mCherry. A, fluorescence intensity traces for one 10-s observation period. B, biphasic FCS autocorrelation curves, generated from the intensity traces shown above. The blue line represents the autocorrelation of the observed fluorescence, and the green line represents the fit to a two-component model (for 5-HT2C/mCherry the colors are red and green, respectively). The fast component (measured in microseconds) is related to the photophysical properties of the fluorescent probe, whereas the slower component (measured in milliseconds) represents the diffusion of fluorescence-tagged receptors in the plasma membrane. The diffusion rates are calculated from the midpoint of the decay of the autocorrelation curve. C, residuals of the curve fit from the autocorrelation analysis. Dividing the average photon count rate (kHz) determined from the fluorescence intensity trace shown in A by the number of fluorescent molecules determined from the autocorrelation curve shown in B (calculated as in Equation 3, where G(0) = the y intercept at the 1 μs time point) predicts the average molecular brightness of the sample expressed as CPSM.
Diffusion coefficients obtained for fluorescence-tagged 5-HT2C receptors in hippocampal neurons and HEK293 cells are presented in Table 1. All diffusion data best fit a two-component model with τD1 values for photophysical properties ranging from 50 to 60 μs for YFP and mCherry to 230 μs for GFP and τD2 values ranging from 17 ms for 5-HT2C/YFP and the 5-HT2C/YFP BiFC pair to 25 ms for 5-HT2C/GFP and 26 ms for 5-HT2C/mCherry. The results for YFP-tagged 5-HT2C receptors are similar to literature values for YFP-tagged adenosine-A1 (18 ms) and bradykinin-BK2 (16 ms) receptors in CHO cells and HEK293 cells, respectively (57, 58). Because the diffusion coefficient is dependent on how long the fluorescent molecules are detected within the observation volume, it will be influenced by the photophysical characteristics of the fluorescent probe used to label the protein of interest. Different fluorescent probes have different photophysical properties, different rates of blinking on and off, and different photostability, quantum yield, and laser intensity for excitation, all of which will play a role in determining the apparent diffusion coefficient of the labeled protein (35).
TABLE 1.
Diffusion coefficients for fluorescence-tagged 5-HT2C receptors expressed on the plasma membrane of hippocampal neurons and HEK293 cells
FCS data were best fit by a two-component model with τD1 representing the photophysical properties of the fluorescent probe and τD2 the diffusion of receptors within the plasma membrane. Data represent the mean ± S.E. for the number of cells (n) as indicated
| τD1 | τD2 | Diffusion | n | |
|---|---|---|---|---|
| μs | ms | μm2/s | ||
| Hippocampal neurons | ||||
| 5-HT2C/YFP | 54.6 ± 3.0 | 10.2 ± 0.6 | 1.92 ± 0.11 | 20 |
| HEK293 cells | ||||
| 5-HT2C/YFP | 50.5 ± 2.9 | 16.9 ± 0.4 | 1.16 ± 0.03 | 20 |
| 5-HT2C/N-YFP + 5-HT2C/C-YFP BiFC | 58.6 ± 4.1 | 16.5 ± 0.9 | 1.19 ± 0.07 | 15 |
| 5-HT2C/GFP | 228 ± 6.5 | 25.4 ± 1.2 | 0.77 ± 0.04 | 20 |
| 5-HT2C/mCherry | 59.8 ± 4.1 | 25.9 ± 0.9 | 0.76 ± 0.03 | 15 |
Interestingly, the diffusion coefficient for 5-HT2C/YFP was slightly faster in hippocampal neurons than in HEK293 cells, suggestive of a more dynamic membrane environment in the hippocampal neurons. It is possible that there are differences between the cell types in terms of the cargo or proteins associated with 5-HT2C/YFP. Also, neuronal membranes are highly specialized in terms of being able to transport proteins long distances along axons and dendrites, properties not shared by HEK293 cells. Diffusion coefficients of sodium channels in neurons have been shown to be faster along the axon than at the axon initial segment (boundary between axon and soma), demonstrating heterogeneity of protein diffusion even within a neuron (59). Thus, it is not surprising that the diffusion coefficient of 5-HT2C receptors differed between HEK293 cells and hippocampal neurons.
The molecular brightness of a fluorescence-tagged protein can be determined from an FCS experiment by calculating the number of fluorescent molecules present in the observation volume (as in Equation 3) and then dividing the average count rate obtained from the fluorescence intensity trace by the number of fluorescent molecules. This analysis yields an estimate of the molecular brightness expressed as counts/second/molecule (CPSM). Molecular brightness values were determined for YFP- and GFP-tagged 5-HT2C receptors freely diffusing within the plasma membrane of hippocampal neurons and HEK293 cells using both FCS and PCH (Table 2). The molecular brightness of 5-HT2C/YFP in hippocampal neurons was 17,286 ± 1,257 CPSM, similar to 5-HT2C/YFP expressed in HEK293 cells (17,763 ± 1,057 CPSM). The molecular brightness of the 5-HT2C/YFP BiFC pair (9,466 ± 1,791 CPSM) was roughly half that observed for 5HT2C/YFP and was similar to monomeric YFP (9,403 ± 349 CPSM). For 5-HT2C/GFP, the molecular brightness was 17,751 ± 426 CPSM, which was similar to tandem GFP (19,294 ± 703 CPSM). Interestingly, the molecular brightness of 5-HT2C/GFP was reduced by half when co-expressed with a 3-fold excess of untagged 5-HT2C receptors (9,003 ± 314 CPSM) and was similar to monomeric GFP (9,266 ± 211 CPSM).
TABLE 2.
Molecular brightness of fluorescence-tagged 5-HT2C receptors expressed on the plasma membrane of hippocampal neurons and HEK293 cells
Molecular brightness values were calculated from the FCS data by dividing the average photon count rate (obtained from the fluorescence intensity trace) by the number of fluorescent molecules (derived from the autocorrelation function) and are expressed as CPSM. Molecular brightness determined by PCH was performed using the PCH module in the Zeiss Aim 4.2 software for a one-component model, and the resulting reduced χ2 value is reported. Data represent the mean ± S.E. for the number of cells indicated (n) from two or three independent transfection experiments.
| Molecular brightness (CPSM) |
n | |||
|---|---|---|---|---|
| FCS | PCH | χ2 | ||
| Hippocampal neurons | ||||
| 5-HT2C/YFP | 17,286 ± 1,257 | 17,184 ± 685 | 0.97 ± 0.06 | 20 |
| HEK293 cells | ||||
| 5-HT2C/YFP | 17,763 ± 1,057 | 17,836 ± 739 | 1.04 ± 0.04 | 15 |
| 5-HT2C/N-YFP + 5-HT2C/C-YFP BiFC | 9,466 ± 1,791 | 10,730 ± 745 | 1.08 ± 0.09 | 15 |
| Monomeric YFP | 9,403 ± 349 | 8,995 ± 458 | 1.06 ± 0.04 | 15 |
| HEK293 cells | ||||
| 5-HT2C/GFP | 17,751 ± 426 | 17,637 ± 502 | 1.12 ± 0.04 | 20 |
| 5-HT2C/GFP + 5-HT | 18,149 ± 1,074 | 17,768 ± 1,121 | 1.26 ± 0.15 | 10 |
| Tandem GFP | 19,294 ± 703 | 19,125 ± 598 | 1.09 ± 0.06 | 25 |
| 5-HT2C/GFP + 5-HT2C (1:3) | 9,003 ± 314 | 9,146 ± 367 | 1.15 ± 0.04 | 10 |
| Monomeric GFP | 9,266 ± 211 | 9,279 ± 202 | 1.03 ± 0.06 | 30 |
To determine the contribution of background autofluorescence from cytoplasmic proteins, a dilute solution (5 nm) of purified monomeric GFP was evaluated. The molecular brightness of GFP in solution (8,920 ± 114 CPSM) was similar to GFP expressed in the cytosol of HEK293 cells (9,266 ± 211 CPSM), indicating that background autofluorescence from cytoplasmic proteins was minimal (∼4%) in our experimental set-up.
PCH examines the amplitude of the fluctuations in fluorescence intensity recorded during an FCS experiment to provide an estimate of the average molecular brightness of all fluorescent species present in the observation volume. PCH can be used to determine the molecular brightness of a given fluorescent species or a mixture of fluorescent species and as such is a valuable tool for measuring protein oligomerization (40, 60). Fig. 4 shows the histograms for plasma membrane GFP-tagged 5-HT2C receptors as well as the tandem GFP control. For comparison, two cells with similar average count rates (110–120 kHz) were selected. The shape of the PCH is a function of the number of fluorescent molecules and their molecular brightness and was the same for the tandem GFP and 5-HT2C/GFP (Fig. 4). The PCH results for GFP- and YFP-tagged receptors and controls are shown in Table 2. The PCH results were the same as the results obtained with FCS analysis. Again, the molecular brightness of fluorescence-tagged 5-HT2C receptors was similar to the tandem GFP control, twice that of monomeric forms of GFP and YFP, and twice that of the BiFC pair and was reduced by half following co-expression with an excess of untagged 5-HT2C receptors. Reduced χ2 values for fitting the data to a one-component PCH model were close to unity.
FIGURE 4.

Photon counting histograms from FCS recordings made in the cytosol of HEK293 cells expressing a tandem, GFP-GFP dimeric construct (A) and the plasma membrane of HEK293 cells expressing 5-HT2C/GFP receptors (B). The inset shows the PCH on a linear scale. To generate a histogram, each 10-s fluorescence intensity trace (as illustrated in Fig. 3A) was broken down into 1 million 10-μs intervals or bins (PCH bin time = 10 μs). Histograms were constructed (using the PCH module in the Zeiss Aim 4.2 software) in which the number of 10-μs bins was plotted on the y axis, and photon counts were plotted on the x axis. The resulting histogram depicts the number of bins that registered 1,2,3 … n photon counts during one 10-s observation period. The histograms show the average number of photon counts per 10-μs bin time to be 1.24, equivalent to 124,000 counts/s. Dividing by the average number of molecules in the observation volume (7) yields an average molecular brightness of 17,714 CPSM. The residuals of the curve fit (shown in the lower panels) plot the number of bins on the y axis and photon counts on the x axis. The residuals show the deviation of the fit of the data to the selected model, providing a measure of how well the data fit the model. In this case, the data were fit to a one-component model for a single homogenous population of fluorescence-tagged receptors (i.e. dimers). The residuals of the curve fit are less than 2 S.D. values and are randomly distributed about 0, indicating that the data are a good fit for the selected model, with reduced χ2 equal to unity.
To determine the effect of 5-HT treatment on receptor diffusion rate and on molecular brightness, transfected cells expressing 5-HT2C/GFP were treated with 50 nm 5-HT for 1 min prior to FCS recording. There was no effect of 5-HT treatment on the plasma membrane diffusion rate of 5-HT2C/GFP and no change in molecular brightness of 5-HT2C/GFP following treatment with 5-HT (Table 2). These results are consistent with our previous observation that agonist and inverse agonist treatment has no effect on FRET efficiency (61).
To ensure that 5-HT2C receptors were activated in our experimental set-up, HEK293 cells co-expressing β-arrestin2/CFP and 5-HT2C/YFP were challenged with 5-HT. β-Arrestin recruitment to the plasma membrane occurred within 30 s following application of 50 nm 5-HT (Fig. 5), demonstrating that 5-HT2C receptors are activated in response to 50 nm 5-HT.
FIGURE 5.

Live cell time course of β-arrestin recruitment to the plasma membrane following activation of 5-HT2C receptors. HEK293 cells were co-transfected with β-arrestin2/CFP (shown in green) and 5-HT2C/YFP (shown in red). Images were recorded prior to treatment with 5-HT (t = 0) and 30 s (t = 30) and 90 s (t = 90) following application of 50 nm 5-HT. β-Arrestin is entirely cytosolic prior to 5-HT and appears co-localized with 5-HT2C receptors on the plasma membrane 30 s and 90 s after 5-HT treatment (yellow plasma membrane in the merged image).
DISCUSSION
FCS measures fluctuations in fluorescence intensity from individual fluorescent molecules or, in this case, fluorescence-tagged 5-HT2C receptors diffusing with the plasma membrane. This is accomplished by focusing a laser through a high numerical aperture objective onto a diffraction-limited region of plasma membrane to create an observation volume on the order of 10−15 liters. As the fluorescent molecules are excited by the laser, the fluctuations in fluorescence intensity are recorded in real time, providing quantitative information about diffusion, number, and brightness of the fluorescent molecules. Because the observation volume is not illuminated homogeneously, the detected photon counts decrease as a fluorescent molecule moves away from the center of the observation volume. Thus, optimal positioning within the center of the observation volume is critical for accurate molecular brightness determination of plasma membrane proteins. In the present study, FCS measurements were made on the upper plasma membrane of HEK293 cells or the hippocampal neuronal cell body, transfected with fluorescence-tagged 5-HT2C receptors. Positioning of the plasma membrane in the center of the observation volume was best achieved by scanning the sample along the z axis while simultaneously monitoring the photon counts per molecule. Three different fluorescent probes were used to ensure that the results obtained were not due to a unique photophysical property of the fluorescent probe and to determine reproducibility of results. GFP and mCherry produced nearly identical diffusion coefficents for 5-HT2C receptors, whereas the diffusion coefficient for YFP-tagged receptors was slightly faster. These results are similar to previously published diffusion coefficients for galanin, adenosine, and bradykinin receptors (30, 57, 58).
The diffusion rate of a membrane protein is related to the cubic root of the mass of the protein, such that an 8-fold change in a protein's mass would be required to produce a 2-fold change in the diffusion rate. It should be noted that the limit of resolution of the FCS technique is such that the diffusion rates of two proteins must differ by a factor of 1.6 or greater in order to be resolved by FCS (62). Therefore, diffusion rates cannot be used to differentiate between monomers, dimers, or tetramers of a given protein.
Information about a protein's oligomer status can be extracted by analyzing the amplitude of the fluctuations in fluorescence intensity obtained in an FCS experiment. PCH analysis uses the information encoded in the amplitude of the autocorrelation function to determine the average molecular brightness of the fluorescent molecules (40). PCH provides quantitative information about the number of fluorescent molecules and the number of photon counts per molecule. PCH analysis uses a three-dimensional Gaussian approximation of the laser beam profile and Poisson statistics to predict what the molecular brightness of the fluorescent particle would be when it is at the center of the observation volume (40). The molecular brightness is proportional to the number of fluorescent molecules traveling together within a protein complex. Thus, if a receptor monomer with a single fluorescent tag has a molecular brightness of x, then the molecular brightness of a receptor dimer carrying two fluorescent tags would be 2x, a tetramer would be 4x, and so forth. FCS and PCH report the average molecular brightness of all fluorescent species present in the sample. Thus, if a sample contained a mixture of two species of differing brightness (e.g. monomers and dimers in equilibrium), the brightness value would be an average based on the proportion of each species in the mixture (60).
Several different approaches were used to establish the molecular brightness of YFP and GFP monomers and dimers to serve as controls for determining the oligomeric state of 5-HT2C receptors. To determine the molecular brightness of a monomer, HEK293 cells were transfected with plasmids containing monomeric GFP or YFP, and FCS/PCH measurements were made within the cytosol of transfected cells. In a similar manner, the molecular brightness of a dimer was determined in HEK293 cells transfected with a plasmid containing two GFPs linked together in tandem. BiFC between the N-terminal and C-terminal halves of YFP attached to the 5-HT2C receptor was employed as an additional method to confirm 5-HT2C receptor dimerization and as a control in the FCS/PCH studies. Co-expression of 5-HT2C/N-YFP and 5-HT2C/C-YFP resulted in successful recombination of YFP and reconstitution of plasma membrane fluorescence, suggestive of 5-HT2C receptor dimerization. FCS and PCH measurements made on the plasma membrane of HEK293 cells co-expressing the 5-HT2C/N-YFP + 5-HT2C/C-YFP BiFC pair would be expected to yield a molecular brightness approximately half that observed for 5-HT2C/YFP receptors. If 5-HT2C receptors are predominantly dimers, then the molecular brightness of the BiFC pair should be similar to the monomeric YFP control. If 5-HT2C receptors form tetramers and higher order oligomers, then the molecular brightness of the BiFC pair would be predicted to be greater than monomeric YFP. As presented in Table 2, the molecular brightness of the BiFC pair was half that of 5-HT2C/YFP and similar to that of monomeric YFP. Thus, the result of the BiFC experiment is consistent with a dimeric structure of the 5-HT2C receptor.
To confirm and validate these results, an additional control was added wherein HEK293 cells were co-transfected with 5-HT2C/GFP and a 3-fold excess of untagged 5-HT2C receptor. If 5-HT2C receptors are monomeric, then this co-transfection experimental design would have no effect on the observed molecular brightness of 5-HT2C/GFP. However, if 5-HT2C receptors are dimeric, then this experimental design would result in the formation of 5-HT2C dimers in which only one protomer of the dimer has a GFP tag, and the resulting molecular brightness would be half that observed for cells transfected with 5-HT2C/GFP alone. If 5-HT2C/GFP receptors form tetramers, then co-expression with a 3-fold excess of untagged 5-HT2C receptor would be predicted to reduce the molecular brightness by greater than 50%. Additionally, if 5-HT2C receptors exist as an equal mixture of monomers and dimers, then the molecular brightness would be predicted to be reduced by one-third, following co-expression with an excess of untagged receptor. The results presented in Table 2 show that co-expression with excess untagged 5-HT2C receptor reduced the molecular brightness to half that observed for 5-HT2C/GFP alone. Again, these results are consistent with a dimeric structure for the 5-HT2C receptor.
GPCR dimer/oligomer studies performed in recombinant cell systems have been criticized for high protein expression levels that are non-physiological and could possibly promote GPCR aggregation. Also, it has been reported that high concentrations of GFP or YFP can promote self-assembly to form dimers/oligomers (63). Such conditions could lead to erroneous conclusions about the oligomeric size of GFP- and YFP-tagged receptors. One of the main advantages of the FCS/PCH technique is that it requires very low protein expression levels. The ability to monitor or track changes in fluorescence intensity as individual fluorescent molecules enter and leave the observation volume is dependent upon having very few molecules within the observation volume at any given time. As the concentration of fluorescent molecules increases, the ability to detect a significant change in fluorescence intensity as another molecule enters the observation volume is dramatically reduced. Therefore, low receptor expression levels are required in order to make valid FCS/PCH measurements. In addition, we employed an A206K mutation in the GFP tags, previously shown to eliminate GFP aggregation (50). Therefore, the possibility of nonspecific receptor aggregation due to high expression levels and self-assembly of fluorescent tags has been eliminated in the present study.
The results of our BiFC studies provide evidence for GPCR dimer formation during receptor biosynthesis in the endoplasmic reticulum/Golgi, consistent with our previous findings using FRET (11). Mutagenesis studies suggest that GPCR dimerization may be necessary for exit from the endoplasmic reticulum/Golgi and trafficking to the plasma membrane (12, 13). If this is in fact the case, then GPCR monomers would not traffic to the plasma membrane, and the only way to have monomeric GPCR would be for dimers to dissociate into monomers once they reach the plasma membrane.
Recent studies using TIRF imaging of M1 muscarinic and formyl peptide receptors have suggested that dimers dissociate into monomers on the plasma membrane and exist in a monomer-dimer equilibrium (24, 25). However, the limit of resolution of TIRF imaging exceeds the dimensions of an individual GPCR. In the present study, if 5-HT2C receptors exist as a mixture of monomers and dimers, then the FCS/PCH results would have produced molecular brightness values that were between the values for the monomeric and dimeric controls because PCH provides an estimate of the average molecular brightness of all fluorescent species present in the sample. Müller et al. (60) tested the sensitivity of the PCH method to resolve a mixture of two fluorescent species. They found an optimal ratio of 83% of the dimmer species and 17% of the brighter species for resolving the two species using a two-component PCH model with reduced χ2 equal to unity (60). In our experiments, two-component PCH models testing for the presence of a mixture of monomers and dimers or dimers and tetramers did not provide a better fit of the data than the one-component PCH model. Reduced χ2 values for the goodness of fit to a one-component PCH model were close to unity, indicating that the data were best described by a model predicting dimers and not a mixture of monomers and dimers or of dimers and tetramers. Sophisticated RET approaches and FRAP have been applied to detect the presence of higher order GPCR oligomers (22, 23, 64). Although these studies have concluded that GPCR form tetramers, results of the TIRF imaging studies (24, 25) and our FCS/PCH results do not support this conclusion.
Although there is a large body of evidence suggesting that class A GPCR may form and function as dimers/oligomers, there is no consensus as to their oligomeric size. Previous studies using co-immunoprecipitation, RET, TIRF, and FRAP have produced conflicting results, even within the same subfamily of GPCR. For example, muscarinic receptors have been reported to be monomers (24), dimers (65, 66), and tetramers (22, 63). Similarly, β-adrenergic receptors have been reported to be monomers (67), dimers (18), and higher order oligomers (21, 64). In part, these conflicting results may be due to differences in the methods employed, variations in the sensitivity of the methods, and/or interpretation of the results. The application of live cell methods with single molecule sensitivity, such as FCS and PCH, should be helpful in resolving this issue.
In conclusion, FCS with confocal microscopy provides a powerful method with single molecule sensitivity for determining the number and molecular brightness of fluorescence-tagged proteins as a measure of their oligomer size. In the present study, FCS and PCH brightness analyses yielded identical results. In HEK293 cells and hippocampal neurons, the molecular brightness of YFP-tagged 5-HT2C receptors was twice that of the BiFC pair and monomeric YFP. The molecular brightness of GFP-tagged 5-HT2C receptors was twice that of monomeric GFP and similar to that of tandem GFP. Our data for plasma membrane 5-HT2C receptors were adequately described by a one-component PCH model, for a single fluorescent species, with reduced χ2 equal to unity. Therefore, the hypothesis that 5-HT2C receptors exist as a mixture of monomers and dimers or of dimers and tetramers is rejected. The FCS/PCH data are best described by a model in which the mobile fraction of plasma membrane 5-HT2C receptors exists as homodimers. The dimeric structure was preserved following 5-HT binding and receptor activation, suggesting that the dimer may represent the basic signaling unit for GPCR. For 5-HT2C, 5-HT4, and 5-HT7 receptors, binding to both protomers of the dimer is suggested to be required for maximal activation (8–10). Thus, it is possible that bivalent ligands may have therapeutic potential.
This work was supported, in whole or in part, by National Institutes of Health Grant R21MH086796 (to K. H. D.).
- GPCR
- G-protein-coupled receptor
- 5-HT
- 5-hydroxytryptamine
- RET
- resonance energy transfer
- BiFC
- bimolecular fluorescence complementation
- TIRF
- total internal reflection fluorescence imaging
- FCS
- fluorescence correlation spectroscopy
- PCH
- photon counting histogram
- MEM
- minimum Eagle's medium
- PSF
- point spread function
- CPSM
- counts/second/molecule.
REFERENCES
- 1. Bayburt T. H., Leitz A. J., Xie G., Oprian D. D., Sligar S. G. (2007) Transducin activation by nanoscale lipid bilayers containing one and two rhodopsins. J. Biol. Chem. 282, 14875–14881 [DOI] [PubMed] [Google Scholar]
- 2. Whorton M. R., Bokoch M. P., Rasmussen S. G., Huang B., Zare R. N., Kobilka B., Sunahara R. K. (2007) A monomeric G protein-coupled receptor isolated in a high density lipoprotein particle efficiently activates its G protein. Proc. Natl. Acad. Sci. U.S.A. 104, 7682–7687 [DOI] [PMC free article] [PubMed] [Google Scholar]
- 3. Rocheville M., Lange D. C., Kumar U., Sasi R., Patel R. C., Patel Y. C. (2000) Subtypes of the somatostatin receptor assemble as functional homo- and heterodimers. J. Biol. Chem. 275, 7862–7869 [DOI] [PubMed] [Google Scholar]
- 4. Chabre M., le Maire M. (2005) Monomeric G-protein-coupled receptor as a functional unit. Biochemistry 44, 9395–9403 [DOI] [PubMed] [Google Scholar]
- 5. Meyer B. H. (2006) FRET imaging reveals that functional neurokinin-1 receptors are monomeric and reside in membrane microdomains of live cells. Proc. Natl. Acad. Sci. U.S.A. 103, 2138–2143 [DOI] [PMC free article] [PubMed] [Google Scholar]
- 6. Fotiadis D., Jastrzebska B., Philippsen A., Müller D. J., Palczewski K., Engel A. (2006) Structure of the rhodopsin dimer. A working model for G-protein-coupled receptors. Curr. Opin. Struct. Biol. 16, 252–259 [DOI] [PubMed] [Google Scholar]
- 7. Albizu L., Cottet M., Kralikova M., Stoev S., Seyer R., Brabet I., Roux T., Bazin H., Bourrier E., Lamarque L., Breton C., Rives M. L., Newman A., Javitch J., Trinquet E., Manning M., Pin J. P., Mouillac B., Durroux T. (2010) Time-resolved FRET between GPCR ligands reveals oligomers in native tissues. Nat. Chem. Biol. 6, 587–594 [DOI] [PMC free article] [PubMed] [Google Scholar]
- 8. Teitler M., Klein M. T. (2012) A new approach for studying GPCR dimers. Drug-induced inactivation and reactivation to reveal GPCR dimer function in vitro, in primary culture, and in vivo. Pharmacol. Ther. 133, 205–217 [DOI] [PMC free article] [PubMed] [Google Scholar]
- 9. Herrick-Davis K., Grinde E., Harrigan T. J., Mazurkiewicz J. E. (2005) Inhibition of serotonin 5-hydroxytryptamine 2c receptor function through heterodimerization. Receptor dimers bind two molecules of ligand and one G-protein. J. Biol. Chem. 280, 40144–40151 [DOI] [PubMed] [Google Scholar]
- 10. Pellissier L. P., Barthet G., Gaven F., Cassier E., Trinquet E., Pin J. P., Marin P., Dumuis A., Bockaert J., Banères J. L., Claeysen S. (2011) G protein activation by serotonin type 4 receptor dimers. Evidence that turning on two protomers is more efficient. J. Biol. Chem. 286, 9985–9997 [DOI] [PMC free article] [PubMed] [Google Scholar]
- 11. Herrick-Davis K., Weaver B. A., Grinde E., Mazurkiewicz J. E. (2006) Serotonin 5-HT2C receptor homodimer biogenesis in the endoplasmic reticulum. Real-time visualization with confocal fluorescence resonance energy transfer. J. Biol. Chem. 281, 27109–27116 [DOI] [PubMed] [Google Scholar]
- 12. Salahpour A., Angers S., Mercier J. F., Lagace M., Marillo S., Bouvier M. (2004) Homodimerization of the beta2-adrenergic receptor as a prerequisite for cell surface targeting. J. Biol. Chem. 279, 33390–33397 [DOI] [PubMed] [Google Scholar]
- 13. Lopez-Gimenez J. F., Canals M., Pediani J. D., Milligan G. (2007) The α1b-adrenoceptor exists as a higher-order oligomer. Effective oligomerization is required for receptor maturation, surface delivery, and function. Mol. Pharmacol. 71, 1015–1029 [DOI] [PubMed] [Google Scholar]
- 14. Milligan G. (2004) G protein-coupled receptor dimerization. Function and ligand pharmacology. Mol. Pharmacol. 66, 1–7 [DOI] [PubMed] [Google Scholar]
- 15. Jones K. A., Borowsky B., Tamm J. A., Craig D. A., Durkin M. M., Dai M., Yao W. J., Johnson M., Gunwaldsen C., Huang L. Y., Tang C., Shen Q., Salon J. A., Morse K., Laz T., Smith K. E., Nagarathnam D., Noble S. A., Branchek T. A., Gerald C. (1998) GABAB receptors function as a heteromeric assembly of the subunits GABABR1 and GABABR2. Nature 396, 674–679 [DOI] [PubMed] [Google Scholar]
- 16. Kaupmann K., Malitschek B., Schuler V., Heid J., Froestl W., Beck P., Mosbacher J., Bischoff S., Kulik A., Shigemoto R., Karschin A., Bettler B. (1998) GABAB-receptor subtypes assemble into functional heteromeric complexes. Nature 396, 683–687 [DOI] [PubMed] [Google Scholar]
- 17. White J. H., Wise A., Main M. J., Green A., Fraser N. J., Disney G. H., Barnes A. A., Emson P., Foord S. M., Marshall F. H. (1998) Heterodimerization is required for the formation of a functional GABAB receptor. Nature 396, 679–682 [DOI] [PubMed] [Google Scholar]
- 18. Mercier J. F., Salahpour A., Angers S., Breit A., Bouvier M. (2002) Quantitative assessment of β1- and β2-adrenergic receptor homo- and heterodimerization by bioluminescence resonance energy transfer. J. Biol. Chem. 277, 44925–44931 [DOI] [PubMed] [Google Scholar]
- 19. Canals M., Burgueño J., Marcellino D., Cabello N., Canela E. I., Mallol J., Agnati L., Ferré S., Bouvier M., Fuxe K., Ciruela F., Lluis C., Franco R. (2004) Homodimerization of adenosine A2A receptors. Qualitative and quantitative assessment by fluorescence and bioluminescence energy transfer. J. Neurochem. 88, 726–734 [DOI] [PubMed] [Google Scholar]
- 20. Harikumar K. G., Happs R. M., Miller L. J. (2008) Dimerization in the absence of higher order oligomerization of the G protein-coupled secretin receptor. Biochim. Biophys. Acta 1778, 2555–2563 [DOI] [PMC free article] [PubMed] [Google Scholar]
- 21. Fung J. J., Deupi X., Pardo L., Yao X. J., Velez-Ruiz G. A., Devree B. T., Sunahara R. K., Kobilka B. K. (2009) Ligand-regulated oligomerization of β2-adrenoceptors in a model lipid bilayer. EMBO J. 28, 3315–3328 [DOI] [PMC free article] [PubMed] [Google Scholar]
- 22. Pisterzi L. F., Jansma D. B., Georgiou J., Woodside M. J., Chou J. T., Angers S., Raicu V., Wells J. W. (2010) Oligomeric size of the m2 muscarinic receptor in live cells as determined by quantitative fluorescence resonance energy transfer. J. Biol. Chem. 285, 16723–16738 [DOI] [PMC free article] [PubMed] [Google Scholar]
- 23. Guo W., Urizar E., Kralikova M., Mobarec J. C., Shi L., Filizola M., Javitch J. A. (2008) Dopamine D2 receptors form higher order oligomers at physiological expression levels. EMBO J. 27, 2293–2304 [DOI] [PMC free article] [PubMed] [Google Scholar]
- 24. Hern J. A., Baig A. H., Mashanov G. I., Birdsall B., Corrie J. E., Lazareno S., Molloy J. E., Birdsall N. J. (2010) Formation and dissociation of M1 muscarinic receptor dimers seen by total internal reflection fluorescence imaging of single molecules. Proc. Natl. Acad. Sci. U.S.A. 107, 2693–2698 [DOI] [PMC free article] [PubMed] [Google Scholar]
- 25. Kasai R. S., Suzuki K. G., Prossnitz E. R., Koyama-Honda I., Nakada C., Fujiwara T. K., Kusumi A. (2011) Full characterization of GPCR monomer-dimer dynamic equilibrium by single molecule imaging. J. Cell Biol. 192, 463–480 [DOI] [PMC free article] [PubMed] [Google Scholar]
- 26. Magde D., Elson E., Webb W. W. (1972) Thermodynamic fluctuations in a reacting system. Measurement by fluorescence correlation spectroscopy. Phys. Rev. Lett. 29, 705–708 [Google Scholar]
- 27. Elson E. L., Magde D. (1974) Fluorescence correlation spectroscopy. I. Conceptual basis and theory. Biopolymers 13, 1–27 [DOI] [PubMed] [Google Scholar]
- 28. Qian H., Elson E. L. (1991) Analysis of confocal laser-microscope optics for three-dimensional fluorescence correlation spectroscopy. Appl. Opt. 30, 1185–1195 [DOI] [PubMed] [Google Scholar]
- 29. Rigler R., Mets U., Widengren J., Kask P. (1993) Fluorescence correlation sepctroscopy with high count rate and low background. Analysis of translational diffusion. Eur. Biophys. J. 22, 169–175 [Google Scholar]
- 30. Pramanik A., Olsson M., Langel U., Bartfai T., Rigler R. (2001) Fluorescence correlation spectroscopy detects galanin receptor diversity on insulinoma cells. Biochemistry 40, 10839–10845 [DOI] [PubMed] [Google Scholar]
- 31. Bacia K., Schwille P. (2003) A dynamic view of cellular processes by in vivo fluorescence auto- and cross-correlation spectroscopy. Methods 29, 74–85 [DOI] [PubMed] [Google Scholar]
- 32. Digman M. A., Brown C. M., Sengupta P., Wiseman P. W., Horwitz A. R., Gratton E. (2005) Measuring fast dynamics in solutions and cells with a laser-scanning microscope. Biophys. J. 89, 1317–1327 [DOI] [PMC free article] [PubMed] [Google Scholar]
- 33. Unruh J. R., Gratton E. (2008) Analysis of molecular concentration and brightness from fluorescence fluctuation data with an electron multiplied CCD camera. Biophys. J. 95, 5385–5398 [DOI] [PMC free article] [PubMed] [Google Scholar]
- 34. Fogarty K. H., Chen Y., Grigsby I. F., Macdonald P. J., Smith E. M., Johnson J. L., Rawson J. M., Mansky L. M., Mueller J. D. (2011) Characterization of cytoplasmic Gag-gag interactions by dual-color z-scan fluorescence fluctuation spectroscopy. Biophys. J. 16, 1587–1595 [DOI] [PMC free article] [PubMed] [Google Scholar]
- 35. Briddon S. J., Hill S. J. (2007) Pharmacology under the microscope. The use of fluorescence correlation spectroscopy to determine the properties of ligand-receptor complexes. Trends Pharmacol. Sci. 28, 637–645 [DOI] [PMC free article] [PubMed] [Google Scholar]
- 36. Patel R. C., Kumar U., Lamb D. C., Eid J. S., Rocheville M., Grant M., Rani A., Hazlett T., Patel S. C., Gratton E., Patel Y. C. (2002) Ligand binding to somatostatin receptors induces receptor-specific oligomer formation in live cells. Proc. Natl. Acad. Sci. U.S.A. 99, 3294–3299 [DOI] [PMC free article] [PubMed] [Google Scholar]
- 37. Liu P., Sudhaharan T., Koh R. M., Hwang L. C., Ahmed S., Maruyama I. N., Wohland T. (2007) Investigation of the dimerization of proteins from the epidermal growth factor receptor family by single wavelength fluorescence cross-correlation spectroscopy. Biophys. J. 93, 684–698 [DOI] [PMC free article] [PubMed] [Google Scholar]
- 38. Neugart F., Zappe A., Buk D. M., Ziegler I., Steinert S., Schumacher M., Schopf E., Bessey R., Wurster K., Tietz C., Börsch M., Wrachtrup J., Graeve L. (2009) Detection of ligand-induced CNTF receptor dimers in living cells by fluorescence cross-correlation spectroscopy. Biochim. Biophys. Acta 1788, 1890–1900 [DOI] [PubMed] [Google Scholar]
- 39. Savatier J., Jalaguier S., Ferguson M. L., Cavallès V., Royer C. A. (2010) Estrogen receptor interactions and dynamics monitored in live cells by fluorescence cross-correlation spectroscopy. Biochemistry 49, 772–781 [DOI] [PubMed] [Google Scholar]
- 40. Chen Y., Müller J. D., So P. T., Gratton E. (1999) The photon counting histogram in fluorescence fluctuation spectroscopy. Biophys. J. 77, 553–567 [DOI] [PMC free article] [PubMed] [Google Scholar]
- 41. Chen Y., Wei L. N., Müller J. D. (2003) Probing protein oligomerization in living cells with fluorescence fluctuation spectroscopy. Proc. Natl. Acad. Sci. U.S.A. 100, 15492–15497 [DOI] [PMC free article] [PubMed] [Google Scholar]
- 42. Saffarian S., Li Y., Elson E. L., Pike L. J. (2007) Oligomerization of the EGF receptor investigated by live cell fluorescence intensity distribution analysis. Biophys. J. 93, 1021–1031 [DOI] [PMC free article] [PubMed] [Google Scholar]
- 43. Malengo G., Andolfo A., Sidenius N., Gratton E., Zamai M., Caiolfa V. R. (2008) Fluorescence correlation spectroscopy and photon counting histogram on membrane proteins. Functional dynamics of the glycosylphosphatidylinositol-anchored urokinase plasminogen activator receptor. J. Biomed. Opt. 13, 031215 [DOI] [PMC free article] [PubMed] [Google Scholar]
- 44. Ross J. A., Digman M. A., Wang L., Gratton E., Albanesi J. P., Jameson D. M. (2011) Oligomerization state of dynamin 2 in cell membranes using TIRF and number and brightness analysis. Biophys. J. 100, L15–L17 [DOI] [PMC free article] [PubMed] [Google Scholar]
- 45. Pompeiano M., Palacios J. M., Mengod G. (1994) Distribution of the serotonin 5-HT2 receptor family mRNAs. Comparison between 5-HT2A and 5-HT2C receptors. Brain Res. Mol. Brain Res. 23, 163–178 [DOI] [PubMed] [Google Scholar]
- 46. Bubar M. J., Stutz S. J., Cunningham K. A. (2011) 5-HT2C receptors localize to dopamine and GABA neurons in the rat mesoaccumbens pathway. PLoS One 6, e20508. [DOI] [PMC free article] [PubMed] [Google Scholar]
- 47. Berg K. A., Clarke W. P., Cunningham K. A., Spampinato U. (2008) Fine-tuning serotonin2c receptor function in the brain: molecular and functional implications. Neuropharmacol. 55, 969–976 [DOI] [PMC free article] [PubMed] [Google Scholar]
- 48. Jensen N. H., Cremers T. I., Sotty F. (2010) Therapeutic potential of 5-HT2C receptor ligands. ScientificWorldJournal 10, 1870–1885 [DOI] [PMC free article] [PubMed] [Google Scholar]
- 49. Mancia F., Assur Z., Herman A. G., Siegel R., Hendrickson W. A. (2008) Ligand sensitivity in dimeric associations of the serotonin 5HT2c receptor. EMBO Rep. 9, 363–369 [DOI] [PMC free article] [PubMed] [Google Scholar]
- 50. Zacharias D. A., Violin J. D., Newton A. C., Tsien R. Y. (2002) Partitioning of lipid-modified monomeric GFPs into membrane microdomains of live cells. Science 296, 913–916 [DOI] [PubMed] [Google Scholar]
- 51. Sanders-Bush E., Breeding M. (1990) Serotonin1c receptor reserve in choroid plexus masks receptor subsensitivity. J. Pharmacol. Exp. Ther. 252, 984–988 [PubMed] [Google Scholar]
- 52. Kaech S., Banker G. (2006) Culturing hippocampal neurons. Nat. Protocols 1, 2406–2415 [DOI] [PubMed] [Google Scholar]
- 53. Adler J., Shevchuk A. I., Novak P., Korchev Y. E., Parmryd I. (2010) Plasma membrane topography and interpretation of single-particle tracks. Nat. Methods 7, 170–171 [DOI] [PubMed] [Google Scholar]
- 54. Macdonald P. J., Chen Y., Wang X., Chen Y., Mueller J. D. (2010) Brightness analysis by Z-scan fluorescence fluctuation spectroscopy for the study of protein interactions within living cells. Biophys. J. 99, 979–988 [DOI] [PMC free article] [PubMed] [Google Scholar]
- 55. Herrick-Davis K., Grinde E., Mazurkiewicz J. E. (2004) Biochemical and biophysical characterization of serotonin 5-HT2C receptor homodimers on the plasma membrane of living cells. Biochemistry 43, 13963–13971 [DOI] [PubMed] [Google Scholar]
- 56. Li Q. H., Nakadate K., Tanaka-Nakadate S., Nakatsuka D., Cui Y., Watanabe Y. (2004) Unique expression patterns of 5-HT2A and 5-HT2C receptors in the rat brain during postnatal development. Western blot and immunohistochemical analyses. J. Comp. Neurol. 469, 128–140 [DOI] [PubMed] [Google Scholar]
- 57. Briddon S. J., Gandía J., Amaral O. B., Ferré S., Lluís C., Franco R., Hill S. J., Ciruela F. (2008) Plasma membrane diffusion of G protein-coupled receptor oligomers. Biochim. Biophys. Acta 1783, 2262–2268 [DOI] [PubMed] [Google Scholar]
- 58. Philip F., Sengupta P., Scarlata S. (2007) Signaling through a G protein-coupled receptor and its corresponding G protein follows a stoichiometrically limited model. J. Biol. Chem. 282, 19203–19216 [DOI] [PubMed] [Google Scholar]
- 59. Winckler B., Forscher P., Mellman I. (1999) A diffusion barrier maintains distribution of membrane proteins in polarized neurons. Nature 397, 698–701 [DOI] [PubMed] [Google Scholar]
- 60. Müller J. D., Chen Y., Gratton E. (2000) Resolving heterogeneity on the single molecular level with the photon-counting histogram. Biophys. J. 78, 474–486 [DOI] [PMC free article] [PubMed] [Google Scholar]
- 61. Herrick-Davis K., Grinde E., Weaver B. A. (2007) Serotonin 5-HT2C receptor homodimerization is not regulated by agonist or inverse agonist treatment. Eur. J. Pharmacol. 568, 45–53 [DOI] [PMC free article] [PubMed] [Google Scholar]
- 62. Meseth U., Wohland T., Rigler R., Vogel H. (1999) Resolution of fluorescence correlation measurements. Biophys. J. 76, 1619–1631 [DOI] [PMC free article] [PubMed] [Google Scholar]
- 63. Yang F., Moss L. G., Phillips G. N. (1996) The molecular structure of green fluorescent protein. Nat. Biotechnol. 14, 1246–1251 [DOI] [PubMed] [Google Scholar]
- 64. Dorsch S., Klotz K. N., Engelhardt S., Lohse M. J., Bünemann M. (2009) Analysis of receptor oligomerization by FRAP microscopy. Nat. Methods 6, 225–230 [DOI] [PubMed] [Google Scholar]
- 65. Goin J. C., Nathanson N. M. (2006) Quantitative analysis of muscarinic acetylcholine receptor homo- and heterodimerization in live cells. Regulation of receptor down-regulation by heterodimerization. J. Biol. Chem. 281, 5416–5425 [DOI] [PubMed] [Google Scholar]
- 66. McMillin S. M., Heusel M., Liu T., Costanzi S., Wess J. (2011) Structural basis of M3 muscarinic receptor dimer/oligomer formation. J. Biol. Chem. 286, 28584–28598 [DOI] [PMC free article] [PubMed] [Google Scholar]
- 67. James J. R., Oliveira M. I., Carmo A. M., Iaboni A., Davis S. J. (2006) A rigorous experimental framework for detecting protein oligomerization using bioluminescence resonance energy transfer. Nat. Methods 3, 1001–1006 [DOI] [PubMed] [Google Scholar]