

Background: Self-assembly of the tubulin-homologue FtsZ is critical in bacterial cell division.
Results: Dynamic light scattering (DLS) measurements provide insight into the kinetics and stable length of Caulobacter crescentus FtsZ in vitro.
Conclusion: C. crescentus FtsZ forms short linear polymers in solution with the assembly rate depending on the concentrations of GTP and GDP.
Significance: DLS is a valuable technique for studying the polymerization of cytoskeletal proteins.
Keywords: Bacteria, Cytoskeleton, Dynamic Light Scattering, Electron Microscopy (EM), Protein Self-assembly, Caulobacter crescentus, FtsZ, PC190723
Abstract
The self-assembly of the tubulin homologue FtsZ at the mid-cell is a critical step in bacterial cell division. We introduce dynamic light scattering (DLS) spectroscopy as a new method to study the polymerization kinetics of FtsZ in solution. Analysis of the DLS data indicates that the FtsZ polymers are remarkably monodisperse in length, independent of the concentrations of GTP, GDP, and FtsZ monomers. Measurements of the diffusion coefficient of the polymers demonstrate that their length is remarkably stable until the free GTP is consumed. We estimated the mean size of the FtsZ polymers within this interval of stable length to be between 9 and 18 monomers. The rates of FtsZ polymerization and depolymerization are likely influenced by the concentration of GDP, as the repeated addition of GTP to FtsZ increased the rate of polymerization and slowed down depolymerization. Increasing the FtsZ concentration did not change the size of FtsZ polymers; however, it increased the rate of the depolymerization reaction by depleting free GTP. Using transmission electron microscopy we observed that FtsZ forms linear polymers in solutions which rapidly convert to large bundles upon contact with surfaces at time scales as short as several seconds. Finally, the best studied small molecule that binds to FtsZ, PC190723, had no stabilizing effect on Caulobacter crescentus FtsZ filaments in vitro, which complements previous studies with Escherichia coli FtsZ and confirms that this class of small molecules binds Gram-negative FtsZ weakly.
Introduction
FtsZ is a widely conserved protein that is found in many species of Eubacteria, Archaea, and higher plants (1–6). FtsZ plays an important role in cell division in bacteria (7). During division, it forms polymers that assemble into a ring-like structure (the “Z-ring”) at the division plane (8–12). The Z-ring lines the inner face of the cytoplasmic membrane and guides the localization of other cell division proteins to establish the site of division and to initiate cytokinesis (3, 13, 14). The assembly of FtsZ polymers is triggered by binding to GTP (15). FtsZ polymerization is dynamic and terminates once free GTP is hydrolyzed to GDP (16).
As the earliest identified prokaryotic cytoskeletal protein (9), FtsZ has been widely studied by the bacterial cell biology community, yet its polymer structure and in vivo mechanism of action are still not understood in detail. Real-time measurements of the kinetics of FtsZ polymerization and depolymerization may provide important mechanistic insight into the role of this protein in bacterial cell division.
FtsZ homologues from different organisms share significant structural similarity yet have different biochemical and biophysical properties (17–19). For example, the small molecule PC190723 stabilizes FtsZ filaments from Staphylococcus aureus and Bacillus subtilis but not from Escherichia coli (17). It has been proposed that the reduced antibiotic activity of this compound against Gram-negative bacteria arises from its weak binding to FtsZ in Gram-negative organisms.
In this paper, we use dynamic light scattering (DLS)3 to study the polymerization kinetics of FtsZ from Caulobacter crescentus, a Gram-negative bacterium that due to its unique biphasic life cycle and asymmetric cell division has developed into a model organism for cell biological studies (18). The C. crescentus cell carries a single, polar flagellum during the swarmer phase. After differentiation into a stalked cell, division produces a cell containing a flagellum and a daughter cell with a stalk. We anticipate that studies of the polymerization of C. crescentus FtsZ will enhance our understanding of Z-ring formation and cell division in this bacterium.
DLS is a technique used to determine the distribution of the size of nucleotides and proteins (20) through the temporal correlation of the fluctuating intensity of scattered light (21). We anticipated that DLS could provide quantitative data on the kinetics of FtsZ polymerization and depolymerization in vitro that are not measurable with many other techniques that are often used to study protein assembly, including static light scattering (SLS) (22–24), transmission electron microscopy (TEM) (16), and atomic force microscopy (AFM) (25). SLS encompasses both single angle light scattering and multiangle light scattering. Single angle light scattering measures the increase of the intensity of scattered light during polymerization, but this signal does not convey information about the order of polymerization of FtsZ polymers (23). Multiangle light scattering can be used to detect protein assembly by monitoring the molecular mass of the resulting filaments (24). It is best combined with off-line molecule fractionation techniques, such as capillary hydrodynamic chromatography and field flow fractionation methods, to resolve not only the average molecular mass of the assemblies but also their distribution (26). TEM (16) and AFM (25) have been used to measure the length of FtsZ polymers adsorbed on surfaces. However, surface contact may enhance polymerization and bundle formation, so that the observed FtsZ filaments may not represent the actual length of polymers suspended in bulk fluids or in the cell (27). Hence, it would be helpful to supplement AFM and TEM studies of FtsZ with techniques that provide dynamic information. In this paper we describe the first analysis of C. crescentus FtsZ structure and dynamics using DLS and demonstrate the capabilities of this biophysical technique for studying self-assembling proteins in vitro.
MATERIALS AND METHODS
Reagents
C. crescentus FtsZ was overproduced and purified as described previously (18). We determined the concentration of FtsZ via a BCA assay using an Ocean Optics USB 2000+ spectrometer and a BCA assay kit from Sigma-Aldrich. GTP and GDP were from Sigma-Aldrich. PC190723 (C14H8ClF2N3O2S, molecular mass = 355.75) was synthesized according to a previously published protocol (28). PC190723 was diluted in dimethyl sulfoxide to a concentration of 1 mm before use.
Polymerization of FtsZ
Because C. crescentus cells are routinely cultured at 28–30 °C, we kept the temperature of FtsZ polymerization assays at 29 °C. The polymerization buffer consisted of 50 mm MES-NaOH, 10 mm MgCl2, and 50 mm KCl (pH 6.5). The concentration of FtsZ in our experiments was 220 mg/liter (4.1 μm; molecular mass = 54.2 kDa). A concentrated solution of GTP (0.1 m) was added to the FtsZ solution to initiate polymerization, thus minimizing the change in volume (1 ml). We also performed control experiments in a buffer containing only 3 mm MgCl2, which yielded very similar results (supplemental Fig. S3).
DLS Measurements
We used a Brookhaven BI-200SM goniometer equipped with Contin software to measure DLS spectra. A stable argon ion laser with a wavelength of 514 nm was used for DLS measurements.
All samples were filtered through a 0.22-μm filter before analysis. In each experiment, we mixed the GTP solution with the FtsZ solution and placed the reaction mixture in the goniometer for DLS measurements. We began to calculate the reaction time once the GTP was added into the FtsZ solution.
We measured the intensity of scattered light at an angle of 90° and used the Contin software to analyze the data for the distribution of size of the FtsZ polymers. We found that we needed to accumulate the signal for 1 min to minimize the measurement error.
TEM
A solution of GTP was added to the FtsZ solution to a final concentration of 1 mm to initiate polymerization. After 15 min of incubation at 29 °C in the presence of GTP, 20-μl samples were placed on 400-mesh copper grids (Sigma) covered with collodion (SPI Supplies, West Chester, PA) and carbon (in additional experiments, the samples were fixed prior to deposition on the grid by incubation with 0.5% glutaraldehyde for 10 min). The samples deposited on the grid were either incubated for 40 s or adsorbed immediately on the surface by dewetting with blotting paper (corresponding to a contact time of ∼1 s). Subsequently, negative staining was performed with 2% (w/v) uranyl acetate (SPI Supplies) for 25 s. The grids were examined at an acceleration voltage of 80 kV in a JEM 1400 electron microscope (JEOL, Tokyo, Japan) equipped with a digital camera (CCD MORADA, SiS-Olympus).
Calculation of the Decay Time
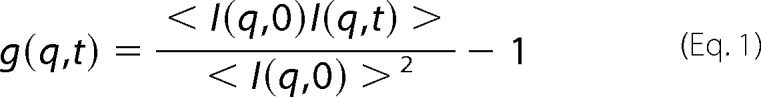
The system records the intensity I(q,t) of light scattered along vector q as a function of time. The size of the FtsZ polymers was extracted from the autocorrelation of I(t). The normalized autocorrelation function is
 |
The scattering vector was determined by the refractive index of the solution (m), the wavelength (λ) of the incident light, and the scattering angle θ = 90°,
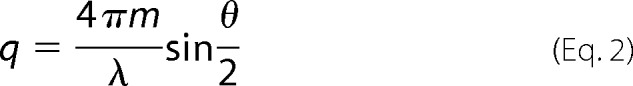 |
We used a standard Abbe refractometer (Carl-Zeiss) to measure the refractive index, m, of the FtsZ solution. We found that m = 1.335, which was approximately constant during the polymerization of FtsZ. Thus, q was also constant when the scattering angle θ was fixed.
If the scattered field obeys Gaussian statistics, the measured intensity autocorrelation function g(q,t) is related to the normalized field correlation function g′(q,t),
where c∈ (0, 1) is the experimental coherence factor. If the fluctuation of the concentration of the polymer relaxes through simple Brownian diffusion, g′(q,t) can be expressed by a one-component diffusion mode,
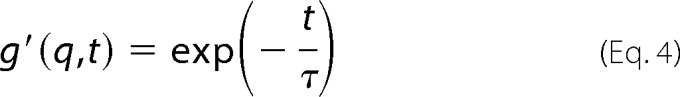 |
where τ, which we refer to as the “decay time,” is the characteristic time of the decay of autocorrelation of the signal. Combining Equations 3 and 4 connects the decay time to the autocorrelation function.
Fitting Equation 5 to the experimental data made it possible to determine the decay time of FtsZ polymers.
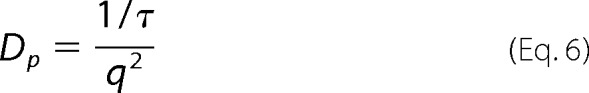
Further, we use the decay time τ to extract the diffusion coefficient Dp of the FtsZ polymers
 |
Determining the Size of FtsZ Polymers
Three traditional fitting methods (29–31) were used to calculate the size of FtsZ polymers.
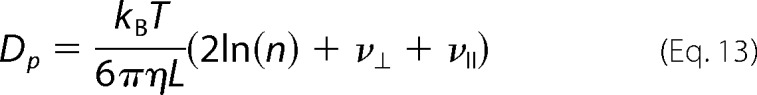
In the first method, the translational self-diffusion coefficient Dp of a cylindrical polymer can be expressed as (29)
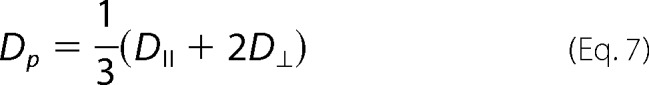 |
where D⊥ and DII describe the diffusion perpendicular and parallel to the long axis of the cylinder, respectively.
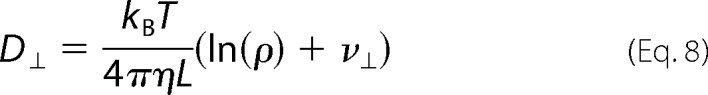 |
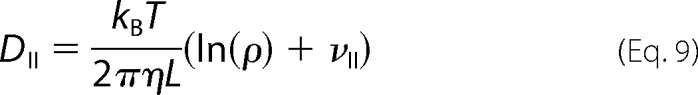 |
In Equations 8 and 9, kB is the Boltzmann constant, T is the absolute temperature, η is the viscosity of the FtsZ solution, ρ is axial ratio, and ν⊥ and νII are “end-effect corrections.”
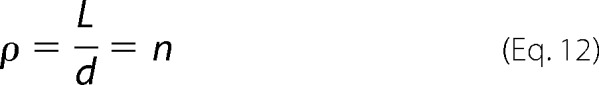 |
where n is the number of monomers in a polymer, and L and d are the length and diameter of the FtsZ polymer, respectively. We assume that FtsZ polymers consist of a single filament of monomers. Combining Equations 7–11 we obtain an expression for the coefficient of diffusion of a single polymer,
 |
If n>5, ν⊥ + νII can be closely approximated by 0.632 according to Equations 10 and 11, yielding
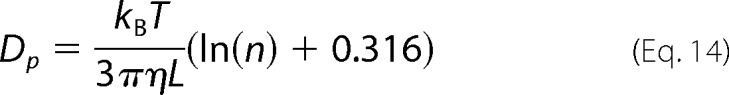 |
Equation 12 can be written as
Inserting Equation 15 into Equation 14, we obtain an expression relating Dp with the number of monomers in the oligomer
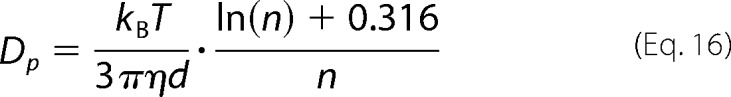 |
Equation 16 is only valid for FtsZ filaments consisting of n > 5 monomers. The diffusion coefficient Dm of a monomer according to the Stokes-Sutherland-Einstein equation is
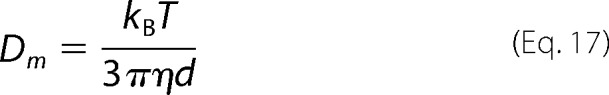 |
Here, the viscosity of FtsZ solutions η does not change during the polymerization process (see supplemental Fig. S5). Moreover, q in Equation 6 is also a constant due to a constant refractive index m and a fixed scattering angle θ. Combining Equations 6, 16, and 17, we can express the ratio of the decay times of the polymer τ0p (for n > 5) and of the monomer τ0m solely as a function of the number of monomers in a polymer,
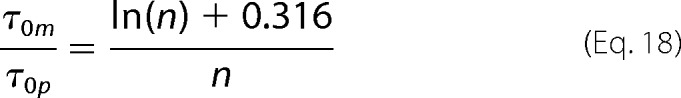 |
Equation 18 enables us to extract the length of the polymers n directly from the analysis of the autocorrelation functions of the DLS signal.
In the second method (30), the effective hydrodynamic radius of a thread polymer Rhp is expressed as
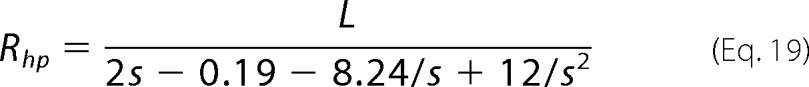 |
where s is defined as
where r is the radius of thread filament (here is the radius of monomers) and n is the number of monomers in a polymer.
Based on the Stokes-Sutherland-Einstein equation, the diffusion coefficient of the polymer Dp can be expressed as
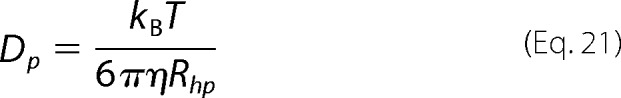 |
and the diffusion coefficient of the monomer Dm is expressed as
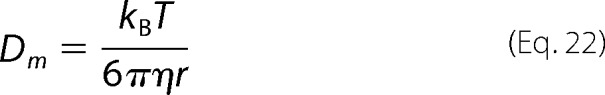 |
Combining Equations 6, 21, and 22 we determine that
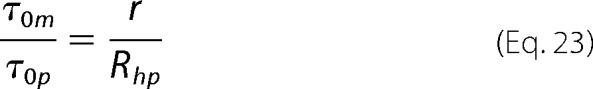 |
Substituting Equations 19 and 20 into Equation 23, we derive
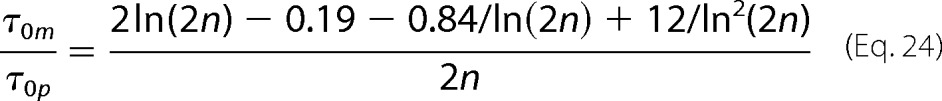 |
Equation 24 enables us to extract the length of the polymers n directly from the analysis of the autocorrelation functions of the DLS signal.
In the third method the FtsZ polymer is assumed to comprise identical spheres. According to Kirkwood formulation (31), the diffusion coefficient of such a polymer is
where f is the frictional coefficient tensor defined as
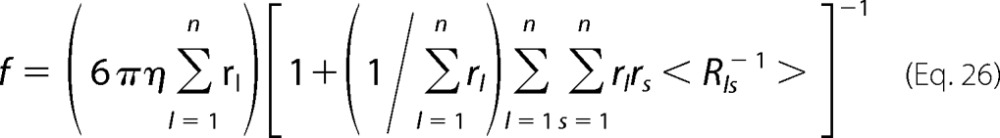 |
where r is the radius of subunit l and Rls is the distance between the lth and sth unit (l≠s). For a polymer composed of identical spherical subunits, Equation 26 reduces to
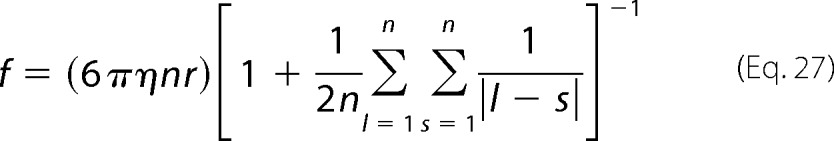 |
The sum can be approximated by
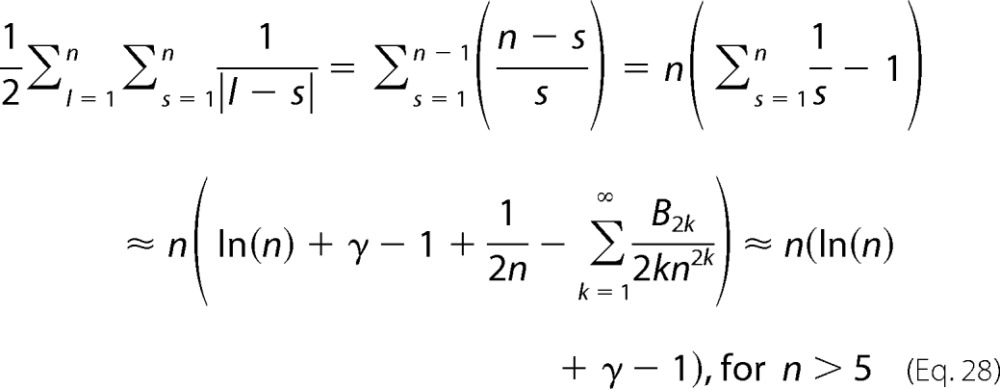 |
where Bk are the Bernoulli numbers and γ = 0.5772 is the Euler-Mascheroni constant. Combining Equations 27 and 28 one obtains
 |
Further, combining Equations 25 and 29, we obtain
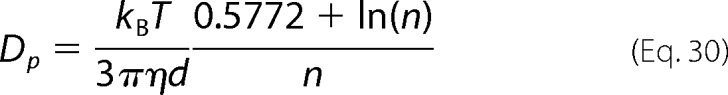 |
and combining Equations 6, 17, and 30, we get
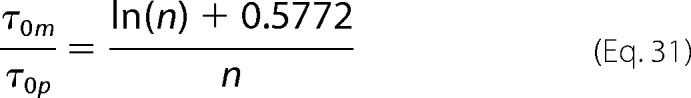 |
Equation 31 enables us to extract the number n of monomers in the polymer directly from the analysis of the autocorrelation functions of the DLS signal.
RESULTS
Characterization of the Rate and Degree of Polymerization of FtsZ Using DLS
The decay time of the DLS signal is related to the coefficient of diffusion of objects that scatter light. In our study, an increase in the decay time provided a measure of polymerization, whereas depolymerization was inferred from the measured reduction of the decay time. This relationship is illustrated in Fig. 1a. Before addition of GTP, the decay time of FtsZ monomers was τ ∼60 μs. Addition of GTP to a final concentration of 1 mm initiated polymerization, and within 10 min τ increased to ∼200 μs. After 40 min the decay time started to decrease slowly, indicating the onset of FtsZ depolymerization.
FIGURE 1.

a and b, decay time (a) and count rate (b) of FtsZ polymers as a function of FtsZ polymerization time. GTP was added to a final concentration of 1 mm to initiate polymerization. The concentration of FtsZ was 220 mg/liter. c–f, one-component fitting of DLS data (for explanation, see “Materials and Methods”) to Equation 5 of the points labeled c–f in a. The data demonstrate the uniformity in the length of FtsZ polymers during polymerization.
There is no obvious correlation between the polymerization time (10 min) and the hydrolytic activity (kcat = 5.2 min−1) of C. crescentus FtsZ (18). However, the value of kcat indicates the complete consumption of free GTP after ∼ 47 min, which is in agreement with our results (for comparison see supplemental Fig. S4).
Apart from the decay time, DLS yields also the count rate that reflects the number of scattered photons detected by the detector per unit time. This readout provides information similar to that given by SLS (23). The count rate (Fig. 1b) acquired from a solution of FtsZ monomers was <10 kHz. The addition of GTP increased the count rate to 50 kHz within 10 min. After 40 min, the pool of free GTP was exhausted, and the count rate fell again below 10 kHz. Thus, the count rate followed the same trend as the decay time throughout the polymerization process, which is consistent with previous SLS measurements of E. coli FtsZ (16, 23).
We found that single-mode diffusion models could be fit accurately to the measured autocorrelation functions of our samples at all stages of the polymerization/depolymerization process (Fig. 1, c–f), indicating that the polymers in the samples are monodisperse in length.
A comparison of our data with the results obtained for FtsZ homologues from other bacteria demonstrates significant differences in the rate of polymerization. For example, E. coli FtsZ was reported to polymerize completely within seconds (16); Mycobacterium tuberculosis FtsZ polymerizes completely within 1–10 min, depending on the pH (32, 33). The polymerization time that we measured for C. crescentus FtsZ using DLS and SLS (supplemental Fig. S1) was significantly longer.
Many factors may influence the rate of polymerization. For example, Goley et al. demonstrated that the polymerization of C. crescentus FtsZ is affected by buffer conditions (34). Interestingly, we observed that repeated cycles of polymerization and depolymerization as well as incubation with GDP before addition of GTP accelerated the rate of C. crescentus FtsZ polymerization (supplemental Fig. S2).
TEM Analysis of FtsZ Filaments
In reported TEM procedures, samples containing polymerized FtsZ are typically brought in contact with carbon-coated copper grids for ∼1 min before they are stained (18, 23). In the first experiment, we deposited the sample (incubated with GTP for 1 min) on the grid surface, waited for 40 s, and then stained the resulting polymers with uranyl acetate. We found that the majority of the FtsZ polymers in this sample had formed flat bundles in which linear FtsZ filaments were oriented in parallel to each other (Fig. 2a). The bundles formed two-dimensional structures that lay flat on the grid surface. This arrangement suggests that polymerization and bundling largely occurred after FtsZ had contacted the surface, as bundles assembling in a bulk solution would produce more disordered, three-dimensional aggregates. To confirm this hypothesis, we incubated additional samples containing actively polymerizing FtsZ on the grid surface for only 1 s before staining and dewetting with blotting paper. In this case, FtsZ only formed single protofilaments or small filament bundles consisting of only two parallel linear polymers (Fig. 2b). We also prepared a sample that was fixed using 0.5% glutaraldehyde prior to its deposition on the grid and staining. In this sample, FtsZ primarily formed linear protofilaments that were shorter than those prepared using the other two protocols (Fig. 2c).
FIGURE 2.

a, TEM image of FtsZ polymers incubated on the grid surface for 40 s, prior to being stained by uranyl acetate. b, TEM image of FtsZ polymers incubated on the grid surface for 1 s, prior to being stained by uranyl acetate. c, TEM image of FtsZ polymers fixed with 0.5% glutaraldehyde for 10 min and then incubated on the grid surface for 40 s, followed by being stained with uranyl acetate. d–f, schemes depicting FtsZ bundles, linear FtsZ polymers, and small FtsZ bundles, indicating that a short time contacting with a surface greatly enhances the formation of FtsZ bundles. All samples were incubated at 29 °C for 15 min before contact with the grid surface. Scale bars, 200 nm.
The TEM data indicate that FtsZ assembles into bundles after contacting surfaces for as little as 1 s. The maximum length of the C. crescentus FtsZ polymers that we observed agrees with the length obtained for E. coli FtsZ filaments using AFM (27). However, the reported lengths of FtsZ polymers measured with TEM differ significantly; for example, a study of E. coli FtsZ polymers reported length >1 μm (16). One explanation for this large discrepancy in the length of FtsZ filaments may be the contact of growing filaments with surfaces, which we found to have a profound effect on FtsZ polymer structure. FtsZ may adsorb on surfaces via weak electrostatic interactions (27). After adsorption, the two-dimensional diffusion of FtsZ along the surface may result in higher association rates compared with the three-dimensional diffusion in solution (35). The process should result in bundles of FtsZ filaments that are oriented with the plane of the surface and larger than in bulk solution, in agreement with our DLS and TEM measurements.
Size of FtsZ Polymers Calculated by Three Fitting Models
An important advantage of DLS is that it allows the determination of the diffusion coefficient of FtsZ polymers (Fig. 3a). Based on the diffusion coefficient and assuming that FtsZ polymers have an approximately linear shape (Fig. 2), we used three different models to estimate their size (Fig. 3b) (29–31). The first model takes into consideration the anisotropy of diffusion of the rigid rod in three dimensions (30, 36, 37). To test the sensitivity of this model to specific assumptions about the diffusivity of the polymer, we applied a second algorithm, which uses an effective hydrodynamic radius of the rod (29). Finally, we used a third model in which the FtsZ polymer consists of identical spheres and has an overall rough surface (31). All of the models yield the number of monomers in the polymer, and all three of them produce similar results: the polymers ranged from 9 to 18 monomers in length in the stable interval (Fig. 3b).
FIGURE 3.

Diffusion coefficient (a) and size (b) of FtsZ polymers (expressed as the number of FtsZ monomers in a polymer) as a function of FtsZ polymerization time. GTP was added to a final concentration of 1 mm to initiate polymerization. The concentration of FtsZ was 220 mg/liter. We show the size of FtsZ polymers as a result of three fitting methods. The diameter of one monomer is 5.17 ± 0.56 nm.
Using the DLS readout of the diffusion coefficient we calculated the size of the monomer of C. crescentus FtsZ to be 5.17 ± 0.56 nm. This agrees well with the reported size of 5–6 nm of the E. coli FtsZ (38). The length of a the polymer containing 9–18 monomers thus ranges between ∼47 and 93 nm and is in close agreement with our TEM data (Fig. 2c).
Notably, our data suggest that the number of monomers in the C. crescentus FtsZ polymer is much smaller than in the E. coli FtsZ (roughly 70 monomers) (14). Because the sizes of the monomers of C. crescentus FtsZ and E. coli FtsZ are almost equal, the calculated length of C. crescentus FtsZ polymer is much shorter than that of E. coli FtsZ polymer. This result agrees well with reported TEM images, which show that C. crescentus FtsZ polymers are much shorter than E. coli FtsZ polymers (18, 38).
As an additional check we verified that the assumption of the morphology of straight rigid rods does not significantly influence the above estimations. Indeed the TEM scans (Fig. 2) show that the FtsZ filaments may be slightly curved. To gauge the influence of the shape on the estimated length of the filaments, we used two additional models based on the extreme assumptions of a C- or S-shaped chains. These models provided similar estimates of the length of the FtsZ polymers to within one monomer (see supplemental Fig. S7) and confirm the above estimates.
From the variation of the diffusion coefficient of FtsZ polymers, we deduced that C. crescentus FtsZ assembles very rapidly into a filament consisting of ∼5 monomers. The subsequent elongation of this filament occurs significantly more slowly. The diffusion coefficient initially dropped to ∼40% of that of a monomer within 1 min after the start of polymerization. In the following 9 min, it then gradually decreased to its minimum value, reaching ∼30% of the value measured for the monomer.
Influence of the GTP/GDP Ratio on FtsZ Polymerization and Depolymerization
We used the same experimental system to measure changes of the kinetics of polymerization and depolymerization of FtsZ polymers upon successive additions of GTP. We added GTP into the FtsZ polymerization buffer solution to a final concentration of 0.25 mm. In the course of the experiment, GTP was completely converted to GDP, resulting in disassembly of the polymers. We then titrated-in GTP again (to its initial concentration) and iterated this procedure three times (Fig. 4). The decay time, the count rate, and the diffusion coefficient displayed similar curves after each addition of GTP. Notably, the diffusion coefficient of the protofilaments did not change between the successive experiments. However, after consecutive additions of nucleotide, FtsZ polymerization was accelerated, whereas depolymerization was decelerated. For example, after the first addition of GTP polymerization occurred within ∼20 min, and complete polymer disassembly within ∼10 min. After the fourth addition of GTP, FtsZ polymerization was instantaneous (within the resolution of our measurements), whereas the depolymerization phase was extended to ∼20 min. We associate the observed increase of the rate of polymerization with the gradual accumulation of GDP. Consistent with this idea, an assay in which we directly mixed GTP and GDP to emulate the conditions just before the fourth addition of GTP in the experiment described above showed the same result (see supplemental Fig. S2).
FIGURE 4.

Decay time (a), count rate (b), and diffusion coefficient (c) of FtsZ polymers as a function of FtsZ polymerization time over four assembly/disassembly cycles. Each cycle is started by addition of 0.25 mm GTP (final concentration) to the FtsZ solution. The concentration of FtsZ was 220 mg/liter.
Our results are consistent with a previous study showing that the disassembly rate of E. coli FtsZ decreases with increasing GDP concentrations (23). Similarly, the stimulatory effect of GDP on the assembly reaction observed for C. crescentus FtsZ may also apply to homologues from other species, including E. coli (23). However, this phenomenon may so far have escaped detection for E. coli FtsZ due to its very rapid rate of polymerization (23).
Influence of GTP Concentration on FtsZ Polymerization
Our polymerization experiments produced FtsZ filaments of the same length irrespective of the GTP concentration. We also found that the GTP concentration did not affect the rate of FtsZ polymerization/depolymerization (Fig. 5). As we show in supplemental Fig. S5, the viscosity of FtsZ solutions did not change appreciably during the polymerization step. Higher concentrations of GTP only prolonged the interval during which the FtsZ polymers remained at their maximum length. These results agree with a previous study of the influence of GTP on the polymerization of E. coli FtsZ (16).
FIGURE 5.

Influence of GTP concentration on the decay time (a) and diffusion coefficient (b) of FtsZ polymers during FtsZ polymerization process. A high GTP concentration prolonged the time over which FtsZ polymers are stable. The concentration of FtsZ was 220 mg/liter.
Influence of FtsZ Concentration on FtsZ Polymerization
We demonstrate that the concentration of FtsZ clearly influences the interval during which the polymers are stable presumably because it affects the time required for the complete consumption of GTP. However, within the limited range of FtsZ concentrations tested (0.22–0.44 mg/ml), it did not change the maximum length of the filaments, as derived from the invariance of the diffusion coefficients measured (Fig. 6). High concentrations of FtsZ thus merely increased the number of FtsZ polymers but did not increase their length. Importantly, the critical concentration of C. crescentus FtsZ, i.e. the minimum concentration required for proper assembly, was measured to be 0.52 μm (see supplemental Fig. S6). The concentration of FtsZ tested in our experiments was always well above this value.
FIGURE 6.

a, influence of the concentration of FtsZ monomers on the diffusion coefficient of resulting FtsZ polymers during the polymerization process. The size of FtsZ polymers (expressed as the number of FtsZ monomers in a polymer) was calculated using three methods: model 1 (b), model 2 (c), and model 3 (d). GTP was added to a final concentration of 1 mm to initiate polymerization. The diameter of one monomer is 5.17 ± 0.56 nm.
Influence of PC190723 on the Polymerization of C. crescentus FtsZ
PC190723 is a phenylthiazoline that prevents cell division by stabilizing FtsZ filaments and reducing the GTPase activity of this protein (17). PC190723 is an effective antibiotic against both methicillin-resistant and multidrug-resistant S. aureus strains; however, it has much weaker activity against Gram-negative bacteria (17). One hypothesis has been that this compound binds only weakly to Gram-negative FtsZ, which is supported by experiments with E. coli FtsZ in vitro (17). The verification of this hypothesis would benefit greatly from studies with FtsZ from another Gram-negative bacterium. With synthetic PC190723 in-hand (28), we studied the interaction of this small molecule with C. crescentus FtsZ in vitro using DLS.
Our measurements indicate that PC190723 has no effect on the polymerization of C. crescentus FtsZ (Fig. 7). The decay time increased, and the count rate decreased to the same extent in the presence and absence of PC190723, respectively. Similarly, all characteristics of the polymerization and depolymerization kinetics, including the polymerization rate, the interval during which the polymers retained their maximum length, the size of polymers as indicated by their diffusion coefficient, and the depolymerization rate, remained unaffected by PC190723.
FIGURE 7.

Count rate (a), decay time (b), and diffusion coefficient (c) of FtsZ polymers as a function of polymerization time. The data demonstrate that PC190723 does not influence FtsZ polymerization. GTP was added to a final concentration of 1 mm to initiate the polymerization. The concentration of FtsZ was 220 mg/liter. The concentration of PC190723 was 20 μm (7.1 μg/ml). The same volume of dimethyl sulfoxide (DMSO) as the PC190723 solution was used as a control.
CONCLUSIONS
We used DLS to study the polymerization and disassembly of FtsZ polymers. This technique enabled us to measure the increase of the intensity of scattered light and the characteristic decay time of the autocorrelation function and provided a quantitative value for the degree of FtsZ polymerization. We envision that the methodological framework established in this study has laid the foundation for the application of this technique to various other cytoskeletal proteins.
The work was supported, in whole or in part, by National Institutes of Health Grant R01AI08093 (to J. T. S.). This work was also supported by Collaborative Research Grant RGY0069/2008-C103 from the Human Frontier Science Program (to P. G., M. T., and D. B. W.) and by programs co-financed by the European Union “European Regional Development Fund”: NanoFun POIG.02.02.00-00-025/09 and TEAM/2008-2/2 operated by the Foundation for Polish Science. Microscopic studies were performed in the Laboratory of Electron Microscopy (Nencki Institute of Experimental Biology, Warsaw, Poland) using equipment installed within the project sponsored by the European Union Structural Funds: Centre of Advanced Technology BIM, equipment purchase for the Laboratory of Biological and Medical Imaging.

This article contains supplemental Figs. S1–S7, Experimental Procedures, and additional references.
- DLS
- dynamic light scattering
- AFM
- atomic force microscopy
- SLS
- static light scattering
- TEM
- transmission electron microscopy.
REFERENCES
- 1. Kiessling J., Kruse S., Rensing S. A., Harter K., Decker E. L., Reski R. (2000) Visualization of a cytoskeleton-like FtsZ network in chloroplasts. J. Cell Biol. 151, 945–950 [DOI] [PMC free article] [PubMed] [Google Scholar]
- 2. Paez A., Tarazona P., Mateos-Gil P., Velez M. (2009) Self-organization of curved living polymers: FtsZ protein filaments. Soft Matter 5, 2625–2637 [Google Scholar]
- 3. Li Z., Trimble M. J., Brun Y. V., Jensen G. J. (2007) The structure of FtsZ filaments in vivo suggests a force-generating role in cell division. EMBO J. 26, 4694–4708 [DOI] [PMC free article] [PubMed] [Google Scholar]
- 4. Margalit D. N., Romberg L., Mets R. B., Hebert A. M., Mitchison T. J., Kirschner M. W., RayChaudhuri D. (2004) Targeting cell division: small-molecule inhibitors of FtsZ GTPase perturb cytokinetic ring assembly and induce bacterial lethality. Proc. Natl. Acad. Sci. U.S.A. 101, 11821–11826 [DOI] [PMC free article] [PubMed] [Google Scholar]
- 5. Erickson H. P., Anderson D. E., Osawa M. (2010) FtsZ in bacterial cytokinesis: cytoskeleton and force generator all in one. Microbiol. Mol. Biol. Rev. 74, 504–528 [DOI] [PMC free article] [PubMed] [Google Scholar]
- 6. Chen Y., Erickson H. P. (2011) Conformational changes of FtsZ reported by tryptophan mutants. Biochemistry 50, 4675–4684 [DOI] [PMC free article] [PubMed] [Google Scholar]
- 7. Romberg L., Levin P. A. (2003) Assembly dynamics of the bacterial cell division protein FTSZ: poised at the edge of stability. Annu. Rev. Microbiol. 57, 125–154 [DOI] [PMC free article] [PubMed] [Google Scholar]
- 8. Addinall S. G., Lutkenhaus J. (1996) FtsZ-spirals and -arcs determine the shape of the invaginating septa in some mutants of Escherichia coli. Mol. Microbiol. 22, 231–237 [DOI] [PubMed] [Google Scholar]
- 9. Bi E. F., Lutkenhaus J. (1991) FtsZ ring structure associated with division in Escherichia coli. Nature 354, 161–164 [DOI] [PubMed] [Google Scholar]
- 10. Harry E. J. (2001) Bacterial cell division: regulating Z-ring formation. Mol. Microbiol. 40, 795–803 [DOI] [PubMed] [Google Scholar]
- 11. Weart R. B., Levin P. A. (2003) Growth rate-dependent regulation of medial FtsZ ring formation. J. Bacteriol. 185, 2826–2834 [DOI] [PMC free article] [PubMed] [Google Scholar]
- 12. Quardokus E. M., Brun Y. V. (2002) DNA replication initiation is required for mid-cell positioning of FtsZ rings in Caulobacter crescentus. Mol. Microbiol. 45, 605–616 [DOI] [PubMed] [Google Scholar]
- 13. Goehring N. W., Beckwith J. (2005) Diverse paths to midcell: assembly of the bacterial cell division machinery. Curr. Biol. 15, R514–526 [DOI] [PubMed] [Google Scholar]
- 14. Reija B., Monterroso B., Jiménez M., Vicente M., Rivas G., Zorrilla S. (2011) Development of a homogeneous fluorescence anisotropy assay to monitor and measure FtsZ assembly in solution. Anal. Biochem. 418, 89–96 [DOI] [PubMed] [Google Scholar]
- 15. Nogales E., Downing K. H., Amos L. A., Löwe J. (1998) Tubulin and FtsZ form a distinct family of GTPases. Nat. Struct. Biol. 5, 451–458 [DOI] [PubMed] [Google Scholar]
- 16. Mukherjee A., Lutkenhaus J. (1999) Analysis of FtsZ assembly by light scattering and determination of the role of divalent metal cations. J. Bacteriol. 181, 823–832 [DOI] [PMC free article] [PubMed] [Google Scholar]
- 17. Andreu J. M., Schaffner-Barbero C., Huecas S., Alonso D., Lopez-Rodriguez M. L., Ruiz-Avila L. B., Núñez-Ramírez R., Llorca O., Martín-Galiano A. J. (2010) The antibacterial cell division inhibitor PC190723 is an FtsZ polymer-stabilizing agent that induces filament assembly and condensation. J. Biol. Chem. 285, 14239–14246 [DOI] [PMC free article] [PubMed] [Google Scholar]
- 18. Thanbichler M., Shapiro L. (2006) MipZ, a spatial regulator coordinating chromosome segregation with cell division in Caulobacter. Cell 126, 147–162 [DOI] [PubMed] [Google Scholar]
- 19. Beuria T. K., Krishnakumar S. S., Sahar S., Singh N., Gupta K., Meshram M., Panda D. (2003) Glutamate-induced assembly of bacterial cell division protein FtsZ. J. Biol. Chem. 278, 3735–3741 [DOI] [PubMed] [Google Scholar]
- 20. Hou S., Ziebacz N., Wieczorek S. A., Kalwarczyk E., Sashuk V., Kalwarczyk T., Kaminski T. S., Holyst R. (2011) Formation and structure of PEI/DNA complexes: quantitative analysis. Soft Matter 7, 6967–6972 [Google Scholar]
- 21. Koppel D. E. (1972) Analysis of macromolecular polydispersity in intensity correlation spectroscopy: the method of cumulants. J. Chem. Phys. 57, 4814–4820 [Google Scholar]
- 22. Popp D., Iwasa M., Erickson H. P., Narita A., Maéda Y., Robinson R. C. (2010) Suprastructures and dynamic properties of Mycobacterium tuberculosis FtsZ. J. Biol. Chem. 285, 11281–11289 [DOI] [PMC free article] [PubMed] [Google Scholar]
- 23. Small E., Addinall S. G. (2003) Dynamic FtsZ polymerization is sensitive to the GTP to GDP ratio and can be maintained at steady state using a GTP-regeneration system. Microbiology 149, 2235–2242 [DOI] [PubMed] [Google Scholar]
- 24. Casini G. L., Graham D., Heine D., Garcea R. L., Wu D. T. (2004) In vitro papillomavirus capsid assembly analyzed by light scattering. Virology 325, 320–327 [DOI] [PubMed] [Google Scholar]
- 25. Mingorance J., Tadros M., Vicente M., González J. M., Rivas G., Vélez M. (2005) Visualization of single Escherichia coli FtsZ filament dynamics with atomic force microscopy. J. Biol. Chem. 280, 20909–20914 [DOI] [PubMed] [Google Scholar]
- 26. Wyatt P. J. (1998) Submicrometer particle sizing by multiangle light scattering following fractionation J. Colloid Interface Sci. 197, 9–20 [DOI] [PubMed] [Google Scholar]
- 27. Hamon L., Panda D., Savarin P., Joshi V., Bernhard J., Mucher E., Mechulam A., Curmi P. A., Pastré D. (2009) Mica surface promotes the assembly of cytoskeletal proteins. Langmuir 25, 3331–3335 [DOI] [PubMed] [Google Scholar]
- 28. Sorto N. A., Olmstead M. M., Shaw J. T. (2010) Practical synthesis of PC190723, an inhibitor of the bacterial cell division protein FtsZ. J. Org. Chem. 75, 7946–7949 [DOI] [PMC free article] [PubMed] [Google Scholar]
- 29. Seils J., Pecora R. (1995) Dynamics of a 2311-base pair superhelical DNA in dilute and semidilute solutions. Macromolecules 28, 661–673 [Google Scholar]
- 30. Van de Sande W., Persoons A. (1985) The size and shape of macromolecular structures: determination of the redius, the length, and the persistence length of rod-like micelles of dodecyldimethylammonium chloride and bromide. J. Phys. Chem. 89, 404–406 [Google Scholar]
- 31. Bloomfield V., Dalton W. O., Van Holde K. E. (1967) Frictional coefficients of multisubunit structures. I. Theory. Biopolymers 5, 135–148 [DOI] [PubMed] [Google Scholar]
- 32. White E. L., Ross L. J., Reynolds R. C., Seitz L. E., Moore G. D., Borhani D. W. (2000) Slow polymerization of Mycobacterium tuberculosis FtsZ. J. Bacteriol. 182, 4028–4034 [DOI] [PMC free article] [PubMed] [Google Scholar]
- 33. Chen Y., Anderson D. E., Rajagopalan M., Erickson H. P. (2007) Assembly dynamics of Mycobacterium tuberculosis FtsZ. J. Biol. Chem. 282, 27736–27743 [DOI] [PMC free article] [PubMed] [Google Scholar]
- 34. Goley E. D., Dye N. A., Werner J. N., Gitai Z., Shapiro L. (2010) Imaging-based identification of a critical regulator of FtsZ protofilament curvature in Caulobacter. Mol. Cell 39, 975–987 [DOI] [PMC free article] [PubMed] [Google Scholar]
- 35. Berg O. G., von Hippel P. H. (1985) Diffusion-controlled macromolecular interactions. Annu. Rev. Biophys. Biophys. Chem. 14, 131–160 [DOI] [PubMed] [Google Scholar]
- 36. Tirado M. M., Garcia de la Torre J. (1980) Rotational dynamics of rigid, symmetric top macromolecules: application to circular cylinders. J. Chem. Phys. 73, 1986–1993 [Google Scholar]
- 37. Tirado M. M., Garcia de la Torre J. (1979) Translational friction coefficients of rigid, symmetric top macromolecules: application to circular cylinders. J. Chem. Phys. 71, 2581–2587 [Google Scholar]
- 38. Gonzalez J. M., Velez M., Jimenez M., Alfonso C., Schuck P., Mingorance J., Vicente M., Minton A. P., Rivas G. (2005) Cooperative behavior of Escherichia coli cell-division protein FtsZ assembly involves the preferential cyclization of long single-stranded fibrils. Proc. Natl. Acad. Sci. U.S.A. 102, 1895–1900 [DOI] [PMC free article] [PubMed] [Google Scholar]