Background: The dynamics of coupling of ATP hydrolysis with transport in ATP-binding cassette transporters is not well understood.
Results: Characterization of ATP hydrolysis in the MsbA nucleotide-binding domain by time-resolved FTIR spectroscopy revealed two rate constants for ATP binding with dimerization and hydrolysis.
Conclusion: ATP hydrolysis is rate-limiting.
Significance: The identification of the IR fingerprints of the motor domain will facilitate real-time analysis of the full-length MsbA transport cycle.
Keywords: ABC Transporter, ATPases, Fourier Transform IR (FTIR), Lipid Transport, Membrane Biophysics, Membrane Transport
Abstract
MsbA is an essential Escherichia coli ATP-binding cassette (ABC) transporter involved in the flipping of lipid A across the cytoplasmic membrane. It is a close homologue of human P-glycoprotein involved in multidrug resistance, and it similarly accepts a variety of small hydrophobic xenobiotics as transport substrates. X-ray structures of three full-length ABC multidrug exporters (including MsbA) have been published recently and reveal large conformational changes during the transport cycle. However, how ATP hydrolysis couples to these conformational changes and finally the transport is still an open question. We employed time-resolved FTIR spectroscopy, a powerful method to elucidate molecular reaction mechanisms of soluble and membrane proteins, to address this question with high spatiotemporal resolution. Here, we monitored the hydrolysis reaction in the nucleotide-binding domain of MsbA at the atomic level. The isolated MsbA nucleotide-binding domain hydrolyzed ATP with Vmax = 45 nmol mg−1 min−1, similar to the full-length transporter. A Hill coefficient of 1.49 demonstrates positive cooperativity between the two catalytic sites formed upon dimerization. Global fit analysis of time-resolved FTIR data revealed two apparent rate constants of ∼1 and 0.01 s−1, which were assigned to formation of the catalytic site and hydrolysis, respectively. Using isotopically labeled ATP, we identified specific marker bands for protein-bound ATP (1245 cm−1), ADP (1101 and 1205 cm−1), and free phosphate (1078 cm−1). Cleavage of the β-phosphate–γ-phosphate bond was found to be the rate-limiting step; no protein-bound phosphate intermediate was resolved.
Introduction
ATP-binding cassette (ABC)3 transporters form a ubiquitous family of integral transmembrane proteins responsible for the active transport of a wide variety of compounds (ranging from single ions to whole proteins) across biological membranes (1–4). They share a common overall architecture consisting of two transmembrane domains (TMDs), found to be responsible for transport substrate (allocrite) specificity, and two nucleotide-binding domains (NBDs), which energize transport by ATP (substrate) hydrolysis. All conserved sequence motifs used for classification of the family are located in these NBDs. During the last decade, considerable progress has been made in the structure elucidation of full-length ABC transporters (5). Structures trapped in different states of the transport cycle support the alternating access model, in which the allocrite-binding site in the TMD is exposed sequentially to the intra- and extracellular sides. Direction of transport is determined by differences in binding affinities in the two conformations.
One subfamily of ABC transporters exports a broad range of small hydrophobic drugs across cell membranes in bacteria and eukaryotes. They can confer multidrug resistance and are therefore of large medical interest (6). The first identified and probably best studied representative of this class is human P-glycoprotein (ABCB1) (7). Its mouse homologue is the first eukaryotic ABC transporter, for which a full-length x-ray structure has been reported (8). P-glycoprotein has been trapped in the inward-facing open conformation in these crystals. Three-dimensional structures for two bacterial homologues were solved previously: Sav1866 from Staphylococcus aureus has been crystallized in the outward-facing conformation (9, 10), whereas three structures of MsbA have been reported as inward-facing open (from Escherichia coli), inward-facing half-closed (form Vibrio cholera), and outward facing (from Salmonella typhimurium) (11).
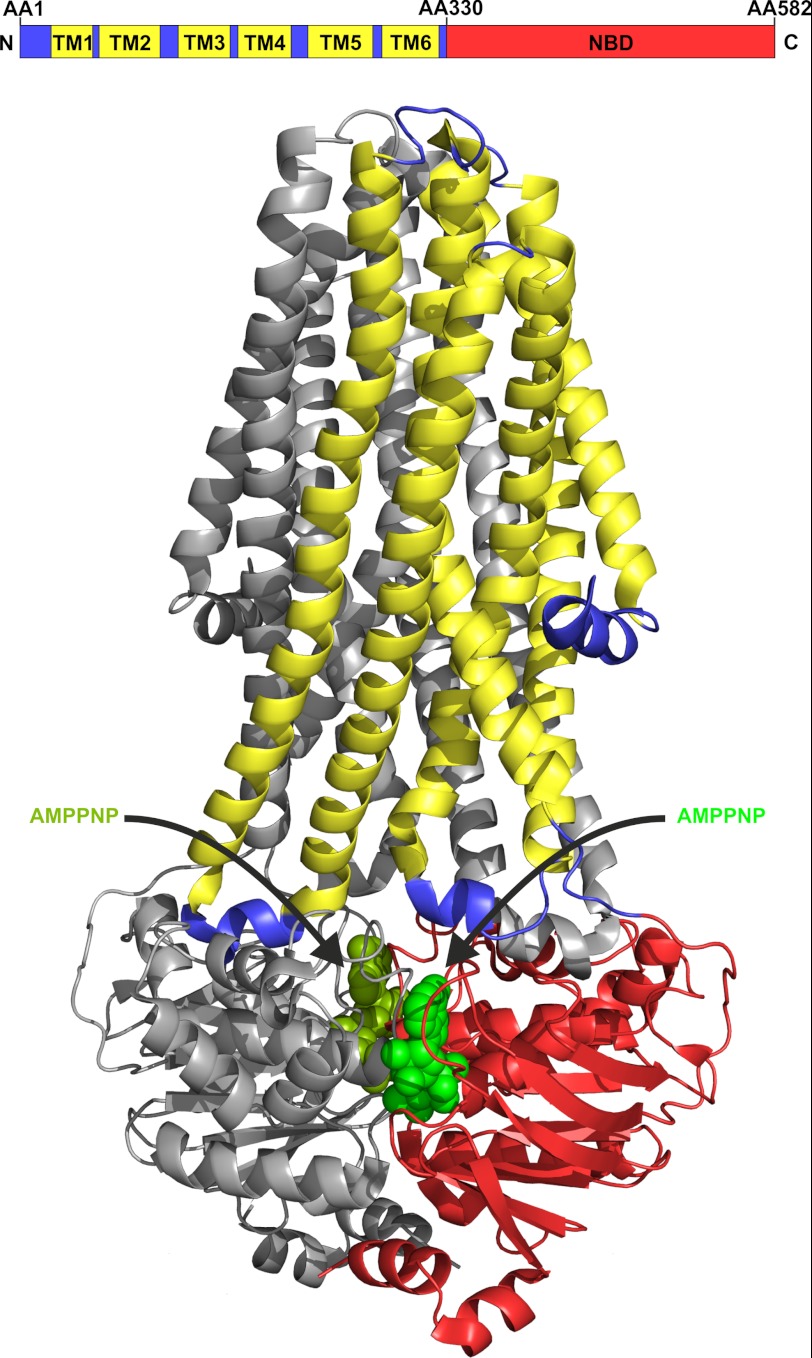
MsbA is a homodimeric transporter located in the cytoplasmic membrane of Gram-negative bacteria. It is essential for the flipping of lipid A from the inner to the outer membrane leaflet (12, 13) but, in addition, exports similar xenobiotics as P-glycoprotein or another bacterial multidrug transporter, LmrA from Lactococcus lactis (14). The 65-kDa monomer is composed of an N-terminal TMD with six membrane-spanning helices and a C-terminal NBD (Fig. 1). MsbA shows significant sequence similarities to other multidrug exporters. The TMD sequence of MsbA is 30% identical and 46% similar to the TMD of human P-glycoprotein, whereas the NBD region is 51% identical and 66% similar to P-glycoprotein (15). MsbA can therefore be used as a prokaryotic model for eukaryotic ABC multidrug exporters.
FIGURE 1.
Upper, domain organization of full-length MsbA. The TMD is shown in blue with its membrane-spanning helices in yellow. The C-terminal NBD is shown in red. AA, amino acid. B, illustration of the MsbA dimer (Protein Data Bank code 3B60). The back monomer is colored in gray, and the front monomer is colored corresponding to the schematic view above. The two nucleotides (AMP-PNP) in the binding pockets are illustrated as spheres in light and dark green.
Despite the large impact of the x-ray structures on our understanding of ABC transporters, they can only provide static snapshots of the transport cycle. Therefore, time-resolved techniques have to be employed to gain insight into the dynamics of ABC transporters. The conformational motion of MsbA (and the alternating access of the putative allocrite-binding chamber) during transport was investigated by electron paramagnetic resonance (16–20) and cysteine cross-linking (21). Fluorescence quenching was used to identify allocrites (reviewed in Ref. 6) and their putative binding sites (22, 23). Infrared spectroscopy with detection of secondary structure, hydrogen/deuterium exchange rates, and linear dichroism have been used to determine orientation and accessibility profiles of helices in lipid bilayers, e.g. for LmrA (24) and HorA (25).
It would be very beneficial to investigate allocrite translocation and ATP hydrolysis simultaneously with high spatiotemporal resolution. Time-resolved FTIR spectroscopy is ideally suited to elucidate molecular reaction mechanisms, as the infrared vibrations monitor the conformational and chemical state of the protein, allocrites (i.e. lipid A) or substrate (i.e. ATP), without the need of invasive labeling (26). The use of caged compounds allows the synchronization of reactions with a short laser pulse (27). This has been successfully employed for nucleotide hydrolysis in small GTPases (e.g. Ras (28), Rap (29), and Ran (30)) and ATPases (e.g. CopB (31), Na,K-ATPase (32), Ca-ATPase (33, 34), or Eg5 kinesin (35)).
In this study, we employed a cysteine-free MsbA-NBD construct to obtain the first time-resolved FTIR spectra of the ATP hydrolysis reaction of an ABC transporter. Employing isotopically labeled ATP analogues, we identified the IR fingerprints of α-, β-, and γ-phosphate groups. The kinetic data allow the direct identification of the rate-limiting steps for the catalytic cycle.
EXPERIMENTAL PROCEDURES
Chemicals
Na2ATP was purchased from Sigma-Aldrich. The photolabeled nucleotide para-hydroxyphenacyl-ATP (phpATP) (supplemental Fig. 1A) was synthesized as described previously (36). The photolabeled nucleotide 1-(ortho-nitrophenyl)ethyl-ATP (npeATP) (supplemental Fig. 1B) was synthesized as described previously (37). Synthesis of its isotopologues [α-18O2]npeATP, [α,β-18O/β-18O2]npeATP, and [β,γ-18O/γ-18O3]npeATP was performed as described previously (38–40). The concentration of the caged ATP was determined photometrically using extinction coefficients of ϵ260 = 19,600 m−1 cm−1 for npeATP (37) and ϵ286 = 14,600 m−1 cm−1 for phpATP (36).
Molecular Biology and Protein Expression
Based on the full-length MsbA protein sequence from E. coli K-12 (UniProtKB accession number P60752), a cysteine-free (C88S and C315S) codon-optimized gene was designed and synthesized (Mr. Gene GmbH, Regensburg, Germany), including a C-terminal His10 tag and a stop codon. The gene was cloned into the pET28b expression vector (Merck) using the NcoI and BamHI restriction sites, yielding vector pFS1. Based on this full-length vector, a NBD expression construct was created using the following primers: 5′-ATTCACCATGGATGGCAGAAGGCAAACGTGTGATCGAACGT-3′ and 5′-ATCCGGGATCCTTAGTGGTGATGGTGATGATGGTGGTGGTG-3′ (with the underlined bases indicating the NcoI and BamHI sites, the underlined boldface bases representing an inserted alanine codon, and the boldface bases indicate the annealing sequence). The PCR product was ligated into the pET28b vector, creating the MsbA-NBD expression vector pFS2. This construct includes amino acids 330–582 of full-length MsbA with two additional residues at the N-terminal end (Met-Ala) and His10 at the C-terminal end. The integrity of the plasmid construct was confirmed by DNA sequencing. The plasmid was then transformed into E. coli NEB5α cells for plasmid amplification and into E. coli ER2566 cells for protein expression. Both strains were from New England Biolabs.
Production and Purification of MsbA-NBD
For production of MsbA-NBD, 1 liter of LB medium containing 100 μg/ml kanamycin was inoculated from an overnight culture to A = 0.1. The main culture was incubated at 37 °C at 125 rpm, and protein expression was induced by the addition of 1 mm isopropyl β-d-thiogalactopyranoside (Biosynth AG, Staad, Switzerland) at A600 = 0.6–0.8. After induction, cells were cultured for 3 h, harvested by centrifugation, and stored at −20 °C. Frozen cells were thawed on ice and resuspended in 30 ml of lysis buffer (50 mm Hepes (pH 7.5), 150 mm NaCl, 10 mm MgCl2, and 20 mm imidazole). Cells were disrupted using a fluidizer (Microfluidics) at 12,000 p.s.i. To spin down cell fragments and not disrupted cells, 35 ml of lysis buffer was added, and the lysate was centrifuged for 30 min at 10,000 × g. After ultracentrifugation of the supernatant for 45 min at 100,000 × g, the soluble fraction was filtered through a 0.2-μm filter and applied to a 1-ml Ni-NTA (nickel-nitrilotriacetic acid) Superflow column (Qiagen). After a washing step, the protein was eluted from the column with lysis buffer containing 300 mm imidazole by gravity flow. For anion exchange chromatography, the eluate was transferred into low salt buffer (50 mm Hepes (pH 7.5), 2 mm NaCl, and 2 mm MgCl2) using a PD-10 desalting column (GE Healthcare). The protein solution was loaded onto a DEAE FF 5-ml column (GE Healthcare) using an ÄKTApurifier 100 system (GE Healthcare). Bound protein was eluted via a salt gradient mixing low salt buffer and high salt buffer (50 mm Hepes (pH 7.5), 1 m NaCl, and 20 mm MgCl2). Peak fractions were collected; pooled; concentrated (Vivaspin 20 concentrator with a molecular mass cutoff of 10,000, Sartorius Stedim Biotech GmbH, Göttingen, Germany) up to 10 mg/ml; desalted in 5 mm Hepes (pH 7.5), 5 mm NaCl, and 2 mm MgCl2; and used for ATPase activity assays and FTIR spectroscopy.
ATPase Activity Assays
The MsbA-NBD ATPase activity was quantified by monitoring the amount of liberated inorganic phosphate using a modified procedure described previously (41). Briefly, samples of 50 μg of MsbA-NBD were incubated in a volume of 100 μl containing 50 mm Hepes (pH 7.5), 10 mm MgCl2, and 3 mm ATP at 37 °C for 30 min at 750 rpm in a Thermomixer (Eppendorf, Hamburg, Germany). The reaction was started by the addition of ATP and stopped by the addition of 400 μl of molybdate reagent containing 0.5% (w/v) (NH4)2Mo7O24, 2% (w/v) H2SO4, and 0.5% (w/v) SDS. Complex formation was induced by the addition of 20 μl of 10% (w/v) ascorbic acid. Non-enzymatic phosphate release was monitored with samples containing the inactive His6-tagged GTPase mutant Rab11a(Q70L)D43 instead of MsbA-NBD. After a 2-min incubation at 37 °C, the absorbance was read at 750 nm using a NanoDrop 2000c spectrophotometer (PEQLAB Biotechnologie GmbH, Erlangen, Germany). All values are triplicate determinations. In addition, we used an HPLC-based ATPase activity assay in which the ATPase reaction was stopped by shock-freezing the samples in liquid nitrogen. For Michaelis-Menten kinetics, substrate concentrations from 0.2–4.0 mm ATP were used. Data were analyzed using either Equation 1,
 |
assuming no cooperative effects during hydrolysis, or Equation 2,
 |
which assumes cooperativity. V and Vmax are velocity and maximal velocity of the reaction, respectively. [S] denotes substrate concentration, Km and K0.5 are concentrations where V is at 50% of Vmax, and H is the Hill coefficient. All measurements were done in triplicates.
FTIR Measurements
FTIR measurements were performed in 125 mm Hepes, 125 mm NaCl, and 50 mm MgCl2 at pH 7.5 at a protein concentration of 8.6 mm. The band assignment experiments were performed with npeATP as the caged compound in the presence of 20 mm DTT. Kinetic experiments were performed with the faster photolyzing phpATP. Caged ATP and protein were used at a 1:1 molar ratio to guarantee single-turnover conditions. All preparations were done under red light due to the photo instability of the caged compounds.
The samples were prepared between two CaF2 windows with a 20-mm diameter and 2-mm thickness. One window possessed a concentric groove with a depth of 0.2 mm and a width of 2 mm, surrounding a deepened area 10 mm in diameter. The resulting sample thickness was 7 μm. A thin 2–3-mm wide silicon grease film was applied on both window rims. Protein solution and the caged ATP were applied onto the inner area of the grooved window. The sample was concentrated in a nitrogen stream to a volume of ∼0.8–1 μl and subsequently covered with the second window. The assembly was fixed in a blackened metal cuvette, which was then mounted in the spectrometer. All spectra were recorded at 293 K. At higher temperatures, the intrinsic hydrolysis rate is accelerated, which prevents base-line distortions, but the protein becomes less stable. The spectra were taken between 1900 and 900 cm−1.
Photolysis was performed with an LPX 240 XeCl excimer laser (Lambda Physik AG, Göttingen, Germany) at 308 nm. The laser energy was 130–140 mJ per flash with a pulse duration of 20 ns. Twelve or 40 flashes at 500 Hz were used to achieve conversion of caged ATP (phpATP or npeATP, respectively).
After sample equilibration for 2 h at 293 K, FTIR spectra between 1900 and 900 cm−1 were recorded on an IFS80v or IFS66v/s spectrometer (Bruker) equipped with a liquid nitrogen-cooled mercury cadmium telluride detector. The spectral resolution was 4 cm−1 using an aperture of 4–5 mm, a double-sided forward-backward data acquisition mode, and an instrumental scanner speed of 320 kHz. Before photolysis, a reference spectrum was taken by averaging 400 scans. After the laser flashes, which started the reaction, data were collected for 15 min. For the averaged interferograms, a zero filling factor of 2 and the Blackman-Harris three-term apodization function were used. For Fourier transformation, the Mertz phase correction was applied. Absorbance spectra and absorbance time courses (A(t)) were calculated from the single-channel spectra (I(t)) according to A(t) = −log (I(t)/I0), where I0 is the single-channel spectrum before photolysis at t = 0. The kinetics of spectral evolution between 1800 and 950 cm−1 were approximated to multiple exponentials in the period of 1 ms to 700 s by global fit analysis (42), in which the absorbance change (ΔA(ν,t)) is fitted with a sum of nr exponentials with apparent rate constants (kl) and amplitudes (al) according to Equation 3.
 |
In the amplitude spectrum al, the disappearing bands face downwards, and the appearing bands face upwards. The amplitude spectrum a0 compares the state before the triggering of the reaction by the irradiation with the state after the flashes, extrapolated to time t = 0.
RESULTS
Cloning, Expression, and Purification
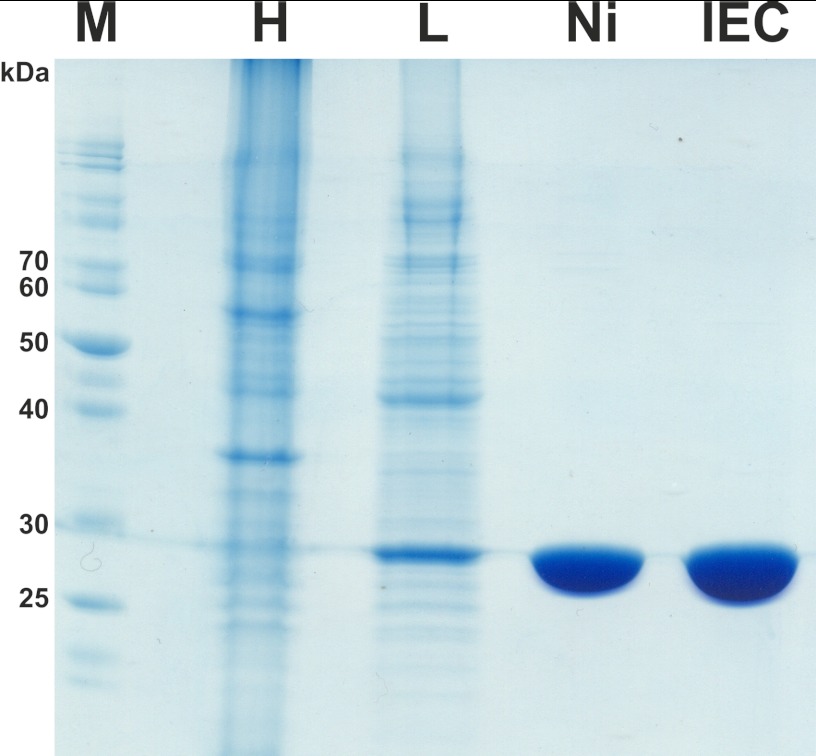
On the basis of the structure and sequence of MsbA (Protein Data Bank code 3B60 (11)), we designed several constructs for the isolated NBD. A soluble MsbA-NBD construct starting at amino acid 330 of full-length MsbA with a His10 tag at the C terminus led to good expression and purification (Fig. 2). A clear band for MsbA-NBD could already be assigned in the homogenate fraction and was enriched in the supernatant of an ultracentrifugation step. Pure MsbA-NBD could be eluted from the Ni-NTA affinity column. Remaining contaminants were eliminated with an additional anion exchange step. We can now routinely produce highly purified MsbA-NBD with a yield of 3 mg of protein from 1 liter of culture.
FIGURE 2.
SDS-PAGE of samples of purified MsbA-NBD stained with Coomassie Brilliant Blue. M, marker; H, homogenate of total cell protein; L, soluble fraction loaded onto a Ni-NTA column; Ni, Ni-NTA column eluate; IEC, ion exchange column eluate.
Catalytic Activity
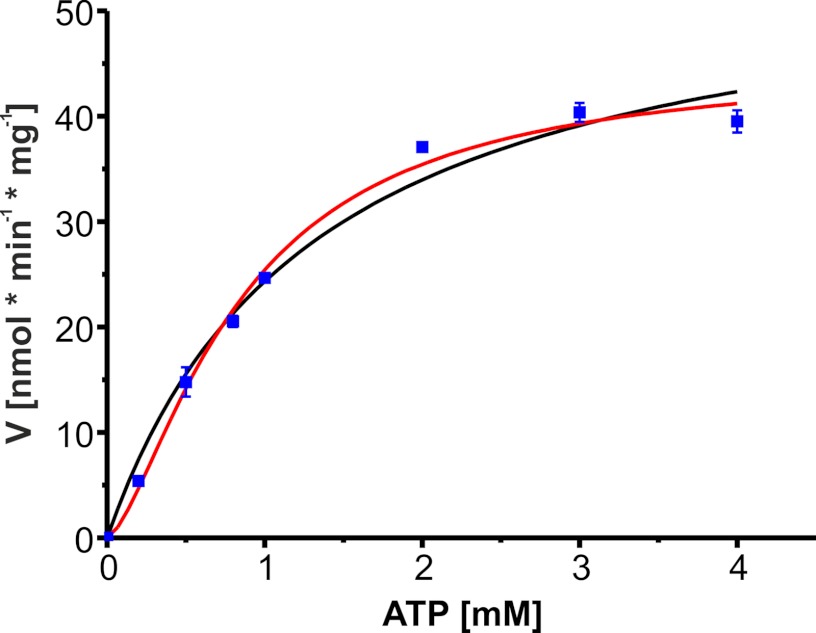
MsbA-NBD catalytic activity was assayed with both a colorimetric and a HPLC-based assay for different substrate concentrations. A typical Michaelis-Menten plot is shown in Fig. 3, resulting in a Km of 1.31 mm and an ATP catalytic activity Vmax of 56 nmol mg−1 min−1. NBDs of ABC transporters have been shown to dimerize upon ATP binding (43, 44) and have to interact for ATP hydrolysis (45). Therefore, we also checked for cooperativity by fitting the data with the Hill equation (Equation 2 and Fig. 3). This resulted in Vmax = 45 nmol mg−1 min−1, K0.5 = 0.85 mm, and a Hill coefficient of 1.49, thus demonstrating positive cooperativity of MsbA-NBD in ATP binding and hydrolysis.
FIGURE 3.
Substrate kinetics of MsbA-NBD with MgATP at 310 K. All values are triplicate determinations shown with S.D. Data were analyzed by the Michaelis-Menten equation (black line; Vmax = 56 nmol min−1 mg−1, and Km = 1.31 mm) and the Hill equation (red line; Vmax = 45 nmol min−1 mg−1, K0.5 = 0.85 mm, and napp = 1.49).
FTIR Spectroscopy
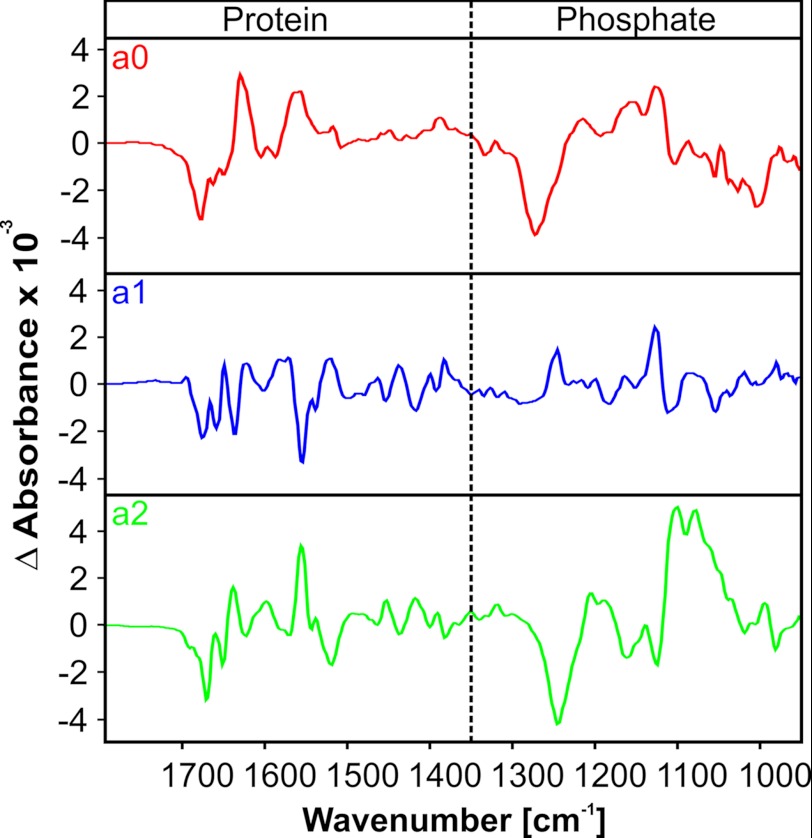
Because of the relatively slow turnover of MsbA-NBD, we employed fast scan FTIR in transmission mode, which provides millisecond time resolution (46). Concentrated samples were mounted between CaF2 windows. High quality difference spectra were recorded between 1900 and 900 cm−1 at 293 K. To initiate the hydrolysis reaction, caged phpATP (supplemental Fig. 1) was used, which liberates ATP after flash photolysis with a rate in the sub-microsecond time range below the resolution of the fast scan technique. The global fit analysis of the absorbance changes between 1800 and 950 cm−1 according to Equation 3 with two rate constants (nr = 2) resulted in a good agreement with the data, and we obtained the apparent rate constants k1 = 1.4 ± 1.2 s−1 and k2 = (10.8 ± 2.0) × 10−3 s−1 and the amplitude spectra a0, a1, and a2 (Fig. 4). In these amplitude spectra, positive bands are indicative of appearing absorbance, whereas negative bands represent loss of absorbance. In the initial amplitude spectrum a0, the dominating negative band at 1264 cm−1 represents the removal of the caged group after the laser flashes. It represents mainly the changes induced by photolysis of the caged compound. The absorbance changes in a1 in the phosphate region between 1300 and 950 cm−1 reflect a rearrangement of ATP and the binding niche after photolysis. The amplitude spectrum a2 shows clear marker bands of ATP hydrolysis and phosphate release. How these bands were assigned will be discussed next.
FIGURE 4.
Amplitude spectra a0, a1, and a2. Spectra are the averages of four single measurements. Infrared absorption of the protein at higher wave numbers is separated from the lower phosphate absorption region by the dotted line.
Phosphate Band Assignment
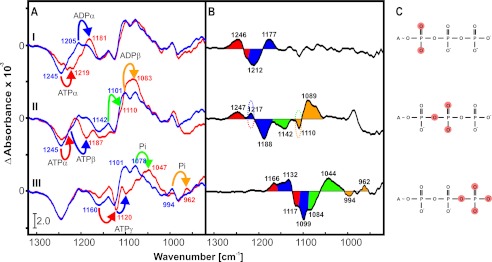
The asymmetric stretching vibrations of the phosphate groups of ATP and ADP are usually found between 1100 and 1300 cm−1 and possess a large absorption coefficient. For the assignment of these vibrations, α-, β-, or γ-18O-labeled caged ATP was used (Fig. 5). The increased mass of the substituted isotope shifts the corresponding IR band of the marked residue to lower wave numbers. Bands were normalized to the bands between 1320 and 950 cm−1. For assignment of the phosphate vibrations of NBD-ATP, NBD-ADP, and the released Pi, the a2 hydrolysis spectra of unlabeled ATP and isotope-labeled ATP were compared (Fig. 5A), and double-difference spectra were calculated (Fig. 5B). The bands of ATP are negative due to its decrease in the hydrolysis reaction, whereas the bands of hydrolysis products like ADP and Pi are positive in a2. Isotopic labeling of [α-18O2]ATP results in a downshift of the ATP educt band (red arrow) from 1245 to 1219 cm−1, whereas the emerging ADP product band (blue arrow) is shifted from 1205 to 1181 cm−1. Thus, we can assign the absorption at 1245 cm−1 to νas(α-PO2) of ATP bound to MsbA-NBD and the absorption at 1205 cm−1 to νas(α-PO2) of ADP (spectrum I in Fig. 5, A and B). The hydrolysis of [α,β-18O/β-18O2]ATP induces a shift of an educt band from 1217 to 1188 cm−1, which is marked in blue and assigned to νas(β-PO2). The original band of unlabeled ATP is masked by a shift of the 1245 cm−1 band (red) to this position as indicated by the dotted lines in the double-difference spectrum. This band was already assigned to νas(α-PO2) above and indicates some coupling between the asymmetric PO2 stretching vibration of α- and β-phosphates (spectrum II in Fig. 5, A and B). An ADP product band (orange) is shifted from 1101 to 1083 cm−1 and assigned to one of the two νas(β-PO3) vibrations. The second νas(β-PO3) vibration (green) is found at 1142 cm−1. Here, the shifted band is again masked as indicated by the dotted lines in the double-difference spectrum. Using [β,γ-18O/γ-18O3]ATP as a substrate, the ATP educt bands shift from 1160 cm−1 (red) and 1132 cm−1 (blue) to 1120 and 1099 cm−1, respectively, and are assigned to νas(γ-PO3) (spectrum III in Fig. 5, A and B). A band at ∼1078 cm−1 has previously been assigned to free Pi (31, 47, 48). This assignment is confirmed by a shift from 1078 to 1047 cm−1 (green). The less obvious band shift from 994 to 962 cm−1 (orange) can also be assigned to the release of Pi.
FIGURE 5.
A, amplitude spectra of the reaction described by k2 at 293 K. Negative bands correspond to ATP, and positive bands correspond to the hydrolysis reaction products ADP and Pi. The bar represents an absorption of 2.0 × 10⁻³. The spectra of unlabeled ATP are shown in blue, and the spectra of labeled ATP are shown in red. Band shifts are indicated by arrows and are labeled. B, double-difference spectra of the hydrolysis difference spectra shown in A. Band shifts are illustrated by different colors corresponding to the arrows in A. Dotted lines indicate bands that are masked by superposition of two different band shifts. C, illustration of 18O-labeled phosphate groups within the ATP molecule. Spectrum I, α-18O2; spectrum II, α,β-18O/β-18O2; spectrum III, β,γ-18O/γ-18O3.
A similar analysis for the a1 double-difference spectra is hampered by a partial mixing of a0 and a1 due to the relatively slow photolysis kinetics of the 1-(ortho-nitrophenyl)ethyl group used for the isotopically labeled ATP. Therefore, analysis was performed on the combined a0 + a1 spectra (supplemental Figs. 2 and 3). In these spectra, contributions of caged ATP are included as negative peaks, whereas NBD-ATP bands will appear as positive bands. Most of the key features of NBD-ATP can also be assigned in this spectrum. At 1216 cm−1, a band for the ATP νas(β-PO2) vibration can be identified, which is masked in the hydrolysis spectrum.
FTIR Kinetics
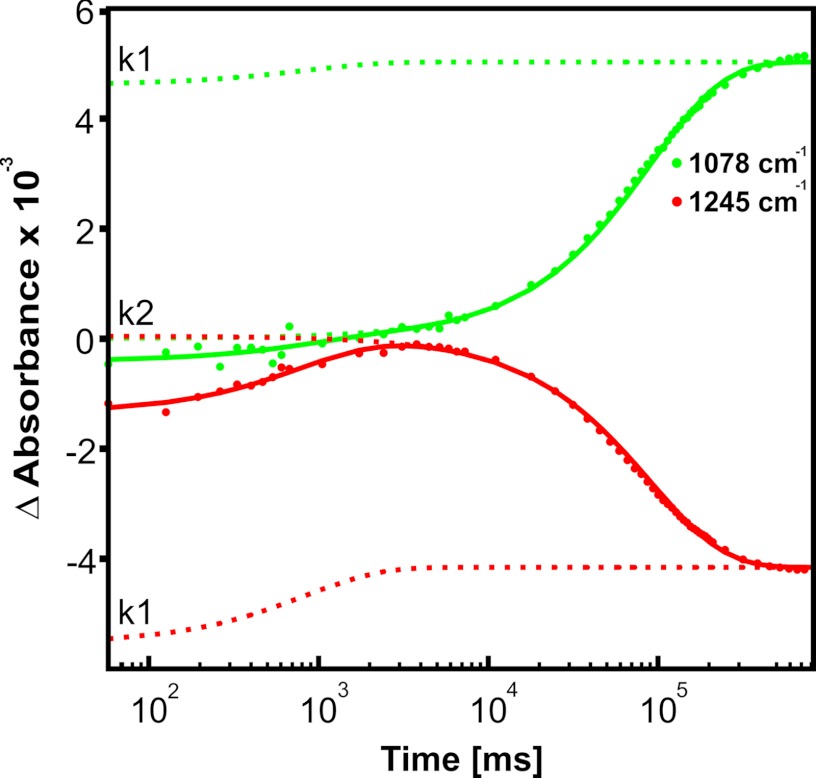
The assignment of specific phosphate marker bands allows characterization of the two rate constants in relation to hydrolysis. The well characterized free phosphate band at 1078 cm−1 clearly is related only to k2, which therefore represents the Pi release (Fig. 6). Because the marker bands for ATP at 1245 cm−1 (α and β) and 1132 cm−1 (γ) also vanish with k2, bond breakage between β- and γ-phosphates occurs with the same rate, indicating this to be the rate-limiting step for hydrolysis.
FIGURE 6.
Time course of an MsbA-NBD ATP hydrolysis reaction at 293 K. Shown are IR marker bands at 1245 and 1078 cm−1, indicating the appearance (k1) and disappearance (k2) of ATP (red) and the appearance (k2) of Pi (green). The solid line is a two-component fit of the data points, whereas the separate fit components are displayed by dotted lines.
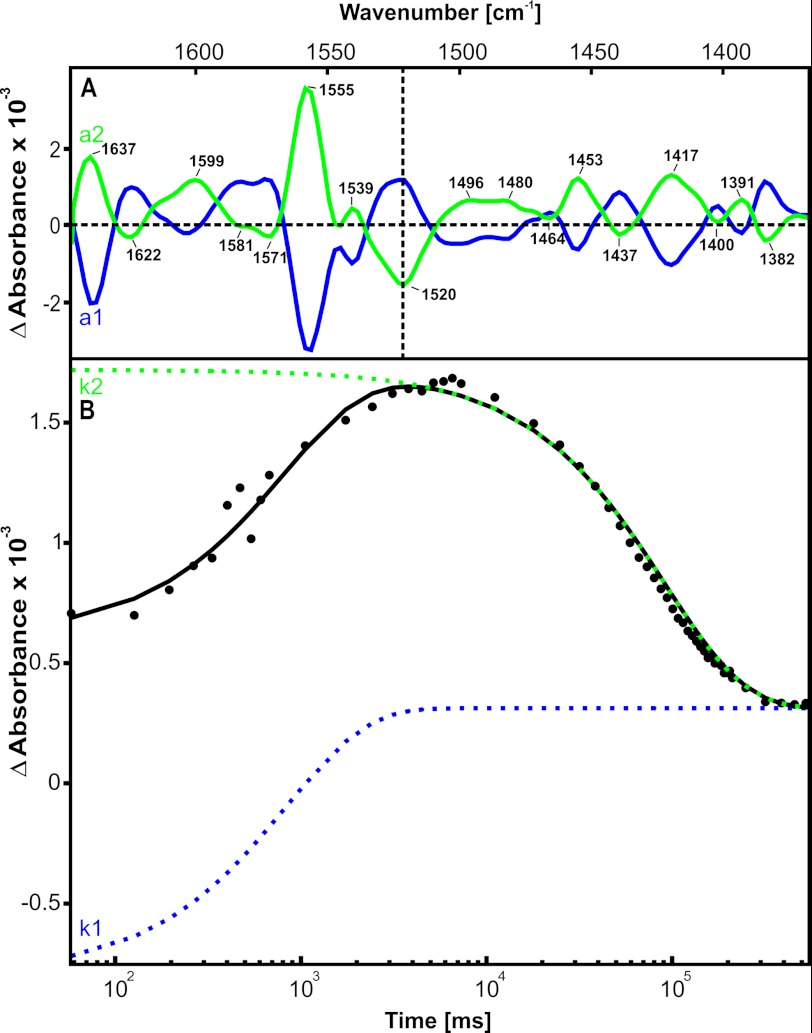
In the protein region (1720 to 1350 cm−1) of the amplitude spectra associated with k1 and k2, several strong absorption bands are visible. The near-mirror symmetry is indicative of a reversible conformational change in the protein during the catalytic cycle (Fig. 7A). All major peaks were evaluated with respect to their dominating contributions to either k1 or k2. Notably, most of the changes indeed correlate with these two rates. As a typical example, the kinetic analysis of the band at 1520 cm−1 is shown in Fig. 7B. Absorption increases with a post-photolysis/pre-hydrolysis rate of k1 = 1.4 s−1 and disappears with a rate of k2 = 10.8 × 10⁻³ s−1. Nevertheless, slight deviations from the two-rate fit are visible, pointing to additional rates involved in conformational changes of the protein. In addition, we observed absorption changes in the protein region already in a0, which represent initial nucleotide binding after ATP release. However, our current data do not allow a reproducible fit of these early events, which might be resolved with higher time resolution by utilizing the experimentally more challenging step scan technique (49). In summary, the protein region of the infrared spectra contains detailed information about residues within the NBD protein that undergo significant reversible conformational changes during the catalytic cycle.
FIGURE 7.
A, amplitude spectra of part of the protein region from 1650 to 1370 cm−1 corresponding to rates k1 (blue) and k2 (green). The major peaks are labeled. The vertical dotted line indicates band position 1520 cm−1, the kinetics of which are shown in B. B, kinetics of the 1520 cm−1 band. The solid line is the two-component fit of the data points. The separate fit components k1 and k2 are colored corresponding to their amplitude spectra (A).
DISCUSSION
Catalytic Activity
ABC transporters couple ATP hydrolysis in the motor domain with allocrite translocation in the TMD. Although the ultimate goal is to study the complete transport process in the holoprotein, a rational approach is to first characterize the ATP hydrolysis reaction in the isolated NBD. As the NBDs in ABC exporters are usually fused to the TMD, expression constructs of isolated NBDs frequently suffer from poor protein yield and solubility. Correct definition of domain boundaries has been shown to be crucial for a successful study (50). Although our first attempts to overexpress the isolated NBD of MsbA were based on erroneous crystallographic models, boundaries defined on the corrected model (11) resulted in a construct with a good expression profile and satisfactory protein solubility up to 15 mg/ml in buffer. Purified substrate-free MsbA-NBD elutes as a monomeric enzyme during size exclusion chromatography (data not shown). The ATPase activity falls within the lower range of reported activities of the full-length transporter (22, 51–54). MsbA is found to be 2–4-fold stimulated by the binding of the allocrite lipid A to the transmembrane region, which is not included in our MsbA-NBD construct (19, 51, 53). A Hill coefficient of 1.5 indicates slight cooperativity in ATP binding and is consistent with values for the isolated NBD of the hemolysin transporter HlyB (43) and the mitochondrial transporter Mdl1p (44). These data therefore clearly demonstrate that MsbA-NBD represents a functional ABC motor domain.
Nucleotide Interaction with MsbA-NBD
We used the MsbA-NBD protein to study the time course of ATP hydrolysis by FTIR spectroscopy. Utilizing caged ATP to trigger the reaction, the kinetic data can be fitted with two major rate constants after the fast (and not experimentally resolved) photolysis of the cage group. During the first experimentally resolved post-photolysis/pre-hydrolysis rate, a hydrolysis-competent conformational state is formed. This step includes formation of the canonical head-to-tail NBD dimer (Fig. 1). The second, much slower rate represents decrease in ATP, increase in protein-bound ADP, and release of free phosphate and thereby monitors the hydrolysis. On the basis of the assignment of the phosphate bands, we can draw conclusions on the nature of the bound nucleotide states: the amplitude spectra (Figs. 4 and 6) and kinetic data clearly show the formation of an ATP-enzyme reaction intermediate in the pre-hydrolysis reaction with rate k1. A similar E·S reaction intermediate has been observed in the case of P-glycoprotein (55). In the post-hydrolysis phosphate state (bands facing upwards in Fig. 4), the dominant band at 1101 cm−1 represents the asymmetric β-PO32− vibration, which is shifted 11 or 20 cm−1 with respect to free ADP or MgADP, respectively (56). A very similar shift has been found in the case of protein-bound GDP: for free GDP in solution, the asymmetric β-PO32− vibration has been measured at 1115 cm−1, which also is shifted by 11 cm−1 for Ras-bound MgGDP to 1104 cm−1 (47). Therefore, the majority of the hydrolysis product ADP remains bound to MsbA-NBD under the single-turnover conditions employed in our experiment. This is consistent with the observation that MsbA binds both ATP and ADP with similar dissociation constants of 1–2 mm (53). MsbA-NBD saturated with ADP is again monomeric in solution, as indicated by gel filtration experiments (data not shown).
Protein Dynamics
The kinetic data in the protein region also are dominated by the two rates k1 and k2. Interestingly, the corresponding amplitude spectra are nearly mirror-symmetric (Fig. 7), indicating a mostly reversible induced fit upon MgATP-protein intermediate formation. At the same time, this implies that post-photolysis and post-hydrolysis protein conformations are largely identical but are different from the reaction intermediate. Based on the analysis of NBD structures in different complexes, motion of the helical domain upon formation of the hydrolysis-competent, MgATP-bound conformation has been postulated (57, 58). In contrast, the ADP-bound structure largely resembles the nucleotide-free state. In these investigations, the conformation of MgATP-NBD had to be inferred either from hydrolysis-impaired mutant proteins or from structures with bound ATP analogues. Here, we trace these conformational transitions for the first time in a catalytically intact NBD. Our time-resolved data clearly identify the protein-bound MgATP intermediate appearing with rate k1 and monitor the resetting of the protein concomitant with the hydrolysis reaction with rate k2.
Catalytic Cycle
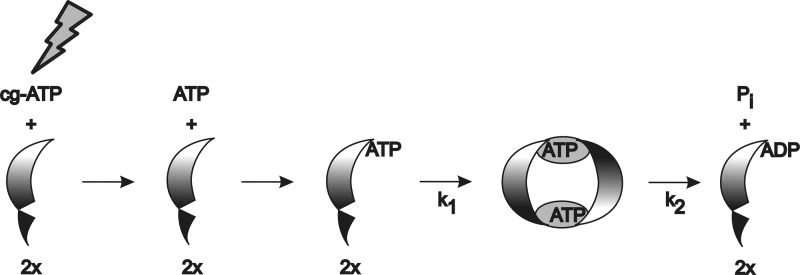
We can combine these data into the scheme shown in Fig. 8. ATP released during photolysis binds to monomeric NBD. During the experimentally resolved apparent rate k1, ATP binding triggers the rotatory movement of the helical domain and subsequent dimer formation, thereby generating the full ATP-binding pocket. These protein changes in k1 most likely represent the power stroke of transport. In follow-up experiments, site-directed mutagenesis will be used to decode these IR absorbance changes to elucidate the mechanistic details of this power stroke. Hydrolysis, release of free phosphate, and dimer dissociation can be modeled with k2. Our data do not allow the discrimination between sequential or concomitant ATP hydrolysis in both binding sites. However, no ATP remains in the sample after hydrolysis as indicated by HPLC (data not shown). The hydrolysis product ADP remains mostly bound to the protein as indicated by the specific infrared marker band appearing with rate k2.
FIGURE 8.
Scheme of ATP hydrolysis in MsbA-NBD. After photolysis of caged ATP (cg-ATP), free ATP binds to the monomeric NBD. With rate k1, domain movement of the helical domain of the NBD and dimerization lead to formation of the two catalytic binding sites. This NBD dimer is similar to the conformation in the AMP-PNP-bound full-length structure in Fig. 1. With rate k2, hydrolysis in both catalytic sites, either consecutive or parallel, results in a NBD-ADP complex, which dissociates to monomeric NBD-ADP. The cycle is halted under our single-turnover conditions. Under physiological conditions, nucleotide exchange would immediately reset the NBD to the ATP-bound monomer.
These results are in line with the processive clamp model put forth on the basis of biochemical and structural work on isolated NBDs (44, 59). Here, the power stroke is facilitated by the dimerization of the NBDs, similar to the NBD switch models generally accepted for ABC importers. Although ATP hydrolysis in both sites is proposed to be sequential, only very small conformational changes between the two hydrolysis events are predicted (59), thereby resulting in one apparent rate constant. Finally, the ADP-bound dimer dissociates, and nucleotide exchange of two ADPs with ATP resets the transporter.
Hydrolysis Limits MsbA-NBD Turnover
One important factor for understanding a catalytic cycle is the nature of the rate-limiting step. Studies on isolated NBDs of two homodimeric ABC exporters led to diverging results. For the hemolysin exporter HlyB, hydrolysis was found to be rate-limiting (60), whereas for the peptide exporter Mdl1, dimerization was the rate-limiting step (61). In both studies, the authors had to modify the catalytic cycle either by using partially inactive mutants or by substituting metal cofactors to gain information about the intermediate catalytic steps.
In our experiments, we can monitor the sequence of events for the first time online in the intact protein with the natural substrate MgATP. The experimental identification of individual spectral marker bands for the most important reaction intermediates (discussed above) allows us to unambiguously assign the ATP binding and dimerization to the fast first rate, whereas the hydrolysis and phosphate release are clearly assigned to the second rate, which is 2 orders of magnitude slower. We therefore propose that hydrolysis is the rate-limiting step in isolated ABC transporter motor domains.
It will be essential to extend our approach to the full-length transporter. Understanding the exact coupling of NBD dynamics to allocrite binding and translocation in the TMD remains the Holy Grail of ABC transporter research. Clarification will require more time-resolved FTIR studies on intact full-length transporters. To this end, we are currently working on investigation of full-length MsbA in a lipid environment.
Acknowledgment
We thank Andrè Müller for critically reading the manuscript and helpful discussions.
This work was supported by the Protein Research Department of Ruhr-Universität Bochum and Collaborative Research Center SFB 642 of the Deutsche Forschungsgemeinschaft (Teilprojekt A1 (to K. G. and C. K.) and A22 (to E. H.)).

This article contains supplemental Figs. 1–3.
- ABC
- ATP-binding cassette
- TMD
- transmembrane domain
- NBD
- nucleotide-binding domain
- phpATP
- para-hydroxyphenacyl-ATP
- npeATP
- 1-(ortho-nitrophenyl)ethyl-ATP
- Ni-NTA
- nickel-nitrilotriacetic acid
- AMP-PNP
- adenosine 5 ′-(β,γ-imido)triphosphate.
REFERENCES
- 1. Higgins C. F. (1995) The ABC of channel regulation. Cell 82, 693–696 [DOI] [PubMed] [Google Scholar]
- 2. Schmitt L., Tampé R. (2002) Structure and mechanism of ABC transporters. Curr. Opin. Struct. Biol. 12, 754–760 [DOI] [PubMed] [Google Scholar]
- 3. Davidson A. L., Dassa E., Orelle C., Chen J. (2008) Structure, function, and evolution of bacterial ATP-binding cassette systems. Microbiol. Mol. Biol. Rev. 72, 317–364 [DOI] [PMC free article] [PubMed] [Google Scholar]
- 4. Jones P. M., O'Mara M. L., George A. M. (2009) ABC transporters: a riddle wrapped in a mystery inside an enigma. Trends Biochem. Sci. 34, 520–531 [DOI] [PubMed] [Google Scholar]
- 5. Licht A., Schneider E. (2011) ATP-binding cassette systems: structures, mechanisms, and functions. Cent. Eur. J. Biol. 6, 785–801 [Google Scholar]
- 6. Kerr I. D., Jones P. M., George A. M. (2010) Multidrug efflux pumps: the structures of prokaryotic ATP-binding cassette transporter efflux pumps and implications for our understanding of eukaryotic P-glycoproteins and homologues. FEBS J. 277, 550–563 [DOI] [PubMed] [Google Scholar]
- 7. Sharom F. J. (2011) The P-glycoprotein multidrug transporter. Essays Biochem. 50, 161–178 [DOI] [PubMed] [Google Scholar]
- 8. Aller S. G., Yu J., Ward A., Weng Y., Chittaboina S., Zhuo R., Harrell P. M., Trinh Y. T., Zhang Q., Urbatsch I. L., Chang G. (2009) Structure of P-glycoprotein reveals a molecular basis for poly-specific drug binding. Science 323, 1718–1722 [DOI] [PMC free article] [PubMed] [Google Scholar]
- 9. Dawson R. J., Locher K. P. (2006) Structure of a bacterial multidrug ABC transporter. Nature 443, 180–185 [DOI] [PubMed] [Google Scholar]
- 10. Dawson R. J., Locher K. P. (2007) Structure of the multidrug ABC transporter Sav1866 from Staphylococcus aureus in complex with AMP-PNP. FEBS Lett. 581, 935–938 [DOI] [PubMed] [Google Scholar]
- 11. Ward A., Reyes C. L., Yu J., Roth C. B., Chang G. (2007) Flexibility in the ABC transporter MsbA: alternating access with a twist. Proc. Natl. Acad. Sci. U.S.A. 104, 19005–19010 [DOI] [PMC free article] [PubMed] [Google Scholar]
- 12. Doerrler W. T., Reedy M. C., Raetz C. R. (2001) An Escherichia coli mutant defective in lipid export. J. Biol. Chem. 276, 11461–11464 [DOI] [PubMed] [Google Scholar]
- 13. Eckford P. D., Sharom F. J. (2010) The reconstituted Escherichia coli MsbA protein displays lipid flippase activity. Biochem. J. 429, 195–203 [DOI] [PMC free article] [PubMed] [Google Scholar]
- 14. Reuter G., Janvilisri T., Venter H., Shahi S., Balakrishnan L., van Veen H. W. (2003) The ATP-binding cassette multidrug transporter LmrA and lipid transporter MsbA have overlapping substrate specificities. J. Biol. Chem. 278, 35193–35198 [DOI] [PubMed] [Google Scholar]
- 15. Karow M., Georgopoulos C. (1993) The essential Escherichia coli msbA gene, a multicopy suppressor of null mutations in the htrB gene, is related to the universally conserved family of ATP-dependent translocators. Mol. Microbiol. 7, 69–79 [DOI] [PubMed] [Google Scholar]
- 16. Borbat P. P., Surendhran K., Bortolus M., Zou P., Freed J. H., Mchaourab H. S. (2007) Conformational motion of the ABC transporter MsbA induced by ATP hydrolysis. PLoS Biol. 5, e271. [DOI] [PMC free article] [PubMed] [Google Scholar]
- 17. Schultz K. M., Merten J. A., Klug C. S. (2011) Characterization of the E506Q and H537A dysfunctional mutants in the E. coli ABC transporter MsbA. Biochemistry 50, 3599–3608 [DOI] [PMC free article] [PubMed] [Google Scholar]
- 18. Schultz K. M., Merten J. A., Klug C. S. (2011) Effects of the L511P and D512G mutations on the Escherichia coli ABC transporter MsbA. Biochemistry 50, 2594–2602 [DOI] [PMC free article] [PubMed] [Google Scholar]
- 19. Westfahl K. M., Merten J. A., Buchaklian A. H., Klug C. S. (2008) Functionally important ATP binding and hydrolysis sites in Escherichia coli MsbA. Biochemistry 47, 13878–13886 [DOI] [PMC free article] [PubMed] [Google Scholar]
- 20. Zou P., Bortolus M., Mchaourab H. S. (2009) Conformational cycle of the ABC transporter MsbA in liposomes: detailed analysis using double electron electron resonance spectroscopy. J. Mol. Biol. 393, 586–597 [DOI] [PMC free article] [PubMed] [Google Scholar]
- 21. Doshi R., Woebking B., van Veen H. W. (2010) Dissection of the conformational cycle of the multidrug/lipid A ABC exporter MsbA. Proteins 78, 2867–2872 [DOI] [PubMed] [Google Scholar]
- 22. Siarheyeva A., Sharom F. J. (2009) The ABC transporter MsbA interacts with lipid A and amphipathic drugs at different sites. Biochem. J. 419, 317–328 [DOI] [PMC free article] [PubMed] [Google Scholar]
- 23. Smriti, Zou P., Mchaourab H. S. (2009) Mapping daunorubicin-binding sites in the ATP-binding cassette transporter MsbA using site-specific quenching by spin labels. J. Biol. Chem. 284, 13904–13913 [DOI] [PMC free article] [PubMed] [Google Scholar]
- 24. Grimard V., Vigano C., Margolles A., Wattiez R., van Veen H. W., Konings W. N., Ruysschaert J. M., Goormaghtigh E. (2001) Structure and dynamics of the membrane-embedded domain of LmrA investigated by coupling polarized ATR-FTIR spectroscopy and 1H/2H exchange. Biochemistry 40, 11876–11886 [DOI] [PubMed] [Google Scholar]
- 25. Gustot A., Smriti, Ruysschaert J. M., Mchaourab H., Govaerts C. (2010) Lipid composition regulates the orientation of transmembrane helices in HorA, an ABC multidrug transporter. J. Biol. Chem. 285, 14144–14151 [DOI] [PMC free article] [PubMed] [Google Scholar]
- 26. Gerwert K. (1999) Molecular reaction mechanisms of proteins monitored by time-resolved FTIR spectroscopy. Biol. Chem. 380, 931–935 [DOI] [PubMed] [Google Scholar]
- 27. Cepus V., Ulbrich C., Allin C., Troullier A., Gerwert K. (1998) Fourier transform infrared photolysis studies of caged compounds. Methods Enzymol. 291, 223–245 [DOI] [PubMed] [Google Scholar]
- 28. Kötting C., Kallenbach A., Suveyzdis Y., Wittinghofer A., Gerwert K. (2008) The GAP arginine finger movement into the catalytic site of Ras increases the activation entropy. Proc. Natl. Acad. Sci. U.S.A. 105, 6260–6265 [DOI] [PMC free article] [PubMed] [Google Scholar]
- 29. Chakrabarti P. P., Daumke O., Suveyzdis Y., Kötting C., Gerwert K., Wittinghofer A. (2007) Insight into catalysis of a unique GTPase reaction by a combined biochemical and FTIR approach. J. Mol. Biol. 367, 983–995 [DOI] [PubMed] [Google Scholar]
- 30. Brucker S., Gerwert K., Kötting C. (2010) Tyr-39 of Ran preserves the Ran·GTP gradient by inhibiting GTP hydrolysis. J. Mol. Biol. 401, 1–6 [DOI] [PubMed] [Google Scholar]
- 31. Völlmecke C., Kötting C., Gerwert K., Lübben M. (2009) Spectroscopic investigation of the reaction mechanism of CopB-B, the catalytic fragment from an archaeal thermophilic ATP-driven heavy metal transporter. FEBS J. 276, 6172–6186 [DOI] [PubMed] [Google Scholar]
- 32. Stolz M., Lewitzki E., Bergbauer R., Mäntele W., Grell E., Barth A. (2009) Structural changes in the catalytic cycle of the Na+,K+-ATPase studied by infrared spectroscopy. Biophys. J. 96, 3433–3442 [DOI] [PMC free article] [PubMed] [Google Scholar]
- 33. Troullier A., Gerwert K., Dupont Y. (1996) A time-resolved Fourier transform infrared difference spectroscopy study of the sarcoplasmic reticulum Ca2+-ATPase: kinetics of the high affinity calcium binding at low temperature. Biophys. J. 71, 2970–2983 [DOI] [PMC free article] [PubMed] [Google Scholar]
- 34. Barth A. (2008) Structural dynamics of the Ca2+-ATPase studied by time-resolved infrared spectroscopy. Spectroscopy 22, 63–82 [Google Scholar]
- 35. Jun B., Kim S. (2010) Real-time structural transitions are coupled to chemical steps in ATP hydrolysis by Eg5 kinesin. J. Biol. Chem. 285, 11073–11077 [DOI] [PMC free article] [PubMed] [Google Scholar]
- 36. Park C. H., Givens R. S. (1997) New photoactivated protecting groups. 6. p-Hydroxyphenacyl: a phototrigger for chemical and biochemical probes. J. Am. Chem. Soc. 119, 2453–2463 [Google Scholar]
- 37. Walker J. W., Reid G. P., McCray J. A., Trentham D. R. (1988) Photolabile 1-(2-nitrophenyl)ethyl phosphate esters of adenine nucleotide analogues. Synthesis and mechanism of photolysis. J. Am. Chem. Soc. 110, 7170–7177 [Google Scholar]
- 38. Du X., Frei H., Kim S. H. (2000) The mechanism of GTP hydrolysis by Ras probed by Fourier transform infrared spectroscopy. J. Biol. Chem. 275, 8492–8500 [DOI] [PubMed] [Google Scholar]
- 39. Goody R. S. (1982) A simple and rapid method for the synthesis of nucleoside 5′-monophosphates enriched with 17O or 18O on the phosphate group. Anal. Biochem. 119, 322–324 [DOI] [PubMed] [Google Scholar]
- 40. Hoard D. E., Ott D. G. (1965) Conversion of mono- and oligodeoxyribonucleotides to 5′-triphosphates. J. Am. Chem. Soc. 87, 1785–1788 [DOI] [PubMed] [Google Scholar]
- 41. Serrano R. (1988) H+-ATPase from plasma membranes of Saccharomyces cerevisiae and Avena sativa roots: purification and reconstitution. Methods Enzymol. 157, 533–544 [DOI] [PubMed] [Google Scholar]
- 42. Hessling B., Souvignier G., Gerwert K. (1993) A model-independent approach to assigning bacteriorhodopsin's intramolecular reactions to photocycle intermediates. Biophys. J. 65, 1929–1941 [DOI] [PMC free article] [PubMed] [Google Scholar]
- 43. Benabdelhak H., Schmitt L., Horn C., Jumel K., Blight M. A., Holland I. B. (2005) Positive cooperative activity and dimerization of the isolated ABC ATPase domain of HlyB from Escherichia coli. Biochem. J. 386, 489–495 [DOI] [PMC free article] [PubMed] [Google Scholar]
- 44. Janas E. (2003) The ATP hydrolysis cycle of the nucleotide-binding domain of the mitochondrial ATP-binding cassette transporter Mdl1p. J. Biol. Chem. 278, 26862–26869 [DOI] [PubMed] [Google Scholar]
- 45. Nikaido K., Liu P. Q., Ames G. F. (1997) Purification and characterization of HisP, the ATP-binding subunit of a traffic ATPase (ABC transporter), the histidine permease of Salmonella typhimurium. Solubility, dimerization, and ATPase activity. J. Biol. Chem. 272, 27745–27752 [DOI] [PubMed] [Google Scholar]
- 46. Gerwert K., Souvignier G., Hess B. (1990) Simultaneous monitoring of light-induced changes in protein side group protonation, chromophore isomerization, and backbone motion of bacteriorhodopsin by time-resolved Fourier transform infrared spectroscopy. Proc. Natl. Acad. Sci. U.S.A. 87, 9774–9778 [DOI] [PMC free article] [PubMed] [Google Scholar]
- 47. Allin C., Gerwert K. (2001) Ras catalyzes GTP hydrolysis by shifting negative charges from γ- to β-phosphate as revealed by time-resolved FTIR difference spectroscopy. Biochemistry 40, 3037–3046 [DOI] [PubMed] [Google Scholar]
- 48. Klähn M., Mathias G., Kötting C., Nonella M., Schlitter J., Gerwert K., Tavan P. (2004) IR spectra of phosphate ions in aqueous solution: predictions of a DFT/MM approach compared with observations. J. Phys. Chem. A 108, 6186–6194 [Google Scholar]
- 49. Rammelsberg R., Boulas S., Chorongiewski H., Gerwert K. (1999) Set-up for time-resolved step scan FTIR spectroscopy of noncyclic reactions. Vibrational Spectroscopy 19, 143–149 [Google Scholar]
- 50. Kerr I. D., Berridge G., Linton K. J., Higgins C. F., Callaghan R. (2003) Definition of the domain boundaries is critical to the expression of the nucleotide-binding domains of P-glycoprotein. Eur. Biophys. J. 32, 644–654 [DOI] [PubMed] [Google Scholar]
- 51. Doerrler W. T., Raetz C. R. (2002) ATPase activity of the MsbA lipid flippase of Escherichia coli. J. Biol. Chem. 277, 36697–36705 [DOI] [PubMed] [Google Scholar]
- 52. Kawai T., Caaveiro J. M., Abe R., Katagiri T., Tsumoto K. (2011) Catalytic activity of MsbA reconstituted in nanodisc particles is modulated by remote interactions with the bilayer. FEBS Lett. 585, 3533–3537 [DOI] [PubMed] [Google Scholar]
- 53. Eckford P. D., Sharom F. J. (2008) Functional characterization of Escherichia coli MsbA: interaction with nucleotides and substrates. J. Biol. Chem. 283, 12840–12850 [DOI] [PubMed] [Google Scholar]
- 54. Zou P., Mchaourab H. S. (2009) Alternating access of the putative substrate-binding chamber in the ABC transporter MsbA. J. Mol. Biol. 393, 574–585 [DOI] [PMC free article] [PubMed] [Google Scholar]
- 55. Sauna Z. E., Kim I. W., Nandigama K., Kopp S., Chiba P., Ambudkar S. V. (2007) Catalytic cycle of ATP hydrolysis by P-glycoprotein: evidence for formation of the E·S reaction intermediate with ATPγS, a nonhydrolyzable analogue of ATP. Biochemistry 46, 13787–13799 [DOI] [PubMed] [Google Scholar]
- 56. Takeuchi H., Murata H., Harada I. (1988) Interaction of adenosine 5′-triphosphate with Mg2+: vibrational study of coordination sites by use of 18O-labeled triphosphates. J. Am. Chem. Soc. 110, 392–397 [Google Scholar]
- 57. Karpowich N., Martsinkevich O., Millen L., Yuan Y. R., Dai P. L., MacVey K., Thomas P. J., Hunt J. F. (2001) Crystal structures of the MJ1267 ATP-binding cassette reveal an induced-fit effect at the ATPase active site of an ABC transporter. Structure 9, 571–586 [DOI] [PubMed] [Google Scholar]
- 58. Oswald C., Holland I. B., Schmitt L. (2006) The motor domains of ABC-transporters. What can structures tell us? Naunyn-Schmiedeberg's Arch. Pharmacol. 372, 385–399 [DOI] [PubMed] [Google Scholar]
- 59. Zaitseva J., Oswald C., Jumpertz T., Jenewein S., Wiedenmann A., Holland I. B., Schmitt L. (2006) A structural analysis of asymmetry required for catalytic activity of an ABC-ATPase domain dimer. EMBO J. 25, 3432–3443 [DOI] [PMC free article] [PubMed] [Google Scholar]
- 60. Zaitseva J., Jenewein S., Wiedenmann A., Benabdelhak H., Holland I. B., Schmitt L. (2005) Functional characterization and ATP-induced dimerization of the isolated ABC domain of the hemolysin B transporter. Biochemistry 44, 9680–9690 [DOI] [PubMed] [Google Scholar]
- 61. van der Does C., Presenti C., Schulze K., Dinkelaker S., Tampé R. (2006) Kinetics of the ATP hydrolysis cycle of the nucleotide-binding domain of Mdl1 studied by a novel site-specific labeling technique. J. Biol. Chem. 281, 5694–5701 [DOI] [PubMed] [Google Scholar]


