

Abstract
Brugada syndrome (BrS) is associated with ventricular tachycardia originating particularly in the right ventricle (RV). We explore electrophysiological features predisposing to such arrhythmic tendency and their possible RV localization in a heterozygotic Scn5a+/− murine model. Nav1.5 mRNA and protein expression were lower in Scn5a+/− than wild-type (WT), with a further reduction in the RV compared with the left ventricle (LV). RVs showed higher expression levels of Kv4.2, Kv4.3 and KChIP2 in both Scn5a+/− and WT. Action potential upstroke velocity and maximum Na+ current (INa) density were correspondingly decreased in Scn5a+/−, with a further reduction in the RV. The voltage dependence of inactivation was shifted to more negative values in Scn5a+/−. These findings are predictive of a localized depolarization abnormality leading to slowed conduction. Persistent Na+ current (IpNa) density was decreased in a similar pattern to INa. RV transient outward current (Ito) density was greater than LV in both WT and Scn5a+/−, and had larger time constants of inactivation. These findings were also consistent with the observation that AP durations were smallest in the RV of Scn5a+/−, fulfilling predictions of an increased heterogeneity of repolarization as an additional possible electrophysiological mechanism for arrhythmogenesis in BrS.
Keywords: sodium channel, potassium channel, arrhythmia mechanisms, animal models, Brugada syndrome
2. Introduction
Brugada syndrome is characterized by increased clinical risks of ventricular tachycardia (VT). It has been associated with a loss of Na+ channel function. Clinical studies suggest that BrS is an RV disease resulting in an electrocardiographic, right precordial, ST elevation, right bundle branch block and changes specific to RV epicardial AP waveforms [1]. A range of mechanisms may contribute to this arrhythmic phenotype. In addition to potential contributions from fibrotic change and reduced connexin expression [2], electrophysiological abnormalities could result in either abnormal depolarization [3] or repolarization [4]. For example, reduced INa could decrease conduction velocity. Abnormal Na+ expression and function may also affect action potential (AP) duration: while the transient Na+ current inactivates within a few milliseconds, a slowly inactivating component, IpNa, could potentially play an important role in AP repolarization [5]. Although small, its persistence over the time course of an AP could transfer quantities of charge comparable with those carried by the transient current [5]. Finally, repolarization abnormalities could also result from reductions in the IpNa relative to the early repolarizing Ito, with or without accompanying changes in Ito.
The present study tests a prediction that one or more of the latter electrophysiological abnormalities might be preferentially localized to the RV at the cellular and molecular level, and thereby give rise to the arrhythmic phenotype seen at the clinical or whole heart level. It thus explores for preferential alterations in INa and IK expression in the RV in a murine heterozygotic Scn5a+/− model for BrS. Previous studies have either relied on largely non-invasive experiments in humans or on a canine pharmacological wedge preparation in which the BrS phenotype was replicated by multiple pharmacological interventions. In contrast, although BrS is a genetically heterogeneous condition, up to 30 per cent of patients have mutations in the SCN5A gene [6]. Thus far, it is the only gene that has been extensively studied in connection with BrS. Furthermore, the mouse model closely reproduces many of the key human features of BrS, including ST elevation [7], and both slowed conduction and repolarization heterogeneities leading to ventricular arrhythmogenesis originating in the RV, as demonstrated in mapping experiments [8]. It also shows the complex range of further phenotypes that include sick sinus syndrome and progressive conduction disorders associated with the clinical SCN5A gene modification [9]. Finally, Scn5a+/− hearts show fibrosis and reduced connexin expression that worsens with age [2], in line with similar clinical findings [10]. This appears to affect the RV to a greater extent than the LV, leading to a greater degree of conduction slowing in the RV and thus possibly contributing to the predisposition of the RV to re-entrant arrhythmias [3].
However, despite a detailed description of the electrophysiological abnormalities in the Scn5a+/− mice, so far no direct link has been made between the loss of Na+ channel function and the predilection for arrhythmias to be initiated in the RV. The only proved effective treatment of BrS so far is an implantable cardioverter–defibrillator, which is limited by low appropriate shock rates and device-related complications [11]. Further clarification of the relationship between arrhythmias and their basis in ion channel properties and localization could prove crucial in planning possible new pharmacological therapies for BrS. The present experiments investigate the relative expression and function of Na+ and K+ channels in the LV and RV of WT and Scn5a+/− hearts for the first time, and hence assess their contributions to conduction slowing and repolarization heterogeneities in the arrhythmogenic mechanism of BrS.
3. Methods
3.1. Experimental animals
Mice aged three to five months were obtained from breeding pairs of heterozygote Scn5a+/− and WT inbred 129/sv mice. Hearts from all groups were subject to identical experimental procedures, permitting their comparison. WT mice were initially supplied by Harlan (UK), and Scn5a+/− mice were originally generated from these as described previously [12]. Mice were killed by cervical dislocation, in compliance with the UK Animals (Scientific Procedures) Act 1986. The investigation conforms to the Guide for the Care and Use of Laboratory Animals and was performed under licences approved by local ethical committees and issued by the UK Home Office.
3.2. Real time reverse transcriptase-PCR
To quantify changes in the mRNA expression levels of Na+ channel α-subunits and a range of K+ channels in murine hearts, real time reverse transcriptase-PCR (RT-PCR) experiments were performed on an ABI 7500 Fast Cycler (Applied Biosystems, Warrington, UK). Total RNA was isolated from the LV and RV of WT and Scn5a+/− mice (n = 4 each) using a Qiagen RNAeasy kit. Excised tissues were stored in RNAlater (Ambion, Warrington, UK) to maintain the integrity of the RNA before isolation. The total RNA was reverse transcribed into cDNA using random hexamer primers and a SuperScript III kit (Invitrogen, Paisley, UK). Oligos for Scn5a were fluorescein amidite (FAM) labelled (Applied Biosystems). All experiments were performed in duplicate.
The number of copies of mRNA was calculated from its respective threshold cycle (CT) using a standard curve. The 2−ΔΔCT method [13] was used to calculate gene expression relative to the expression of the housekeeper gene, glyceraldehyde-3-phosphate dehydrogenase (GAPDH). These values were then normalized to the mean Nav1.5 gene expression in the LV of the WT mice.
3.3. Western blots
Hearts were excised and placed in ice-cold Krebs–Henseleit buffer containing: 119 mM NaCl, 25 mM NaHCO3, 4 mM KCl, 1.2 mM KH2PO4, 1 mM MgCl2, 1.8 mM CaCl2, 10 mM glucose and 2 mM sodium pyruvate (pH 7.4). The ventricles were removed and the LV and RV free walls were isolated and flash-frozen. The tissues were ground in liquid nitrogen with a pestle and mortar. They were then homogenized using a Dounce homogenizer (Jencons, Lutterworth, UK) in ice-cold lysis buffer containing: 50 mM Tris pH 8.0, 150 mM NaCl, 1 per cent NP40, 0.2 per cent SDS, 0.5 per cent Na Deoxycholate, 1 mM EDTA and complete protease inhibitor cocktail (Roche, Burgess Hill, UK), and rotated for 1 h at 4°C. The samples were then centrifuged at 2000g for 10 min and the supernatant kept. The pellet was resuspended in lysis buffer and recentrifuged at 2000g for a further 10 min, and the second supernatant added to the first. The combined supernatants were then ultracentrifuged at 100 000g for 1 h, and the pellet suspended in buffer containing: 4 mM HEPES, 320 mM sucrose and complete protease inhibitor cocktail. The protein concentration of each sample was established using a Pierce bicinchoninic acid assay kit (Thermo Scientific, Rockford, USA), using microplate assays in triplicate.
All equipment and consumables mentioned in this paragraph are from Invitrogen unless otherwise stated. Protein samples were mixed with 4x NuPAGE LDS sample buffer, 10x β-mercaptoethanol and H2O, and were heated at 70°C for 10 min. XCell SureLock Mini-Cells were used to run gel electrophoresis. One of two sets of electrophoresis conditions were used depending on whether the protein to be analysed was of high or low molecular weight. For high molecular weight proteins, electrophoresis was carried out using NuPAGE Novex 3 to 8 per cent Tris-Acetate gels at 30 V for 90 min, and then at 140 V overnight at 4°C with NuPAGE Tris-Acetate running buffer and NuPAGE antioxidant, alongside a Hi-Mark pre-stained high-molecular-weight protein standard. For low-molecular-weight proteins, electrophoresis was carried out using NuPAGE Novex 4 to 12 per cent Bis-Tris gels at 140 V for 2 h with NuPAGE MES SDS running buffer and NuPAGE antioxidant, alongside a pre-stained protein standard. Twenty mM of total protein was loaded in each lane. Protein bands were transferred onto polyvinylidene difluoride (PVDF) membranes by an XCell II Blot Module, with NuPAGE transfer buffer, 10 per cent methanol and NuPAGE antioxidant, at 100 mA overnight at 4°C. Membranes were blocked for 5 h in 5 per cent BSA-phosphate-buffered saline (PBS)—1 per cent Tween, prior to overnight incubation at 4°C with primary antibody. Antibodies used were to Nav1.5 (1:500, ASC005, Caltag Medisystems, Alomone, Israel), and Kv1.5, Kv4.2, Kv4.3, Kir2.1, Kv1.4 and KChIP2 (1:1000, Abcam, UK). The membranes were incubated for 1 h at room temperature with secondary antibody conjugated with horseradish peroxidase from Sigma-Aldrich (Poole, Dorset, UK). Western blot development was performed with Amersham ECL-plus reagents (Amersham Biosciences, Amersham, UK).
To confirm equal protein loading, the PVDF membranes were stripped by incubation in stripping buffer (200 mM glycine, 1% SDS, 1% Tween, adjusted to pH 2.2) and then rinsed first with PBS and then with PBS-1 per cent Tween. The membranes were then reblocked, and incubated overnight with antibody to either heavy chain cardiac myosin (1:200, ab50967, Abcam, Cambridge, UK) for high-molecular weight-proteins, or to GAPDH (1:5000, ab9482, Abcam) for low-molecular-weight proteins. Secondary antibody incubation and detection were carried out as above. Radiographs were scanned and areas of interest cropped. Band intensity was calculated using ImageJ (NIH, Bethesda, USA), and plots drawn of protein expression normalized to either heavy chain myosin or GAPDH expression.
3.4. Ventricular myocyte isolation
Myocytes were isolated as previously described [14]. Mouse hearts were rapidly removed and placed in ice-cold normal Tyrode (NT) solution containing: 140 mM NaCl, 6 mM KCl, 1 mM MgCl2, 1 mM CaCl2, 10 mM glucose, 10 mM HEPES, pH adjusted to 7.4 with 2 M NaOH. The ascending aorta was cannulated with a blunted 21 g needle. The heart was then retrogradely perfused for 2–3 min at 37°C with NT solution followed by a further 5 min in low Ca2+ (LC) solution containing: 120 mM NaCl, 5.4 mM KCl, 5 mM MgSO4, 0.045 mM CaCl2, 5 mM sodium pyruvate, 20 mM glucose, 20 mM taurine, 10 mM HEPES, 5 mM nitrilotriacetic acid, bubbled with 100% O2; pH 6.96. The solution was changed to an enzyme solution (ES) containing: 120 mM NaCl, 5.4 mM KCl, 5 mM MgSO4, 0.2 mM CaCl2, 5 mM sodium pyruvate, 20 mM glucose, 20 mM taurine, 10 mM HEPES, bubbled with 100% O2; pH 7.4 with addition of protease (4 U ml−1, Sigma) for 1 min, followed by perfusion for 8 min with ES solution containing collagenase (0.8 mg ml−1; Worthington) and hyaluronidase (0.5 mg ml−1, Sigma). At this stage, the heart was swollen and flaccid but with anatomy still intact. The free walls of the LV and RV were then separated and cut into small pieces using a scalpel blade. The tissue was then agitated for a further 5 min in ES solution. This suspension was gently triturated using a pipette, filtered and resuspended in ES solution. Myocytes were stored in ES solution at room temperature and used within 7–8 h of isolation. Isolated myocytes were checked under a light microscope to confirm cell integrity. Live myocytes appeared as smooth and rod-shaped cells.
3.5. Electrophysiology measurements
3.5.1. Measurement of action potentials
Cells were superfused with NT solution at 37°C and studied using a perforated patch technique using an Axon 2B amplifier (Axon Instruments, CA, USA). The pipette resistance was 1–2 MΩ, and the pipette-filling solution contained: 125 mM KCH3O3S, 20 mM KCl, 10 mM NaCl, 10 mM HEPES, 5 mM MgCl2, pH 7.2 with KOH, plus amphotericin-B (final concentration 240 μg ml−1). APs were measured in current-clamp mode after stimulation at 1, 3 and 5 Hz using a 1 ms, 1.2–1.4 nA pulse. The APs measured were analysed using pClamp v. 10 software (Molecular Devices, USA), and averaged over 30 consecutive beats. Traces were then averaged with reference to the stimulation signal, and times to 50 per cent (APD50), 70 per cent (APD70) and 90 per cent repolarization (APD90) were taken as a measure of the AP duration for comparison between groups. Maximum upstroke velocity was measured as the maximum gradient of the upstroke of the AP waveform.
3.5.2. Current density measurements
For all current density measurements, the whole-cell configuration of the patch-clamping technique was employed using a Multiclamp 700A amplifier (Molecular Devices). Borosilicate glass pipettes (0.86 mm outer diameter; Harvard Apparatus, Kent, UK) were used, with a resistance of 1.5–2.5 MΩ. All the experiments were performed at 37°C, apart from those measuring the fast Na+ current, which were performed at a constant room temperature of 22°C. The rate of superfusion was 2–3 ml min−1. Miniature solenoid valves (The Lee Company, Essex, UK) were used to produce fast changes in superfusate. All the recordings were done after 3 min of membrane rupture, after which time pilot experiments demonstrated stable voltage dependency of currents. Each set of measurements took approximately 5 min to complete. Capacitance and 80 to 90 per cent series resistance compensation was performed prior to each recording. Only cells with initial resting potentials between −70 and −80 mV, initial seal resistances greater than 5 GΩ with stable residual series resistances less than 1 MΩ, and low leakage currents (less than 0.1 nA at −120 mV) were studied. Cell stability in the course of the experiments was further followed by comparing transients from the same (largest) voltage steps at successive times during the protocol.
The currents obtained were filtered at a 10 kHz high–frequency cut-off (four pole Bessel filter) and digitized at 100 kHz using pClamp software.
The membrane capacitance (in picofarad) of each cell was initially measured by integrating the area under a capacitative transient induced by a 10 mV hyperpolarizing clamp step (from −80 to −90 mV) and dividing this area by the voltage step. There were no significant differences in mean cell capacitance between groups (122.4 ± 6 pF in WT LV, 119.5 ± 7 pF in WT RV, 129.3 ± 6 pF in Scn5a+/− LV and 126.6 ± 9 pF in Scn5a+/− RV; n = 36; p > 0.05). All the currents were then normalized to the whole-cell capacitance for cross-group comparisons.
3.6. Na+ current, INa
The fast Na+ current INa was measured using a technique previously described [15]. Pipettes were filled with: 70.26 mM CsCl, 24.74 mM Cs-aspartate, 10 mM HEPES, 1 mM Na2ATP, 4 mM MgATP, 1.37 mM MgCl2 and 10 mM Cs-BAPTA, adjusted to pH 7.2 using CsOH. Cells were initially perfused with NT solution containing 200 μM Cd2+. To achieve optimum voltage control, Na+ currents were recorded in a low [Na+] solution. This solution contained: 10 mM NaCl, 140 mM CsCl, 10 mM glucose, 10 mM HEPES, 1 mM MgCl2 and 1 mM CaCl2, adjusted to pH 7.4 using CsOH. Na+ currents were initially measured before and after perfusion with 10 μM tetrodotoxin (TTX), and the TTX sensitive current calculated; however, pilot studies showed that under our experimental conditions, TTX eliminated the whole current being studied, and therefore showed that we were specifically recording the Na+ current before addition of TTX (figure 4). Capacitance subtraction was not performed and thus recordings demonstrated an initial spike; however, this was fast enough not to interfere with the subsequent Na+ current and the pilot studies using TTX subtraction eliminated the spike, thus demonstrating that it was due entirely to the capacitative transient.
Figure 4.
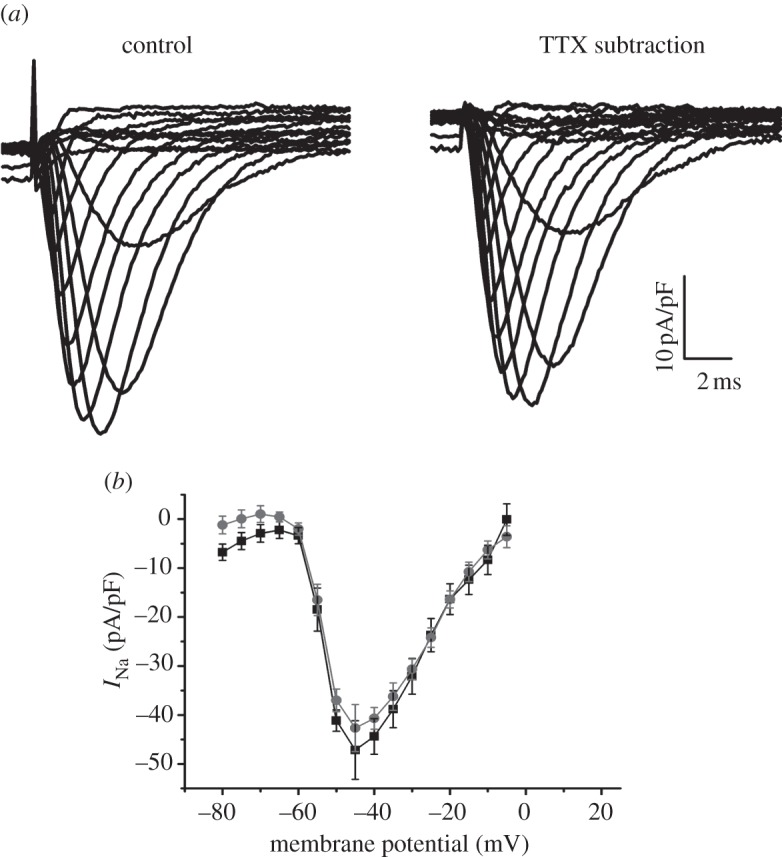
(a) Example trace of an INa current from a myocyte from the LV of a WT heart, before addition of 10 μM TTX, and then with TTX subtraction. (b) I–V curve for the two conditions (squares, control; circles, TTX substraction), with no significant differences (n = 4).
The currents obtained were filtered at a 10 kHz high-frequency cut off and digitized at 100 kHz using pClamp software. In each experiment, the series resistance was compensated by 80 to 90 per cent and each protocol used a holding potential of −120 mV. The equilibrium potential for Na+ was calculated from the Nernst equation to be +40 mV, which was confirmed through initial experiments recording voltage steps to this level. For fast Na+ current recordings, the mean values of residual series resistance after 80 to 90 per cent compensation were 0.53 ± 0.1 MΩ for WT LV, 0.49 ± 0.1 MΩ for WT RV, 0.64 ± 0.1 MΩ for Scn5a+/− LV and 0.67 ± 0.1 MΩ for Scn5a+/− RV. The current required to keep the cells at holding potential was 0.2 ± 0.01 nA, resulting in a voltage error at the holding potential less than 0.1 mV. The peak values of current flowing during the voltage steps were 5.4 ± 0.1 nA for WT LV, 5.3 ± 0.1 nA for WT RV, 4.1 ± 0.1 nA for Scn5a+/− LV and 2.7 ± 0.1 nA for Scn5a +/− RV. Thus, peak voltage error resulting from residual series resistance was 2.9 ± 0.1 mV for WT LV, 2.6 ± 0.1 mV for WT RV, 2.6 ± 0.1 mV for Scn5a+/− LV and 1.8 ± 0.1 mV for Scn5a+/− RV. If experiments demonstrated evidence of inadequate voltage control (e.g. a ‘threshold phenomenon’ near the voltage range for Na+ channel activation) data were discarded. The absence of crossover of the current traces as the current magnitude was changed and the shape of the current–voltage (I–V) relationship remaining unchanged for difference peak current values further suggest adequate voltage control [16,17].
First, the voltage dependence of activation was studied by applying depolarizing pulses of 250 ms duration over a series of voltage steps from a fixed holding voltage of −120 mV, in 5 mV increments, to +20 mV. The peak current densities (pA/pF) were calculated by dividing the peak currents amplitude by Cm and the I–V relationship plotted. The values of peak Na+ conductance (gNa) were determined from the equation
as first described by Hodgkin et al. [18] as a linear approximation of the Goldman–Hodgkin–Katz equation and subsequently used extensively in patch clamp analysis of cardiac myocytes [15,19–21], where INa is the peak current density and the ENa is the [Na+] reversal potential. The gNa values calculated from each myocyte were normalized against the corresponding peak gNa value. When plotted against the test-pulse voltage, the data assumed a sigmoid function, increasing with membrane potential.
The voltage dependence of steady-state inactivation was also examined using conditioning pre-pulses of 500 ms duration. These variable pre-pulses were applied over a voltage range from −140 to −30 in 5 mV increments. Each pre-pulse was followed by a constant test pulse to −20 mV at a duration of 20 ms. Normalized currents were then plotted against the pre-pulse voltage. The data assumed a sigmoid function, decreasing with membrane potential. Both inactivation and activation data were fitted with a single Boltzmann function, as used extensively in previous studies [15,20–24], of the form:
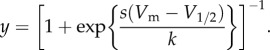 |
For activation curves, the y-values correspond to the normalized conductance values and constant s equals −1. For inactivation curves, the y-values correspond to the normalized current values and constant s equals +1. This yields the half-maximal voltage (V1/2) and exponential slope factor (k) values.
3.6.1. Persistent Na+ current
The persistent Na+ current (IpNa) was measured using a technique previously described [25]. Cells were superfused at 37°C with modified NT solution, with K+ substituted with Cs+, and containing 10 μM nifedipine (Sigma, Poole, UK), 100 μM strophantidin (Sigma) and 30 μM niflumic acid (Sigma). The pipette filling solution contained: 115 mM Cs-aspartate, 20 mM TEA-Cl, 10 mM EGTA, 10 mM HEPES, 5 mM MgATP, pH 7.2. From a holding potential of −100 mV, increasing voltage (20 mV) steps from −80 mV to +20 mV for 1 s were applied with a cycle length of 5 s. The protocol was repeated in the presence of 20 μM TTX (Alomone Labs., Israel), and the TTX-sensitive current was analysed. IpNa density was taken as the average current between 30 and 80 ms after depolarization and normalized to cell capacitance. This period was chosen because this is approximately the range of APDs measured in our experiments.
3.6.2. Transient outward current, Ito
The transient outward current Ito was measured using a technique previously described [26]. Cells were superfused with NT solution containing 200 μM Cd2+ and the pipette-filling solution contained: 120 mM K-glutamate, 10 mM KCl, 2 mM MgCl2, 10 mM HEPES, 5 mM EGTA, 2 mM Mg-ATP, pH 7.2 with KOH at 37°C. Pipette resistance was 1.5–2.5 MΩ. Ito was elicited by increasing voltage steps (1 s duration) from −40 mV to +70 mV with a cycle length of 5 s in increments of 10 mV. In these studies, the transient outward current was separated from the other currents by the following procedures. The holding potential was held at −40 mV to inactivate the sodium current. ICa was largely blocked by 0.2 mM CdCl2 included in the recording solution. EGTA was included in the pipette solution to minimize Ca2+-induced inactivation. Ito was taken as the peak of the transient outward current Ito,peak from which the steady-state current Iss had been subtracted. While IKs may also demonstrate inactivation, studies have shown that this plays a relatively minor role in repolarization in the murine ventricle [27,28]. As for INa, the I–V relationship was plotted, as well as the voltage dependence of activation as determined from conductance calculations, and fitted with a single Boltzmann distribution. The time course of inactivation of the decay phase of the transient outward current was best fit by a double exponential decay function in the following form:
The two time constants were plotted as a function of voltage. Steady-state inactivation parameters of Ito,peak were obtained with a double-pulse protocol using 1 s prepulses to voltages from −100 to +20 mV from a holding potential of −100 mV. Peak currents at the test pulse to +40 mV were normalized to the maximal transient outward current elicited by the test pulse and fitted by a single Boltzmann distribution.
3.7. Statistical procedures
Patch clamp measurements were made from a set of 8 WT and 8 Scn5a+/− mice, with n numbers representing the total number of cells studied. 4 WT and 4 Scn5a+/− mice were each used for RT-PCR experiments and a further four each for Western blot experiments. All electrophysiological parameters and expression levels of protein and mRNA were expressed as mean ± s.e.m. values. Their significant differences were analysed using ANOVA applied to all groups with post-hoc Tukey's honestly significant difference tests then applied to paired groups. A p-value of less than 0.05 was the criterion for significance.
4. Results
4.1. Real-time reverse transcriptase-PCR
Nav1.5 mRNA expression was significantly lower in Scn5a+/− hearts than in WT, as previously reported [22] (figure 1). While this was true in both the LV and RV, there was a bigger drop in the RV. While in the LV expression fell to approximately two-thirds of that in the WT, in the RV it fell to about one-third of that in the WT. Interestingly, in the WT there was significantly higher expression of Nav1.5 mRNA in the RV than LV, while in the Scn5a+/− hearts, there was no significant difference between mRNA expression in the two ventricles.
Figure 1.

mRNA expression patterns. Graph of mRNA expression in Na+ and K+ channels in the LV (bars with stripes) and RV (grey bars) of WT and Scn5a+/− hearts. Values are given relative to Nav1.5 mRNA expression in LV WT hearts. Significant differences: asterisks (*), effect of genotype; hashes (#), effect of cardiac ventricle (n = 4 for each group).
Regarding mRNA expression for K+ channels in the heart, we found no significant differences either between LV and RV, or between WT and Scn5a+/− hearts for Kir2.1, Kv1.4 and Kv1.5. However, there were significantly higher mRNA expression levels of Kv4.2 in RVs in both WT and Scn5a+/− hearts, although there was no difference between WT and Scn5a+/−. Kv4.3 showed a small increase in WT RV compared with the WT LV or Scn5a+/− RV, but there were no differences between LV WT or Scn5a+/−, nor between LV and RV Scn5a+/−. Lastly, there was higher mRNA expression of KChIP2 in WT than Scn5a+/− RV, and in the RV than LV, of both WT and Scn5a+/− hearts.
4.2. Western blots
Western blots of Nav1.5 demonstrated a single band at around 220 kDa (predicted weight 227 kDa; figure 2a). There was no significant difference in the Nav1.5 expression found between the LV and RV of WT hearts (figure 2b). As expected, Scn5a+/− hearts had significantly reduced Nav1.5 expression, but there was a further difference between LV and RV, with approximately 30 per cent reduction in the LV and approximately 50 per cent reduction in the RV when compared with WT, resulting in a significantly lower expression of Nav1.5 in the RV compared with the LV of Scn5a+/− hearts. For K+ channels, there were no significant differences in protein expression either between LV and RV or WT and Scn5a+/− hearts for Kir2.1, Kv1.4 or Kv1.5 (figure 2c,d). However, there were significantly higher protein levels in the RV than LV for both WT and Scn5a+/− hearts for Kv4.2, Kv4.3 and KChIP2, with no difference between WT and Scn5a+/−.
Figure 2.

Protein expression patterns. (a) Western blot using anti-Nav1.5 antibody on extracts from LV (bars with stripes) and RV (grey bars) of WT and Scn5a+/− hearts, using anti-heavy chain myosin antibody as a loading control. The whole lane is shown to demonstrate the single band. (b) Graph of Nav1.5 expression levels relative to expression levels in LV WT, calculated from densitometric analysis of protein expression with band intensity normalized to anti-myosin expression. (c) Representative Western blots of antibody-specific binding to a range of K+ channels and to glyceraldehyde-3-phosphate dehydrogenase used as a loading control. (d) Graph of K+ channel expression levels relative to expression levels in LV WT. Significant differences: asterisks (*), effect of genotype; hashes (#) effect of cardiac ventricle (n = 4 for each group).
4.3. Electrophysiology
APDs and INa, IpNa and Ito densities were measured using patch clamp techniques. APs from all groups demonstrated a triangular AP morphology, with a resting membrane potential of around −70 mV and with an overshoot to around +40 mV, in agreement with previous studies in WT mice [29].
4.4. Scn5a+/− right ventricle action potentials have shorter durations and lower maximum upstroke velocities compared with respective left ventricles and with wild-type
The maximum upstroke velocity (dV/dtmax) of the APs, measured as the maximum gradient of the AP upstroke, can be used to give an indication of Na+ channel function [30]. dV/dtmax was reduced in Scn5a+/− hearts compared with WT in both LV and RV myocytes at all pacing frequencies (figure 3). The dV/dtmax values were not significantly different between LV and RV in WT myocytes, but were significantly reduced in RV compared with LV in Scn5a+/− myocytes. There were no significant differences overall in the amplitude of the APs between any group.
Figure 3.

AP measurements. (a) Examples of AP traces at 1 Hz pacing overlaid from the LV and RV of WT and Scn5a+/− myocytes. (b) Bar chart comparing upstroke velocity. (c) Bar chart comparing APDs with APD50s, APD70s and APD90s superimposed. Significant differences: asterisks (*), effect of genotype; hashes (#), effect of cardiac ventricle (n = 20 for each group).
At all three pacing frequencies, APD90 was significantly lower in the RV compared with the LV of Scn5a+/− myocytes, but not in WT. The APD90 of RV Scn5a+/− myocytes was also significantly less than that of RV WT myocytes, while there were no differences between the respective LVs. Similar results were obtained for the APD70 measurements. These myocyte data correlate well with previous studies from APD recordings using monophasic AP electrodes in Langendorff perfused hearts [31].
4.5. Scn5a+/− right ventricle myocytes have lower INa than the respective left ventricle and in wild-type
Na+ currents were initially measured before and after perfusion with 10 μM TTX, and the TTX-sensitive current calculated; however, pilot studies showed that under our experimental conditions, TTX eliminated the entire current being studied, and therefore showed that we were specifically recording the Na+ current without the need for TTX subtraction (figure 4). There were no significant differences in mean capacitance of myocytes between any of the groups.
Values of maximum Na+ current density (INamax) from WT myocytes were in agreement with those from previous studies [23]. There were no significant differences in INamax or I–V relationship between LV and RV myocytes from WT hearts (figure 5a–c). INamax was significantly less in both LV and RV of Scn5a+/− hearts than in WT; this was also reflected in differences in the I–V relationship. In addition, in Scn5a+/− hearts Na+ current density was reduced in the RV compared with the LV. Overall, INamax in the RV of Scn5a+/− hearts was around 50 per cent that of RV WT, while in the Scn5a+/− LV it was around 70 per cent of WT LV.
Figure 5.

INa measurements. (a) Example traces of Na+ currents from myocytes from the LV and RV of WT and Scn5a+/− hearts. The traces have been normalized to cell capacitance, and the protocol is shown in the inset. (b) I–V relationship of Na+ current in myocytes from the four groups (n = 17). (c) Maximum INa density of each group (n = 17). (d) Activation and (e) inactivation curves in myocytes from the four groups, with Boltzmann fits (n = 17 for activation, n = 12 for inactivation). Significant differences: asterisks (*), effect of genotype; hashes (#) effect of cardiac ventricle. Note in (b), upper asterisk denotes differences in genotype for RV, and lower asterisk for LV.
Activation curves yielded parameters of voltage dependence of activation similar to previous studies [12,22,23]. There were no significant differences in these parameters between any of the groups studied (figure 5d and table 1). The inactivation curve was shifted to more negative values in the Scn5a+/− hearts compared with WT for both RV and LV, and for the RV was further shifted to more negative values than the LV in Scn5a+/− hearts (figure 5e and table 1). Thus, the fraction of Na+ channels available for cardiac depolarization is smaller in the Scn5a+/− than WT, and further reduced in the RV.
Table 1.
Parameters of activation and inactivation from Boltzmann fits (millivolts) to the curves produced from INa in myocytes from the LV and RV of WT and Scn5a+/− hearts (n = 17 for activation; n = 12 for inactivation for each group).
| activation |
inactivation |
|||
|---|---|---|---|---|
| V1/2 | k | V1/2 | k | |
| WT LV | −58.88 ± 2.85 | 3.65 ± 0.66 | −74.64 ± 1.83 | 7.95 ± 0.62 |
| WT RV | −60.42 ± 3.04 | 4.14 ± 0.42 | −75.35 ± 1.72 | 7.21 ± 0.60 |
| Scn5a+/− LV | −64.61 ± 2.96 | 3.44 ± 0.78 | −84.16 ± 1.53a | 6.56 ± 0.71 |
| Scn5a+/− RV | −63.69 ± 3.40 | 5.46 ± 0.93 | −91.12 ± 1.64a,b | 6.61 ± 0.74 |
aSignificant effect of genotype.
bSignificant effect of cardiac ventricle.
4.6. Lower IpNa in Scn5a+/− right ventricle myocytes compared with respective left ventricle and with wild-type
We proceeded to measure the persistent Na+ current, IpNa. Following a similar pattern to INa, maximum IpNa was significantly smaller in Scn5a+/− than WT myocytes, and while there was no difference in maximum IpNa between WT LV and RV, it was significantly smaller in the RV of Scn5a+/− hearts than LV (figure 6).
Figure 6.

IpNa measurements. (a) Example traces from a test pulse to −20 mV from the LV and RV of WT and Scn5a+/− myocytes. The vertical lines denote 30 and 80 ms after depolarization. (b) I–V relationship of mean IpNa from 30 to 80 ms after depolarization in myocytes from each group. (c) Bar graph of maximum IpNa density averaged from 30 to 80 ms after depolarization. Significant differences: asterisks (*), effect of genotype; hashes (#), effect of cardiac ventricle (n = 10 for each group).
4.7. Higher Ito in right ventricle than left ventricle of wild-type and Scn5a+/− myocytes
Lastly, we measured inactivating K+ current by subtracting the sustained current Iss from the point of depolarization onwards in raw traces (figure 7a). The inactivating K+ current was taken to represent Ito max, as, while more slowly inactivating K+ currents do exist in the mouse ventricle, they are relatively small [27]. There were no significant differences in Iss amplitude between any of the groups. Itomax was significantly greater in the RV than LV of both Scn5a+/− and WT, which was also reflected in differences in the I–V relationship (figure 7b,c). There were no significant differences in Itomax or the I–V relationship between WT and Scn5a+/− myocytes from either LV or RV.
Figure 7.

Ito measurements. (a) Typical raw trace from the LV of a WT heart and example traces from the LV and RV of WT and Scn5a+/− hearts where the sustained current has been subtracted from the point of depolarization onwards, thus leaving the transient outward current. The traces have been normalized to cell capacitance, and the protocol is shown in the inset. (b) I–V relationship of myocytes from the LV and RV of WT and Scn5a+/− hearts. (c) Bar graph of maximum Ito density. (d) Kinetics of inactivation from myocytes from all groups, with the curve fitted to a double exponential decay function. Significant differences: asterisks (*), effect of genotype; hashes (#), effect of cardiac ventricle (n = 14 for each group). (e) Activation and (f) inactivation curves from myocytes from the LV and RV of WT and Scn5a+/− hearts, with Boltzmann fits (n = 14 for activation, n = 13 for inactivation for each group).
Analysis of the kinetics of inactivation through fitting to a double exponential decay function demonstrated three components of the K+ current, which are likely to represent Ito, IKs and Iss, respectively [32]. The amplitude of Ifast was approximately 10 times that of Islow, supporting evidence that Ito is the dominant inactivating K+ current in the mouse ventricle [27]. Figure 7d shows the time constants of decay of the two inactivating components from myocytes from all groups. There was no clear voltage dependence, similar to findings in other studies [32].
The RV showed values of τ(fast) and τ(slow) that were higher than their respective values in the LV in both the WT and Scn5a+/−. These time constants were then higher in the Scn5a+/− than WT in the RV for all voltages for τ(fast) and at more positive voltages for τ(slow). In contrast, the LV of both WT and Scn5a+/− showed similar values of τ(fast) and τ(slow).
There were no significant differences in voltage dependence of activation (figure 7e and table 2). Voltage dependence of inactivation was shifted to more negative values in the RV compared with LV of both WT and Scn5a+/− hearts, but there was a shift to more positive values for Scn5a+/− myocytes compared with WT (figure 7f and table 2).
Table 2.
Parameters of activation and inactivation from Boltzmann fits (millivolts), and the time constants of inactivation from the double exponential fit to the curves produced from Ito in myocytes from the LV and RV of WT and Scn5a+/− hearts (n = 14 for each group).
| activation |
inactivation |
|||
|---|---|---|---|---|
| V1/2 | k | V1/2 | k | |
| WT LV | −11.06 ± 2.54 | 14.26 ± 3.24 | −42.72 ± 1.86 | 9.18 ± 1.10 |
| WT RV | −9.07 ± 2.85 | 17.24 ± 3.21 | −46.40 ± 1.72a | 7.80 ± 0.92 |
| Scn5a+/− LV | −9.58 ± 3.20 | 14.15 ± 3.95 | −37.13 ± 0.91b | 11.30 ± 0.70 |
| Scn5a+/− RV | −15.57 ± 3.44 | 20.69 ± 3.55 | −42.98 ± 1.01a,b | 10.15 ± 0.73 |
aSignificant effect of cardiac ventricle.
bSignificant effect of genotype.
5. Discussion
These experiments use a Scn5a+/− murine model to test a hypothesis that localizes potentially arrhythmogenic electrophysiological mechanisms to the RV. This system has previously been used to model BrS, and mapping studies have demonstrated slowed conduction and repolarization heterogeneities localized to the RV leading to re-entrant polymorphic VT originating specifically in the RV [3,8]. Our findings add to (i) reports associating the Scn5a+/− mutation with reduced Na+ current expression [12], and (ii) previous studies in WT mice that demonstrated higher Scn5a mRNA and protein expression and Na+ channel availability in endocardium than epicardium [33]. Neither study made comparisons between RV and LV.
Our comparisons have fulfilled the predictions of an electrophysiological hypothesis involving a reduced INa mechanism. Thus, while the patch-clamp experiments demonstrated that WT myocytes possessed similar peak INa magnitudes in the RV and LV, these were decreased in both the RV and LV in the Scn5a+/−, but with a greater reduction in RV than LV. Yet Na+ conductance activation curves were indistinguishable. These findings were also compatible with two underlying mechanisms acting upon Na+ channel function. First, there could be differing Na+ channel inactivation properties in the RV and LV between the WT and the Scn5a+/−. Thus, although WT RV and LV showed similar inactivation curves, both the RV and LV of the Scn5a+/− showed negative shifts in inactivation properties, with the RV showing the greatest alterations. Second, the electrophysiological results implicated reductions in expression of otherwise normal Na+ channels. Thus, the Na+ current reductions took place even at holding voltages at which there was no significant inactivation. Furthermore, the current reductions exactly paralleled the corresponding patterns of protein expression, corroborating the latter mechanism. So did patterns of mRNA expression, apart from suggesting a relative translational upregulation in the LV relative to the RV Scn5a+/−. These findings precisely correlated with the outcomes of similar AP (dV/dt)max values in the RV and LV in the WT, which were reduced in Scn5a+/− to a greater extent in the RV than the LV.
Our studies also showed a reduction in IpNa in the RV of Scn5a+/− hearts, which may well contribute to the shorter APDs in this region. APD values were correspondingly shorter in Scn5a+/− RV than WT RV and than Scn5a+/− LV. Other groups have reported a gradient of expression of IpNa across the ventricular wall [5]. Although the physiological significance in humans is still unclear, the IpNa gradient is thought to be important in the pro- and anti-arrhythmic effect of class 1 agents. This is the first study to show heterogeneity of IpNa between ventricles in any model, and to contribute to increased repolarization heterogeneity.
Differential K+ channel expression has also been implicated in the arrhythmogenic mechanism in BrS. In murine hearts, K+ currents include the readily separable non-inactivating Iss component. They also include inactivating components—mainly the fast inactivating Ito and slow inactivating IKs. These could be separated through their fast (τ(fast)) and slow (τ(slow)) time constants. As described on previous occasions [27,28], IKs appeared to play a relatively minor role in repolarization in the murine ventricle, giving a slow current Islow whose magnitude was less than 10 per cent that of the remaining Ifast. Thus, by far the greater part of the outward current observed in the present experiments appeared to arise from Ito.
Ito channels control a prominent repolarizing current, the Ca2+-independent transient outward K+ current [34]. While in humans and large mammals, both fast (Ito,f) and slow (Ito,s) channels are expressed throughout the heart, in the mouse heart Ito,s is present only in the interventricular septum, and thus the focus of this study is on Ito,f, for which the molecular correlates are Kv4.3/Kv4.2 [35]. Ito,f has thus been well documented to be expressed in a heterogeneous manner throughout the ventricles of mammalian hearts, including mice, in concordance with known AP durations [32,36,37]. The present experiments demonstrated larger peak Ito magnitudes in the RV than the LV. However, there was no particular difference in this peak between Scn5a+/− and the WT. Furthermore, there were no differences in the voltage dependence of activation of Ito in RV or LV whether Scn5a+/− or WT. The voltage-dependence of Ito was slightly shifted to more negative values in the RV than the LV in both WT and Scn5a+/−, which would potentially reduce its repolarizing effect in parallel with a reduced RV expression of INa. However, it was shifted to more positive values in Scn5a+/− than WT, which would accentuate the imbalance between repolarizing and depolarizing currents. Furthermore, the RV showed slower inactivation kinetics than did the LV in both WT and Scn5a+/−, with a further slowing in the Scn5a+/−.
In line with previous studies in mixed ventricular lysates [22], Kir2.1 (mediating the inward rectifier IK1), Kv1.4 (mediating Ito,s) and Kv1.5 (mediating IKs) demonstrated similar mRNA and protein expression levels. In contrast, Kv4.2 demonstrated mRNA and protein expression levels greater in the RV than the LV, but with no difference between WT and Scn5a+/− in direct correlation with their peak current magnitudes. Kv4.3 showed a less clear-cut mRNA expression pattern, with small increases in WT RV compared with the remaining groups (in agreement with earlier results), but showed a similar protein expression pattern to Kv4.2. The disjuncture between current magnitudes and mRNA expression would be consistent with differential KChIP2 expression, in turn controlling expression of the Ito channel. Our study supports this hypothesis in showing higher mRNA and protein expression of KChIP2 in the RV than LV of WT and Scn5a+/− hearts, which could act to increase RV expression of Kv4.3.
These findings thus directly explain changes in maximum INa and Ito in terms of altered protein expression. The mechanisms of the altered voltage dependence of the Na+ and K+ channel inactivation and K+ channel current decay particularly in the Scn5a+/− RV are unknown, but could possibly be due to changes in binding to regulatory proteins. For example, regulation of Nav1.5 is complex, involving interactions with β-subunits and multiple signalling proteins including cytoskeletal molecules such as ankyrins and syntrophins, regulatory kinases and phosphatases, components of cellular trafficking and extracellular matrix molecules, as part of large, multi-protein complexes [38]. Thus, in mice, over-expressing CaMKII, which demonstrates slowed conduction and VT, CaMKII-dependent phosphorylation of Nav1.5 shifts the steady-state inactivation curve towards negative voltages in a Ca2+-dependent manner [39]. Experiments on neonatal rat ventricles and heterologous cells have demonstrated evidence for functional association of Ito,f and Nav currents through coupling between Navβ1 and KChIP2, leading to co-regulation in normal circumstances [40]. It might be possible that disruption to the coupling mechanism could explain the findings of differential K+ channel behaviour in the Scn5a+/− hearts. The heterogeneities in Ito could thus both modify AP repolarization and also influence the reduction of Na+ current in Scn5a+/− hearts to a different extent in the RV than the LV. This could explain the protective effects of quinidine in reducing the spatial and temporal electrophysiological heterogeneities and incidence of arrhythmias in BrS [41].
The main limitations of our study come from the differences between mouse and human hearts in the repolarization phase of the AP, with differences in the range of K+ currents displayed. Mouse hearts also use less L-type Ca2+ channel current ICa,L, with the mouse cardiac AP lacking a plateau phase. The technical difficulty in separating epicardial and endocardial layers meant that our study was limited to a comparison of LV and RV, and we were thus unable to compare transmural differences. Furthermore, we acknowledge that the myocyte isolation procedure is known to cause cell damage, which may affect ionic current properties, including the number of channels and the peak conductance; however, our methodology in the perfusion technique and in the criteria for selection of cells for inclusion in the study aimed to minimize these factors.
Experimental conditions for Na+ current measurement were unphysiological, yet chosen for the following reasons. First, voltage-clamp control of the cell membrane was considered. Under physiological conditions, INa is so large and the kinetics are so rapid that successful voltage-clamp control is challenging, even in single-cell preparations [42,43]. For these reasons, we followed protocols that studied INa in a whole-cell recording configuration under reduced experimental temperatures and lower Na+ gradients [16,44–46]. As different temperatures were used for INa measurements from those of IpNa and Ito, direct comparisons of these currents cannot be made in this paper. Under our conditions, peak INa was 5.4 ± 0.1 nA and 5.3 ± 0.1 nA for WT LV and RV, respectively; these values are similar to others under similar conditions [16,20,47,48]. To enhance voltage-clamp control, large patch pipettes were used. Thus, peak steady-state voltage error resulting from residual series resistance was 2–3 mV, similar to that found in other studies [16,20,47,49]. If experiments demonstrated evidence of inadequate voltage control (e.g. a ‘threshold phenomenon’ near the voltage range for Na+ channel activation), data were discarded. The absence of crossover of the current traces as the current magnitude was changed and the shape of the I–V relationship remaining unchanged for difference peak current values further suggest adequate voltage control [16,17]. Only around the reversal potential did we find that the shape of the I–V relationship differed slightly between curves, with the WT RV trace giving a slightly more negative reversal potential than would be expected from the calculated Nernst potential of +40 mV. Thus, the clamp voltage was properly controlled in our dialysed cell experiments, and it is unlikely that our findings of reduced INa result from clamp conditions.
The Na+ flux recorded may have been affected by voltage-dependent blockage by intracellular Mg2+, although this appears to be significant only at high Mg2+ concentrations and for outward currents [50,51]. Ca2+ flux has also been postulated to occur through Na+ channels under β-adrenergic stimulation in a process dubbed ‘slip-mode conductance’ [52], although other groups have found conflicting results [53–55]. While classical studies have shown little affinity of Ca2+ or Mg2+ for the pore site of the channel [56], the use of low external Na+ concentrations may increase possible blockade of the Na+ channel by either ion.
While decreased membrane excitability owing to reduced Na+ channel function may cause slowed conduction in itself, there is also growing evidence that it may also lead to conduction slowing through the generation of fibrosis [10]. As several previous studies have examined this phenomenon in the Scn5a+/− mouse [2], in this study, we chose to focus on the possible electrophysiological mechanisms underlying the arrhythmias; however, we acknowledge the potential roles of fibrosis in both slowing conduction and also in promoting and maintaining differences in repolarization timing between myocardial layers. Thus, both structural changes and differences in ion channel densities and kinetics could together create optimal pro-arrhythmic conditions.
Changes both in Scn5a+/− mice and in BrS patients could also involve altered expression of a range of other genes and ion channels. right ventricular outflow tract (RVOT) origins of arrhythmias might also involve slow conducting tissue whose AP upstroke is ICa,L-dependent [57]. Ventricular mRNA expression profiles in studies of human BrS associated with Na+ channelopathy have suggested remodelled Ca2+ in addition to Na+ and K+ channel expression [58]. Furthermore, Ca2+-dependent mechanisms are known to play a role in Nav1.5 regulation [59]. Future work might then explore the possibility that altered current densities and expression levels of Ca2+ channels might also contribute to arrhythmogenesis in Scn5a+/− hearts.
The cellular and molecular experiments described here correlate with work performed in the whole heart, especially mapping experiments that have localized both conduction slowing and heterogeneity of repolarization, and subsequent initiation of arrhythmias through re-entrant phenomena, to the RV [8]. Computer simulations could provide a potential means to further explore the pro-arrhythmic consequences of RV/LV differences in ionic currents, particularly employing whole heart models [60–63]. However, this would also entail obtaining further independent information on detailed conduction pathway morphology, including extents of fibrosis and cell–cell conductance information in Scn5a+/− hearts. While groups have previously used whole heart models of WT mouse hearts [60], it has been shown previously that Scn5a+/− hearts exhibit heterogeneous fibrosis [2], along with heterogeneous expression of connexin 43 and upregulation of hypertrophic markers including β-MHC and skeletal α-actin [64].
In conclusion, Scn5a+/− mice demonstrate a relative upregulation of Scn5a expression in the LV compared with RV. The specifically reduced RV expression of Na+ channels leads to smaller INa, resulting in slowed conduction, and smaller IpNa, which, in combination with increased Ito, results in shorter AP durations and greater heterogeneity of repolarization, thus suggesting that arrhythmogenesis may be initiated by both abnormal depolarization and repolarization in the RV of Scn5a+/− hearts.
6. Acknowledgements
This work was funded by the British Heart Foundation, the Medical Research Council, the Wellcome Trust, the National Heart and Lung Foundation, and the Biotechnology and Biological Research Council, UK. C.A.M. was supported by a Medical Research Council Clinical Research Fellowship and a Sackler Studentship of the University of Cambridge School of Clinical Medicine. K.K. was supported by studentships from the German Academic Exchange Service (DAAD) and the Cambridge European Trust.
References
- 1.Kurita T, et al. 2002. The electrophysiologic mechanism of ST-segment elevation in Brugada syndrome. J. Am. Coll. Cardiol. 40, 330–334 10.1016/S0735-1097(02)01964-2 (doi:10.1016/S0735-1097(02)01964-2) [DOI] [PubMed] [Google Scholar]
- 2.van Veen TA, et al. 2005. Impaired impulse propagation in Scn5a-knockout mice: combined contribution of excitability, connexin expression, and tissue architecture in relation to aging. Circulation 112, 1927–1935 10.1161/circulationaha.105.539072 (doi:10.1161/circulationaha.105.539072) [DOI] [PubMed] [Google Scholar]
- 3.Stein M, et al. 2009. Combined reduction of intercellular coupling and membrane excitability differentially affects transverse and longitudinal cardiac conduction. Cardiovasc. Res. 83, 52–60 10.1093/cvr/cvp124 (doi:10.1093/cvr/cvp124) [DOI] [PubMed] [Google Scholar]
- 4.Antzelevitch C. 2003. Brugada syndrome: clinical, genetic, molecular, cellular and ionic aspects. Expert Rev. Cardiovasc. Ther. 1, 177–185 10.1586/14779072.1.2.177 (doi:10.1586/14779072.1.2.177) [DOI] [PubMed] [Google Scholar]
- 5.Saint DA. 2008. The cardiac persistent sodium current: an appealing therapeutic target? Br. J. Pharmacol. 153, 1133–1142 10.1038/sj.bjp.0707492 (doi:10.1038/sj.bjp.0707492) [DOI] [PMC free article] [PubMed] [Google Scholar]
- 6.Eckardt L, et al. 2005. Long-term prognosis of individuals with right precordial ST-segment-elevation Brugada syndrome. Circulation 111, 257–263 10.1161/01.CIR.0000153267.21278.8D (doi:10.1161/01.CIR.0000153267.21278.8D) [DOI] [PubMed] [Google Scholar]
- 7.Martin CA, et al. 2010. In vivo studies of Scn5a+/− mice modeling Brugada syndrome demonstrate both conduction and repolarization abnormalities. J. Electrocardiol. 43, 433–439 10.1016/j.jelectrocard.2010.05.015 (doi:10.1016/j.jelectrocard.2010.05.015) [DOI] [PMC free article] [PubMed] [Google Scholar]
- 8.Martin CA, et al. 2011. Mapping of reentrant spontaneous polymorphic ventricular tachycardia in a Scn5a+/− mouse model. Am. J. Physiol. Heart Circ. Physiol. 300, H1853–H1862 10.1152/ajpheart.00034.2011 (doi:10.1152/ajpheart.00034.2011) [DOI] [PMC free article] [PubMed] [Google Scholar]
- 9.Wilde AA, Coronel R. 2008. The complexity of genotype–phenotype relations associated with loss-of-function sodium channel mutations and the role of in silico studies. Am. J. Physiol. Heart Circ. Physiol. 295, H8–H9 10.1152/ajpheart.00494.2008 (doi:10.1152/ajpheart.00494.2008) [DOI] [PubMed] [Google Scholar]
- 10.Coronel R, et al. 2005. Right ventricular fibrosis and conduction delay in a patient with clinical signs of Brugada syndrome: a combined electrophysiological, genetic, histopathologic, and computational study. Circulation 112, 2769–2777 10.1161/circulationaha.105.532614 (doi:10.1161/circulationaha.105.532614) [DOI] [PubMed] [Google Scholar]
- 11.Sacher F, et al. 2006. Outcome after implantation of a cardioverter-defibrillator in patients with Brugada syndrome: a multicenter study. Circulation 114, 2317–2324 10.1161/circulationaha.106.628537 (doi:10.1161/circulationaha.106.628537) [DOI] [PubMed] [Google Scholar]
- 12.Papadatos GA, et al. 2002. Slowed conduction and ventricular tachycardia after targeted disruption of the cardiac sodium channel gene Scn5a. Proc. Natl Acad. Sci. USA 99, 6210–6215 10.1073/pnas.082121299 (doi:10.1073/pnas.082121299) [DOI] [PMC free article] [PubMed] [Google Scholar]
- 13.Livak KJ, Schmittgen TD. 2001. Analysis of relative gene expression data using real-time quantitative PCR and the 2−ΔΔCT method. Methods 25, 402–428 10.1006/meth.2001.1262 (doi:10.1006/meth.2001.1262) [DOI] [PubMed] [Google Scholar]
- 14.Terracciano CM, et al. 1998. Na+-Ca2+ exchange and sarcoplasmic reticular Ca2+ regulation in ventricular myocytes from transgenic mice overexpressing the Na+-Ca2+ exchanger. J. Physiol. 512, 651–667 10.1111/j.1469-7793.1998.651bd.x (doi:10.1111/j.1469-7793.1998.651bd.x) [DOI] [PMC free article] [PubMed] [Google Scholar]
- 15.Hakim P, et al. 2008. Scn3b knockout mice exhibit abnormal ventricular electrophysiological properties. Prog. Biophys. Mol. Biol. 98, 251–266 10.1016/j.pbiomolbio.2009.01.005 (doi:10.1016/j.pbiomolbio.2009.01.005) [DOI] [PMC free article] [PubMed] [Google Scholar]
- 16.Sakakibara Y, et al. 1993. Sodium current in isolated human ventricular myocytes. Am. J. Physiol. 265, H1301–H1309 [DOI] [PubMed] [Google Scholar]
- 17.Gilliam FR, III, Starmer CF, Grant AO. 1989. Blockade of rabbit atrial sodium channels by lidocaine. Characterization of continuous and frequency-dependent blocking. Circ. Res. 65, 723–739 [DOI] [PubMed] [Google Scholar]
- 18.Hodgkin AL, Huxley AF, Katz B. 1952. Measurement of current–voltage relations in the membrane of the giant axon of Loligo. J. Physiol. 116, 424–448 [DOI] [PMC free article] [PubMed] [Google Scholar]
- 19.Lee HC, et al. 1993. Reversal of lidocaine effects on sodium currents by isoproterenol in rabbit hearts and heart cells. J. Clin. Investig. 91, 693–701 10.1172/JCI116250 (doi:10.1172/JCI116250) [DOI] [PMC free article] [PubMed] [Google Scholar]
- 20.Pu J, Boyden PA. 1997. Alterations of Na+ currents in myocytes from epicardial border zone of the infarcted heart. A possible ionic mechanism for reduced excitability and postrepolarization refractoriness. Circ. Res. 81, 110–119 [DOI] [PubMed] [Google Scholar]
- 21.Bendahhou S, et al. 1999. Activation and inactivation of the voltage-gated sodium channel: role of segment S5 revealed by a novel hyperkalaemic periodic paralysis mutation. J. Neurosci. 19, 4762–4771 [DOI] [PMC free article] [PubMed] [Google Scholar]
- 22.Leoni AL, et al. 2010. Variable Na(v)1.5 protein expression from the wild-type allele correlates with the penetrance of cardiac conduction disease in the Scn5a(+/−) mouse model. PLoS ONE 5, e9298 10.1371/journal.pone.0009298 (doi:10.1371/journal.pone.0009298) [DOI] [PMC free article] [PubMed] [Google Scholar]
- 23.Remme CA, et al. 2006. Overlap syndrome of cardiac sodium channel disease in mice carrying the equivalent mutation of human SCN5A-1795insD. Circulation 114, 2584–2594 10.1161/CIRCULATIONAHA.106.653949 (doi:10.1161/CIRCULATIONAHA.106.653949) [DOI] [PubMed] [Google Scholar]
- 24.Zhang ZS, et al. 2007. Sodium channel kinetic changes that produce Brugada syndrome or progressive cardiac conduction system disease. Am. J. Physiol. Heart Circ. Physiol. 292, H399–H407 10.1152/ajpheart.01025.2005 (doi:10.1152/ajpheart.01025.2005) [DOI] [PubMed] [Google Scholar]
- 25.Stagg MA, et al. 2008. Cytoskeletal protein 4.1R affects repolarization and regulates calcium handling in the heart. Circ. Res. 103, 855–863 10.1161/CIRCRESAHA.108.176461 (doi:10.1161/CIRCRESAHA.108.176461) [DOI] [PubMed] [Google Scholar]
- 26.Petrashevskaya NN, et al. 2002. Cardiac function and electrical remodeling of the calcineurin-overexpressed transgenic mouse. Cardiovasc. Res. 54, 117–132 10.1016/S0008-6363(02)00241-9 (doi:10.1016/S0008-6363(02)00241-9) [DOI] [PubMed] [Google Scholar]
- 27.Nerbonne JM, Kass RS. 2005. Molecular physiology of cardiac repolarization. Physiol. Rev. 85, 1205–1253 10.1152/physrev.00002.2005 (doi:10.1152/physrev.00002.2005) [DOI] [PubMed] [Google Scholar]
- 28.DuBell WH, Lederer WJ, Rogers TB. 2000. K+ currents responsible for repolarization in mouse ventricle and their modulation by FK-506 and rapamycin. Am. J. Physiol. Heart Circ. Physiol. 278, H886–H897 [DOI] [PubMed] [Google Scholar]
- 29.Li H, et al. 2004. Selective elimination of I(K,slow1) in mouse ventricular myocytes expressing a dominant negative Kv1.5α subunit. Am. J. Physiol. Heart Circ. Physiol. 286, H319–H328 10.1152/ajpheart.00665.2003 (doi:10.1152/ajpheart.00665.2003) [DOI] [PubMed] [Google Scholar]
- 30.Berecki G, et al. 2010. Re-evaluation of the action potential upstroke velocity as a measure of the Na+ current in cardiac myocytes at physiological conditions. PLoS ONE 5, e15772 10.1371/journal.pone.0015772 (doi:10.1371/journal.pone.0015772) [DOI] [PMC free article] [PubMed] [Google Scholar]
- 31.Martin CA, et al. 2010. Increased right ventricular repolarization gradients promote arrhythmogenesis in a murine model of Brugada syndrome. J. Cardiovasc. Electrophysiol. 21, 1153–1159 10.1111/j.1540-8167.2010.01767.x (doi:10.1111/j.1540-8167.2010.01767.x) [DOI] [PMC free article] [PubMed] [Google Scholar]
- 32.Xu H, Guo W, Nerbonne JM. 1999. Four kinetically distinct depolarization-activated K+ currents in adult mouse ventricular myocytes. J. Gen. Physiol. 113, 661–678 10.1085/jgp.113.5.661 (doi:10.1085/jgp.113.5.661) [DOI] [PMC free article] [PubMed] [Google Scholar]
- 33.Remme CA, et al. 2009. The cardiac sodium channel displays differential distribution in the conduction system and transmural heterogeneity in the murine ventricular myocardium. Basic Res. Cardiol. 104, 511–522 10.1007/s00395-009-0012-8 (doi:10.1007/s00395-009-0012-8) [DOI] [PMC free article] [PubMed] [Google Scholar]
- 34.Benndorf K, Nilius B. 1988. Properties of an early outward current in single cells of the mouse ventricle. Gen. Physiol. Biophys. 7, 449–466 [PubMed] [Google Scholar]
- 35.Dixon JE, et al. 1996. Role of the Kv4.3 K+ channel in ventricular muscle. A molecular correlate for the transient outward current. Circ. Res. 79, 659–668 [DOI] [PubMed] [Google Scholar]
- 36.Brunet S, et al. 2004. Heterogeneous expression of repolarizing, voltage-gated K+ currents in adult mouse ventricles. J. Physiol. 559, 103–120 10.1113/jphysiol.2004.063347 (doi:10.1113/jphysiol.2004.063347) [DOI] [PMC free article] [PubMed] [Google Scholar]
- 37.Oudit GY, et al. 2001. The molecular physiology of the cardiac transient outward potassium current (Ito) in normal and diseased myocardium. J. Mol. Cell Cardiol. 33, 851–872 10.1006/jmcc.2001.1376 (doi:10.1006/jmcc.2001.1376) [DOI] [PubMed] [Google Scholar]
- 38.Meadows LS, Isom LL. 2005. Sodium channels as macromolecular complexes: implications for inherited arrhythmia syndromes. Cardiovasc. Res. 67, 448–458 10.1016/j.cardiores.2005.04.003 (doi:10.1016/j.cardiores.2005.04.003) [DOI] [PubMed] [Google Scholar]
- 39.Wagner S, et al. 2006. Ca2+/calmodulin-dependent protein kinase II regulates cardiac Na+ channels. J. Clin. Invest. 116, 3127–3138 10.1172/JCI26620 (doi:10.1172/JCI26620) [DOI] [PMC free article] [PubMed] [Google Scholar]
- 40.Deschenes I, et al. 2008. Post-transcriptional gene silencing of KChIP2 and Navβ1 in neonatal rat cardiac myocytes reveals a functional association between Na and Ito currents. J. Mol. Cell Cardiol. 45, 336–346 10.1016/j.yjmcc.2008.05.001 (doi:10.1016/j.yjmcc.2008.05.001) [DOI] [PMC free article] [PubMed] [Google Scholar]
- 41.Belhassen B, Glick A, Viskin S. 2004. Efficacy of quinidine in high-risk patients with Brugada syndrome. Circulation 110, 1731–1737 10.1161/01.CIR.0000143159.30585.90 (doi:10.1161/01.CIR.0000143159.30585.90) [DOI] [PubMed] [Google Scholar]
- 42.Makielski JC, et al. 1987. Sodium current in voltage clamped internally perfused canine cardiac Purkinje cells. Biophys. J. 52, 1–11 10.1016/S0006-3495(87)83182-X (doi:10.1016/S0006-3495(87)83182-X) [DOI] [PMC free article] [PubMed] [Google Scholar]
- 43.Johns JA, et al. 1989. Temperature and voltage dependence of sodium channel blocking and unblocking by O-demethyl encainide in isolated guinea pig myocytes. J. Cardiovasc. Pharmacol. 13, 826–835 10.1097/00005344-198906000-00004 (doi:10.1097/00005344-198906000-00004) [DOI] [PubMed] [Google Scholar]
- 44.Brown AM, Lee KS, Powell T. 1981. Sodium current in single rat heart muscle cells. J. Physiol. 318, 479–500 [DOI] [PMC free article] [PubMed] [Google Scholar]
- 45.Sigworth FJ, Neher E. 1980. Single Na+ channel currents observed in cultured rat muscle cells. Nature 287, 447–449 10.1038/287447a0 (doi:10.1038/287447a0) [DOI] [PubMed] [Google Scholar]
- 46.Berman MF, et al. 1989. Single sodium channels from canine ventricular myocytes: voltage dependence and relative rates of activation and inactivation. J. Physiol. 415, 503–531 [DOI] [PMC free article] [PubMed] [Google Scholar]
- 47.Wendt DJ, Starmer CF, Grant AO. 1992. Na channel kinetics remain stable during perforated-patch recordings. Am. J. Physiol. 263, C1234–C1240 [DOI] [PubMed] [Google Scholar]
- 48.Haas HG, Kern R, Einwachter HM. 1970. Electrical activity and metabolism in cardiac tissue: an experimental and theoretical study. J. Membr. Biol. 3, 180–209 10.1007/BF01868015 (doi:10.1007/BF01868015) [DOI] [PubMed] [Google Scholar]
- 49.Bean BP, Cohen CJ, Tsien RW. 1983. Lidocaine block of cardiac sodium channels. J. Gen. Physiol. 81, 613–642 10.1085/jgp.81.5.613 (doi:10.1085/jgp.81.5.613) [DOI] [PMC free article] [PubMed] [Google Scholar]
- 50.Lin F, Conti F, Moran O. 1991. Competitive blockage of the sodium channel by intracellular magnesium ions in central mammalian neurones. Eur. Biophys. J. 19, 109–118 [DOI] [PubMed] [Google Scholar]
- 51.Bara M, Guiet-Bara A, Durlach J. 1993. Regulation of sodium and potassium pathways by magnesium in cell membranes. Magnes. Res. 6, 167–177 [PubMed] [Google Scholar]
- 52.Santana LF, Gomez AM, Lederer WJ. 1998. Ca2+ flux through promiscuous cardiac Na+ channels: slip-mode conductance. Science 279, 1027–1033 10.1126/science.279.5353.1027 (doi:10.1126/science.279.5353.1027) [DOI] [PubMed] [Google Scholar]
- 53.DelPrincipe F, Egger M, Niggli E. 2000. L-type Ca2+ current as the predominant pathway of Ca2+ entry during INa activation in beta-stimulated cardiac myocytes. J. Physiol. 527, 455–466 10.1111/j.1469-7793.2000.00455.x (doi:10.1111/j.1469-7793.2000.00455.x) [DOI] [PMC free article] [PubMed] [Google Scholar]
- 54.Nuss HB, Marban E. 1999. Whether ‘slip-mode conductance’ occurs. Science 284, 711a 10.1126/science.284.5415.711a (doi:10.1126/science.284.5415.711a) [DOI] [Google Scholar]
- 55.Balke CW, et al. 1999. Whether ‘slip-mode conductance’ occurs. Science 284, 711a 10.1126/science.284.5415.711a (doi:10.1126/science.284.5415.711a) [DOI] [Google Scholar]
- 56.Hille B. 1972. The permeability of the sodium channel to metal cations in myelinated nerve. J. Gen. Physiol. 59, 637–658 10.1085/jgp.59.6.637 (doi:10.1085/jgp.59.6.637) [DOI] [PMC free article] [PubMed] [Google Scholar]
- 57.Meregalli PG, Wilde AA, Tan HL. 2005. Pathophysiological mechanisms of Brugada syndrome: depolarization disorder, repolarization disorder, or more. Cardiovasc. Res. 67, 367–378 10.1016/j.cardiores.2005.03.005 (doi:10.1016/j.cardiores.2005.03.005) [DOI] [PubMed] [Google Scholar]
- 58.Gaborit N, et al. 2009. Transcriptional profiling of ion channel genes in Brugada syndrome and other right ventricular arrhythmogenic diseases. Eur. Heart J. 30, 487–496 10.1093/eurheartj/ehn520 (doi:10.1093/eurheartj/ehn520) [DOI] [PubMed] [Google Scholar]
- 59.Yuill KH, Smirnov SV. 2010. Calcium-dependent regulation of voltage-gated sodium channels in cardiac myocytes: just the beginning. Cardiovasc. Res. 85, 411–412 10.1093/cvr/cvp398 (doi:10.1093/cvr/cvp398) [DOI] [PubMed] [Google Scholar]
- 60.Bondarenko VE, Rasmusson RL. 2007. Simulations of propagated mouse ventricular action potentials: effects of molecular heterogeneity. Am. J. Physiol. Heart Circ. Physiol. 293, H1 816–H1 832 10.1152/ajpheart.00471.2007 (doi:10.1152/ajpheart.00471.2007) [DOI] [PubMed] [Google Scholar]
- 61.Gray RA, Jalife J. 1998. Ventricular fibrillation and atrial fibrillation are two different beasts. Chaos 8, 65–78 10.1063/1.166288 (doi:10.1063/1.166288) [DOI] [PubMed] [Google Scholar]
- 62.Panfilov AV. 1998. Spiral breakup as a model of ventricular fibrillation. Chaos 8, 57–64 10.1063/1.166287 (doi:10.1063/1.166287) [DOI] [PubMed] [Google Scholar]
- 63.Keldermann RH, et al. 2008. Effect of heterogeneous APD restitution on VF organization in a model of the human ventricles. Am. J. Physiol. Heart Circ. Physiol. 294, H764–H774 10.1152/ajpheart.00906.2007 (doi:10.1152/ajpheart.00906.2007) [DOI] [PubMed] [Google Scholar]
- 64.Royer A, et al. 2005. Mouse model of SCN5A-linked hereditary Lenegre's disease: age-related conduction slowing and myocardial fibrosis. Circulation 111, 1738–1746 10.1161/01.CIR.0000160853.19867.61 (doi:10.1161/01.CIR.0000160853.19867.61) [DOI] [PubMed] [Google Scholar]