

Abstract
After its discovery in 1990, blood oxygenation level-dependent (BOLD) contrast in functional magnetic resonance imaging (fMRI) has been widely used to map brain activation in humans and animals. Since fMRI relies on signal changes induced by neural activity, its signal source can be complex and is also dependent on imaging parameters and techniques. In this review, we identify and describe the origins of BOLD fMRI signals, including the topics of (1) effects of spin density, volume fraction, inflow, perfusion, and susceptibility as potential contributors to BOLD fMRI, (2) intravascular and extravascular contributions to conventional gradient-echo and spin-echo BOLD fMRI, (3) spatial specificity of hemodynamic-based fMRI related to vascular architecture and intrinsic hemodynamic responses, (4) BOLD signal contributions from functional changes in cerebral blood flow (CBF), cerebral blood volume (CBV), and cerebral metabolic rate of O2 utilization (CMRO2), (5) dynamic responses of BOLD, CBF, CMRO2, and arterial and venous CBV, (6) potential sources of initial BOLD dips, poststimulus BOLD undershoots, and prolonged negative BOLD fMRI signals, (7) dependence of stimulus-evoked BOLD signals on baseline physiology, and (8) basis of resting-state BOLD fluctuations. These discussions are highly relevant to interpreting BOLD fMRI signals as physiological means.
Keywords: BOLD, cerebral blood flow, cerebral blood volume, fMRI, oxygen consumption
Introduction
In 1990, Ogawa and colleagues at AT&T Bell Laboratories studied responses to global physiological stimulus in rat brains at 7 T and reported that functional brain mapping was possible using venous blood oxygenation level-dependent (BOLD) magnetic resonance imaging (MRI) contrast (Ogawa et al, 1990a, 1990b; Ogawa and Lee, 1990). This BOLD contrast relies on changes in deoxyhemoglobin, which acts as an endogenous paramagnetic contrast agent (Pauling and Coryell 1936). Therefore, changes in the local deoxyhemoglobin concentration in the brain lead to alterations in MRI signal intensity (Thulborn et al, 1982; Ogawa et al, 1990a, 1990b; Ogawa and Lee, 1990). Application of BOLD contrast to human functional brain mapping soon followed (Bandettini et al, 1992; Kwong et al, 1992; Ogawa et al, 1992). In recent years, functional MRI (fMRI) has been the tool of choice to visualize neural activity in the human brain, with >3,000 papers with the keyword ‘fMRI' published annually. Thus, it is critical to understand the origins of BOLD fMRI responses.
Figure 1 depicts the components on cellular (Figure 1A) and vascular (Figure 1B) levels affected by neural activity induced by task execution or stimulus exposure, which give rise to BOLD fMRI signals (Figure 1C). Neural activity can be broadly classified by local field potentials (LFPs) and spiking activity; LFP is generally believed to represent synaptic activity including neural input, while spiking activity in cell bodies represents suprathreshold neural output. Increased neural activity is accompanied by an increased flux of Na+, K+, and Ca+2, and increased ATP production via glucose consumption. These changes induce astrocytes (yellow in Figure 1A) and neuronal cells (round green regions in Figure 1A) to send vasoactive signals into nearby arterioles and capillaries (dark bands in Figure 1A), consequently dilating the upstream arterial vessels. The exact signaling mechanism remains an area of intense research, with excellent review articles available (Attwell et al, 2010; Petzold and Murthy, 2011), as this tight neurovascular coupling is a key to understanding vascular-based fMRI approaches. Also relevant (and as yet undetermined) are the contributions of neuronal versus astrocyte signaling, the contributions of excitatory versus inhibitatory neurotransmission, and the spatial extent and dynamic properties of neural versus vascular responses.
Figure 1.

Relationship between neurovascular components and BOLD fMRI. (A) Cells are differentiated in this in-vivo rat brain image from two-photon laser scanning microscopy (provided by Alberto Vazquez at the University of Pittsburgh), where neuronal cell bodies and processes appear green (Oregon Green BAPTA-1AM), astrocyte cell bodies and processes are yellow (Sulforhodamine 101), and capillaries appear as dark bands. Increased activity in the neurons and astrocytes near and surrounding the capillaries induces an increase in capillary blood flow and dilation of upstream arterioles. (B) Vascular structure is depicted in this image from human cortex obtained by vascular casting and electron scanning microscopy, as adapted from Figure 4 in Reina-De La Torre et al (1998). The region outlined by the red rectangle approximates the size of the cellular image in (A). A dense network of small-diameter intracortical vessels appears below the dashed horizontal line, while a smaller number of large-diameter pial vessels appear above the dashed horizontal line. Blood flows from the pial arteries to the intracortical arteriolar branches, then into the dense capillary network, draining back through the intracortical venules and pial veins. (C) Whole-brain human BOLD fMRI studies depict functional responses localized to multiple brain regions (Kim and Ugurbil, 1997b). Functional MRI was acquired by the gradient-echo echo planar imaging technique with spatial resolution of 3.1 × 3.1 × 5 mm3 at 4 T. The size of each single fMRI pixel is approximated by the boundaries of the vascular image in (B); thus, there are numerous vessels of different sizes within each fMRI pixel, and contributions from these vessels must be considered to understand BOLD biophysical mechanisms. BOLD, blood oxygenation level dependent; MRI, magnetic resonance imaging; fMRI, functional MRI.
A focal increase in cerebral blood flow (CBF) can be considered to directly relate to neuronal activity because glucose metabolism and CBF changes are closely coupled (Raichle, 1987). However, based on the positron emission tomographic measurements of CBF and cerebral metabolic rate of oxygen utilization (CMRO2) in humans during somatosensory and visual stimulation (Fox and Raichle, 1986; Fox et al, 1988), the increase in CBF surpasses the increase in CMRO2, resulting in an increase in capillary and venous oxygenation levels. Regardless of the exact signaling mechanisms for this CBF response, the BOLD signal is related to a mismatch between CBF increase and CMRO2 change. Thus, the relationship between neural activity and BOLD fMRI signals must be understood to properly interpret the maps. It has been reported that the BOLD fMRI response correlates (1) with underlying LFP rather than spiking activity (Logothetis et al, 2001; Viswanathan and Freeman, 2007), (2) with mostly spiking activity (Heeger and Ress, 2002), or (3) with both LFP and spiking activity (Mukamel et al, 2005). Because spiking activity occurs together with LFP, in most circumstances it is difficult to separate their contributions to the BOLD response (Yen et al, 2011). The exact relationship between BOLD signals and underlying neural activity is still a matter of debate, even after decades of research (Ekstrom, 2010), but excellent review articles on this topic are also available (Logothetis, 2008; Ekstrom, 2010).
In this article, we will focus on the biophysical and physiological sources of BOLD fMRI signals and discuss what is currently known about stimulus-evoked vascular changes. Since BOLD fMRI measures signal changes induced by neural activity, we will evaluate the contribution of various fMRI signal components. We will also discuss nonBOLD fMRI approaches that are sensitive to changes in single parameters such as perfusion or blood volume. Topics also reviewed are the spatial specificity of BOLD fMRI, physiological sources of stimulus-evoked fMRI responses, and resting-state fMRI. Since the BOLD fMRI field is now >20 years old, many excellent review articles are available on human applications and neurophysiology (e.g., Logothetis, 2008; van Eijsden et al, 2009; Glover, 2011). Our review will therefore focus instead on findings based primarily on our animal studies, which afford the systematic assessment of physiological sources and the combination of fMRI with invasive approaches. Topics discussed here, however, should also be relevant to human fMRI studies.
Vascular architecture relevant to hemodynamic-based functional magnetic resonance imaging
Since hemodynamic-based fMRI signals originate from vessels, understanding the vascular structure is highly important. Thus, we review what is known about vascular structure and density within human cortex, based on an influential paper by Duvernoy (Duvernoy et al, 1981). Vessels can be broadly classified as either pial or intracortical (see vessels above and below the dashed red horizontal line in Figure 1B, respectively). Pial vessels are larger and less dense than intracortical vessels, and connect to penetrating arteries and emerging veins. Intracortical vessels can be subdivided into arteries, veins, and the capillary network. Capillaries with ∼5 μm average diameter and ∼100 μm length (Pawlik et al, 1981) are close to active neurons and astrocytes as seen in Figure 1A; the distance between capillaries and neurons is likely <13 μm, since the average intercapillary distance is ∼25 μm (Pawlik et al, 1981). Intracortical arteries and veins (see Figure 2A) can be further classified by the depth of their cortical penetration (Duvernoy et al, 1981); vessels in groups 1 and 2 (arterial diameters of 10 to 25 μm, venous diameters of 20 to 30 μm) penetrate only the upper cortical layers (layers 1 to 3), group 3 vessels (arterial diameters of 15 to 30 μm, venous diameter of 45 μm) penetrate the middle of the cortex (layers 3 to 5), group 4 vessels (arterial diameters of 30 to 40 μm, venous diameter of 65 μm) penetrate lower cortical depths (layer 6), and vessels in group 5 (arterial diameters of 30 to 75 μm, venous diameters of 80 to 125 μm) vascularize both cortex and white matter. Note that group 6 arterial vessels (A6 in Figure 2A) pass through cortex and vascularize only white matter. Venous vasculature can be imaged using BOLD contrast (often referred to as ‘susceptibility-weighted imaging'). Figure 2B illustrates this BOLD contrast, where veins appear as dark lines or dots because T2* in venous blood is shorter than in tissue and arterial blood, and also because the blood susceptibility effect extension to extravascular tissue enlarges the apparent venous vessel size; groups 3 to 5 intracortical veins (e.g., red arrows) can be clearly visualized with this technique. Typical distances between magnetic resonance (MR)-detectable neighboring intracortical veins are ∼0.5 to 1 mm in rats and cats (Park et al, 2008). In the middle and deep cortical layers, intracortical arteries outnumber intracortical veins by a factor of ∼4 (Duvernoy et al, 1981). The size of a single vascular unit corresponds to the amount of tissue it supplies or drains. These vascular unit diameters are 0.33 to 0.5 mm for groups 2 to 3 arteries, 0.75 to 1 mm for groups 2 to 3 veins, 0.5 to 2 mm for group 5 arteries, and 1 to 4 mm for group 5 veins (Duvernoy et al, 1981; see Figure 2C).
Figure 2.

Vascular architecture relevant to hemodynamic-based fMRI. (A) This schematic illustrates a section from the cortical surface (top) to white matter (bottom) with the various types of arterial (A) and venous (V) intracortical vessels as classified by penetration depth (adapted from Figure 27 in Duvernoy et al, 1981). Group 6 (arteries only) extends to white matter with no cortical branches, group 5 also extends to white matter, but has cortical branches, group 4 extends to cortical layer 6 (highlighted in green), group 3 extends to layers 3 to 5 (layer 4 highlighted in yellow), and groups 1 and 2 extend only to the upper cortical layers. (B) This venogram is a 3-D T2*-weighted coronal MR image of cat brain obtained at 9.4 T with 78 mm isotropic resolution, 1.25 mm-thick slab selection, and minimum intensity projection performed to enhance the contrast of venous vessels; data acquisition and processing methods are reported elsewhere (Park et al, 2008). The bottom image is an expansion of signal within the dashed yellow box. White matter (outlined by dashed blue lines) is clearly differentiated from gray matter. Venous vessels draining from white matter (indicated by red arrows) belong to group 5. (C) This schematic of a tangential section (parallel to the cortical surface) shows venous vascular units (blue dots with black traces) with their arterial rings (red dots) (adapted from Figure 63 in Duvernoy et al, 1981), where the size of a single venous vascular unit (typically 1 to 2 mm in diameter) corresponds to the amount of tissue it drains. MR, magnetic resonance; MRI, MR imaging; fMRI, functional MRI.
Contribution of physiological parameters to baseline magnetic resonance imaging signals
Examining individual contributions to MRI signals is an important step toward understanding BOLD fMRI mechanisms. Pixel sizes in typical fMRI studies are a few millimeters; each pixel may therefore include blood, extravascular tissue, and cerebrospinal fluid (CSF) components. Since arterial blood and venous blood have different T2 values, these will be considered separately, with the assumption that capillary content is partly arterial blood and partly venous blood. Thus, MR signal intensity from a pixel is the sum of signals originating from multiple compartments with different spin density and relaxation parameters. The MRI intensity, S, can be described as
 |
where subscripts, i, indicate the compartment; ρ is the water proton spin density; V is the volume fraction; MSS is the steady-state magnetization, which is 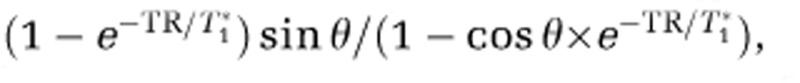 , where TR is the repetition time, T1* is the apparent longitudinal relaxation time in the presence of inflow, and θ is the flip angle; TE is the echo time; and T2* is the apparent transverse relaxation time including the BOLD-contrast susceptibility effect. Therefore, fMRI signal changes are dependent not only on imaging parameters (including TR and θ), but also on biophysical responses that significantly change any of the above parameters. It is therefore critical to understand all potentially significant contributions to MRI signals, including those that are not BOLD effects.
Water Proton Spin Density (ρ) and Volume Fractions (V)
Water proton spin density is directly related to a water content, which is 0.88 g/mL for extravascular tissue (obtained from the gray matter value in Table 1 in Herscovitch and Raichle, 1985) and 0.87 g/mL for arterial and venous blood with a hematocrit level of 35% (see further details in Table 2 in Herscovitch and Raichle, 1985). Arterial and venous blood compartment values for V are ∼1% (Ito et al, 2001) and 2.5% to 3% (An and Lin, 2002a, 2002b), respectively, in human brain.
Inflow and Cerebral Blood Flow (T1*)
Inflow and CBF can act to decrease the T1* values of blood and extravascular tissue components. Flowing blood moves spins from outside the imaging plane into the slice pixels. When spins in the imaging plane are saturated, signal from the unsaturated inflowing blood is enhanced relative to the surrounding stationary spins; this effect is the basis of time-of-flight angiography, which visualizes arterial blood vessels. The magnitude of this inflow contribution in vessels depends on the MRI parameters, TR and θ. When the TR allows arterial blood spins from outside the imaging slice to flow into capillaries and exchange with extravascular tissue water is sufficiently long (e.g., >1 second), spatially specific perfusion contrast appears. In the extravascular tissue pool, 1/T1*=1/T1+f/λ where f is CBF (mL blood/g tissue per second) and λ is the blood-to-tissue partition coefficient (mL blood/g tissue) (Detre et al, 1992). Both inflow and CBF effects are negligible only when TR>T1*. At 3 T, gray matter T1 is ∼1.5 seconds, while human gray matter f is ∼0.01 mL/g tissue per second and λ is ∼0.96 mL/g (Herscovitch and Raichle, 1985), giving a typical baseline T1* value of ∼1.48 seconds.
Blood Oxygenation Level-Dependent Relaxation Parameters (T2 and T2*)
R2* (=1/T2*) is the sum of R2 (=1/T2) and susceptibility-induced R2′ (=1/T2′), where R2* and R2 can be measured by gradient-echo (GE) and spin-echo (SE) MR techniques, respectively. Blood water R2 and R2* values are directly related to paramagnetic deoxyhemoglobin content (Thulborn et al, 1982). Water rapidly exchanges between deoxyhemoglobin-containing red blood cells and plasma, and also diffuses in the presence of the magnetic field gradients generated by the deoxyhemoglobin inside the vessel. These exchange and diffusion processes result in a loss of phase coherence, referred to as ‘dynamic' (time irreversible) averaging, and water molecules inside a given vessel experience these processes similarly. In addition to the deoxyhemoglobin content-related R2 change, a frequency change is also observed, which is dependent on magnetic field, oxygen saturation level, and the angle between vessel direction and B0 (Ogawa et al, 1993b). Since multiple vessels at different orientations typically exist within any given pixel, their multiple frequency shifts cause a phase dispersion (rather than a net phase shift), and a reduction in blood T2*.
The field gradient generated by deoxyhemoglobin decreases by (r/a)2, where r is the distance from vessel to the region of interest and a is the vessel radius. Thus, the susceptibility effect extends to extravascular tissue and nearby CSF. Additionally, the susceptibility effect depends on vessel orientation; there is no extravascular susceptibility effect around vessels running parallel to B0, while the maximum effect occurs around vessels orthogonal to B0 (Ogawa and Lee, 1990). Water proton spins dephase depending on its local susceptibility effect during TE; spins nearby a vein dephase larger than those far away. Thus, multiple frequency shifts within a given pixel result in phase dispersion and consequently MRI signal loss (see dark vessels in Figure 2B). In a pixel with numerous randomly oriented venous vessels, R2′ in extravascular tissue is closely related to the amount of deoxyhemoglobin (Ogawa et al, 1993b; Kennan et al, 1994; Weisskoff et al, 1994; Yablonskiy and Haacke, 1994; Boxerman et al, 1995). A simple biophysical model of susceptibility-induced R2′ is described here for ease of understanding, but a more complete theoretical description can be found in recent articles (Frohlich et al, 2005; Dickson et al, 2011). Based on Monte Carlo simulation (Ogawa et al, 1993b; Boxerman et al, 1995), the dephasing effect within a pixel can be approximated as R2′, which is A·CBVv{Δχ0ω0(1−Y)}β where CBVv is venous cerebral blood volume, Δχ0 is the susceptibility difference between fully deoxygenated blood and fully oxygenated blood, ω0 is the water resonance frequency (=γB0, where γ is the gyromagnetic ratio for the proton nucleus), and A and β are constants. The constant, A, is dependent on vessel size and orientation (note that α was used in Ogawa et al, 1993b), while the constant, β, has values between 1 (for large vessels) and 2 (for capillaries). Susceptibility effects (and therefore R2* and R2′) will increase whenever there is (1) an increase in venous CBV and consequent increase in deoxyhemoglobin content in the voxel, (2) a decrease in venous oxygen saturation level, or (3) an increase in magnetic field (ω0).
Non-blood oxygenation level-dependent contribution to functional magnetic resonance imaging signals
The relative contributions from spin density/volume fraction, inflow/CBF (T1*), and BOLD effects (T2 and T2*) are all dependent on the imaging parameters. Figure 3 includes a schematic of vascular responses to increased neural activity, and summarizes the expected contribution of these changes to MR-related parameters.
Figure 3.

Vascular responses to neural activity and expected changes to MR-related parameters. (A) This schematic adapted from Kim and Fukuda (2008) shows oxyhemoglobin (red dots) and deoxyhemoglobin (blue dots) in blood flowing through arteries, arterioles, capillaries, venules, and finally to veins. Oxygen delivered via oxyhemoglobin diffuses into extravascular tissue, and where it is used as a metabolic substrate. At prestimulus baseline conditions, blood oxygen saturation is ∼100% in arteries, while it is ∼60% in veins, although actual values vary with physiological condition. Increases in neural activity trigger an increase in blood velocity (indicated by the size of arrows) and dilation of vessels. The resulting increase in perfusion exceeds what is required by the increase in oxygen consumption rate, and the consequence is higher oxyhemoglobin levels and lower deoxyhemoglobin levels, such that capillary and venous oxygenation levels actually increase. (B) This table graphically illustrates the expected changes in the MR-related parameters of equation (1) for different compartments within each pixel due to vascular responses to neural activity. For simplicity, it is assumed that capillaries are composed of both arterial and venous blood. Upward arrows indicate an increase during stimulus, downward arrows indicate a decrease, and horizontal arrows indicate no change. BOLD, blood oxygenation level dependent; MR, magnetic resonance.
Effect of Water Proton Spin Density (ρ) and Volume Fractions (V)
Stimulus-induced dilation of vessels increases CBV, thus increasing the volume fractions of arterial and venous blood. Under the constraint of constant intracranial brain volume dictated by the Monro–Kellie doctrine, there must be a corresponding reduction of the volume fractions of extravascular tissue and CSF. Indeed, the vascular space occupancy technique (Lu et al, 2003) showed that increases in CBV reduce the tissue volume fraction in pixels without CSF. Cortical surface boundaries may then expand, reducing the CSF volume fraction (Jin and Kim, 2010).
In fMRI studies, it may be not possible to separate changes in ρ from changes in V, since both components are independent of TE and TR. There is no strong evidence that ρ increases with stimulation, but any change in V could be interpreted as a change in ρ. Stroman et al (2003) proposed a nonBOLD contrast mechanism for fMRI based on the changes in extravascular spin density, and called it signal enhancement by extravascular water protons. In fast-spin-echo BOLD fMRI studies of human spinal cord, TE-dependent signal changes were nonlinear, indicating the existence of more than one compartment (Stroman et al, 2005). Spin-echo BOLD fMRI studies of the cerebral cortex in animals and humans also show nonlinear TE-dependent signal changes (similar to Stroman's findings). However, when vascular signal contributions were removed with flow-crushing gradients (Yacoub et al, 2003; Jochimsen et al, 2005; Jin et al, 2006), the TE-dependent signal changes were linear, indicating that the nonBOLD contrast observed in vivo is not due to a change in spin density, but rather to changes in vascular contributions.
Effect of Inflow and Cerebral Blood Flow (T1*)
Stimulus-induced increases in blood velocity/inflow in pixels containing large vessels act to reduce blood T1*, thereby increasing the fMRI response (Segebarth et al, 1994). This large-vessel inflow contribution is undesirable in fMRI studies, as it decreases spatial specificity. If the CBF contribution is significant in MRI signals, then any stimulus-induced increases in CBF will decrease T1* in extravascular tissue and increase fMRI signals. However, in typical fMRI studies with ∼3 × 3 × 3 mm3 resolution and 2 to 3 seconds temporal resolution, stimulus-induced nonBOLD effects are not likely significant contributions to fMRI signal changes.
Blood oxygenation level-dependent contributions to gradient-echo and spin-echo functional magnetic resonance imaging signals
To understand the biophysical basis of BOLD-based fMRI, it is important to examine intravascular and extravascular contributions to the BOLD signal. Note that more complete BOLD modeling of intravascular and extravascular contributions has been reported recently (Uludag et al, 2009; Griffeth and Buxton, 2011), which is beyond the scope of this review.
Intravascular Blood Oxygenation Level-Dependent Components
The intravascular BOLD signal almost linearly increases when TE<blood T2 for SE studies or TE<blood T2* for GE studies becomes maximal at TE=T2 or T2* of blood, and decreases thereafter (Duong et al, 2003; Jin et al, 2006; Uludag et al, 2009). This intravascular BOLD contribution can be estimated from blood relaxation times for different experimental conditions. Blood R2 (=1/T2) is quadratically dependent on the deoxygenation level (1−Y, where Y is blood oxygen saturation fraction) and magnetic field (B0) (Wright et al, 1991). T2 values of blood water for Y=0.6 are ∼127 ms at 1.5 T (Wright et al, 1991), ∼31 ms at 3 T (Zhao et al, 2007), and ∼12 to 15 ms at 7 T (Ogawa et al, 1993a), while T2 values of gray matter water are 90 ms at 1.5 T (Breger et al, 1989), 71 ms at 3 T (Gelman et al, 1999), and 55 ms at 7 T (Yacoub et al, 2001). Note that in-vivo blood T2 and T2* values are typically shorter than the values measured in vitro due to the additional inflow effects during measurements. As the magnetic field increases, venous blood T2 and T2* values decrease faster than corresponding tissue T2 and T2* values; therefore at ultrahigh fields, the intravascular component can be significantly reduced.
Extravascular Blood Oxygenation Level-Dependent Components
During the TE typically chosen for fMRI studies (∼50 ms), water molecules diffuse 10 to 20 μm. Thus, phase coherence from extravascular tissue water near capillaries will be dynamically averaged over the steep field gradients produced by blood deoxyhemoglobin, while near large veins it will be locally averaged across smaller field gradients (see schematic in Kim and Ugurbil, 2003). The dephasing effect around large veins can be refocused by a 180° radiofrequency pulse. In GE BOLD fMRI, the extravascular effect around small vessels is supralinearly dependent on B0, while the extravascular effect around large vessels is linearly dependent on B0 (Ogawa et al, 1993b); thus, at higher B0, the extravascular contribution of small vessel-related signals increases; however, even at 9.4 T, the extravascular effect around large vessels is still significant in GE BOLD fMRI studies (Zhao et al, 2004). These extravascular contributions from large vessels can be reduced with SE techniques. Both SE and GE extravascular BOLD fMRI signals are almost linearly dependent on TE within the commonly used TE ranges (e.g., Yacoub et al, 2003; Jin et al, 2006).
Separation of Intravascular and Extravascular Blood Oxygenation Level-Dependent Components
The relative contribution of intravascular versus extravascular signals to BOLD fMRI responses can be examined using small diffusion gradients (e.g., b value <200 to 300 s/mm2; Song et al, 1996). Diffusion-weighted gradients induce velocity-dependent phase shifts in the presence of flow, and consequently reduce signals from blood due to the inhomogeneous velocities within a vessel and the presence of blood vessels at different orientations within a pixel. Increasing the magnitude of diffusion weighting progressively attenuates the intravascular signals from faster flowing to slower flowing blood. Table 1 summarizes intravascular fractions (=1 −BOLD with diffusion gradients/BOLD without diffusion gradients) from the literature. It should be noted that small diffusion gradients may not totally remove the intravascular contributions from small vessels (including capillaries), and thus the literature intravascular fraction values are likely to be slightly underestimated. In summary, the intravascular contribution decreases as magnetic field strength increases (1.5 T versus 7 and 9.4 T) and as TE increases (e.g., at 4 T, the intravascular fractions are 0.75 (TE=32 ms) and 0.2 (TE=64 ms)). As expected, pial vessel regions have higher intravascular contributions than cortical regions (see Figure 3D in Jin et al, 2006); even at 9.4 T, when TE=16 ms, the intravascular fraction from pial vessel regions can be up to 60%.
Table 1. Summary of intravascular attenuation by diffusion gradients in BOLD studiesa.
| Magnetic field (T) | MR technique, echo time (ms) | b value (s/mm2) | Subject, brain region | Intravenous fraction | Reference |
|---|---|---|---|---|---|
| 1.5 | ASE, 165 | 10–690 | Human, V1 | 0.5–0.7 | Boxerman et al (1995) |
| SE, 125 | 200–700 | Human, V1 | 0.6–1.0 | Zhong et al (1998) (Figure 4B) | |
| GE, 82 | 165–660 | Human, M1 | 0.6–0.9 | Song et al (1996) | |
| GE, 33–93 | 100 | Human, V1 | 0.46–0.62b | Donahue et al (2011)c | |
| 3.0 | SE, 96.5 | 14–454 | Human, V1 | ∼0.5 | Jochimsen et al (2004) |
| GE, 32.7–70.7 | 100 | Human, V1 | 0.22–0.4b | Donahue et al (2011)c | |
| 4.0 | SE, 32 and 65 | 40–400 | Human, V1 | 0.2–0.75b | Duong et al (2003) |
| GE, 80 | 20–500 | Human, V1 | ∼0 | Duong et al (2003) | |
| 7.0 | SE, 32 and 55 | 40–400 | Human, V1 | 0.1–0.2b | Duong et al (2003) |
| GE, 55 | 20–500 | Human, V1 | ∼0 | Duong et al (2003) | |
| GE, 28.6–46.6 | 100 | Human, V1 | 0.08–0.16b | Donahue et al (2011)c | |
| 9.4 | SE, 40 | 30–500 | Rat, S1 | ∼0 | Lee et al (1999) |
| SE, 16–70 | 200 | Cat, V1 | 0–0.6b | Jin et al (2006)d |
ASE, asymmetric spin echo; SE, spin echo; GE, gradient echo; V1, visual cortex; M1, motor cortex; S1, somatosensory cortex; TE, echo time; BOLD, blood oxygenation level-dependent; MR, magnetic resonance.
Intravenous fraction is determined as (1–the percent BOLD signal with diffusion gradients normalized by the percent BOLD signal without diffusion gradients).
Higher intravenous fraction values were obtained from the lowest TE values.
Region of interest (ROI) data from Table 2 of Donahue et al (2011).
Although two ROIs were selected (a region with pial veins at the cortical surface and a cortical region containing venous vessels, see Figure 3 in Jin et al, 2006), only data from cortical surface ROIs are reported here to include a larger intravenous contribution.
Spatial specificity and sensitivity of blood oxygenation level-dependent functional magnetic resonance imaging
Spatial resolution of BOLD fMRI is determined not only by intrinsic hemodynamic responses, but also by the vascular structure. One important issue for extremely high-resolution studies is that pixels with different baseline CBVv values will have different BOLD fMRI signal changes for similar oxygenation level changes. To compare BOLD signals across pixels, it is therefore important that pixels have similar vascular properties (both density and diameters).
In BOLD fMRI studies, draining of deoxyhemoglobin from the capillaries (spatially specific to regions of neural activation) to intracortical veins and then to pial veins is one major concern of spatial specificity. As the diameters of these downstream vessels progressively increase, this deoxygenated blood combines with blood draining from other sources. The deoxyhemoglobin change in these draining veins is therefore dependent on their distance from the activated area (Turner, 2002), and on the spatial extent of neural response. When the area of activation is small, this deoxygenated blood is quickly diluted with blood from inactivated regions, effectively reducing the oxygenation level change in adjacent regions. Thus, GE BOLD fMRI is capable of differentiating small functional modules such as single whisker barrels (Yang et al, 1996). However, when a large brain area responds to stimulus, much of the blood draining into the large downstream vessels also has origins from activated regions, so in addition to the spatially specific contributions, there will also be nonspecific contributions from large vessels. This is the case in the GE BOLD fMRI example of cat visual cortex in Figure 4, where nonspecific contributions are seen in pial vessels at the cortical surface and in CSF regions (yellow pixels in green-outlined regions). These nonspecific signal changes can be significantly reduced with SE BOLD fMRI (Figure 4B), improving the spatial specificity to small-sized vessels and nearby tissue, whose location correlates well with the dilations of cortical vessels as seen in the results of CBV fMRI using exogenous intravascular contrast agent with high susceptibility (Kennan et al, 1998; Mandeville et al, 1998; van Bruggen et al, 1998; see Figure 4C).
Figure 4.

High-resolution fMRI of cat visual cortex. GE BOLD, SE BOLD, and CBV fMRI studies were performed at 9.4 T with 156 μm in-plane resolution and 2 mm slice thickness (Zhao et al, 2006); CBV fMRI was obtained after intravascular injection of long half-life iron oxide nanoparticles. During full-field binocular visual stimulus, it is expected that layer 4 will have the highest metabolic and CBF responses (Lowel et al, 1987), as well as the highest synaptic density and highest cytochrome oxidase activity (Woolsey et al, 1996). If an fMRI technique is highly specific to metabolic response and neural activity, then the middle of the cortex should therefore shows the highest signal change. In these studies, the highest CBV change (C) indeed occurred at the middle of the visual cortex in layer 4. GE BOLD fMRI (A) has the highest percent signal change at the cortical surface, where large pial vessels are located (green contours), while large vessel contributions are suppressed in SE BOLD (B). BOLD, blood oxygenation level dependent; fMRI, functional magnetic resonance imaging; GE, gradient echo; SE, spin echo; CBV, cerebral blood volume; TE, echo time; CBF, cerebral blood flow.
The SE BOLD fMRI technique at high magnetic field is thus preferable for mapping submillimeter functional structures if the nonspecific large vessel contribution is significant. Note that SE BOLD fMRI with small diffusion gradients improves spatial specificity (similarly to the effect of acquiring SE BOLD fMRI at high magnetic field). But since SE BOLD signal sensitivity is significantly reduced due to refocusing of the dephasing effect around large vessels, and since the additional refocusing radiofrequency pulse increases power deposition to tissue, the GE BOLD technique is often the tool of choice. Large vessel contributions can also be reduced by postprocessing approaches as described below. The location of large pial venous vessels can also be determined from venographic images obtained with high-resolution T2*-weighted MR techniques (see Figure 2B), or can be inferred from structures adjacent to the cortex such as sulci and CSF determined from anatomical images. Large venous vessel areas tend to show large BOLD percentage changes (see Figure 4A), delayed responses (Lee et al, 1995), significant phase changes (Menon, 2002), and large baseline fluctuations (Kim et al, 1994). Importantly, although relative signal changes are high in large vessel regions (Figure 4A), absolute signal changes (and statistical values) are reduced at high magnetic fields due to reduced baseline signal intensities within and near large veins, as discussed in the prior section ‘Intravascular BOLD components'.
The ultimate spatial specificity of hemodynamic-based fMRI ultimately depends on how finely the blood flow is regulated. If intracortical arteries are independently regulated, then spatial resolution can be as fine as 0.33 to 2 mm for arterial blood-based fMRI measurements (Duvernoy et al, 1981). If precapillary arterioles regulate the hemodynamic changes, then achievable spatial resolution is even better. Studies by fMRI suggest that intrinsic CBF and CBV fMRI responses are reasonably specific to submillimeter functional domains (Duong et al, 2001; Zhao et al, 2005), which in cat cortex are on the order of 0.5 to 0.7 mm in diameter (roughly corresponding to the diameter of the arterial unit for groups 2 to 3 arteries). Recent papers indicate that precapillary arterioles indeed dilate during stimulus via astrocyte-capillary signaling (see review articles, Attwell et al, 2010; Petzold and Murthy, 2011). In fact, capillary network responses precisely outline regions of neural activity in the rat olfactory bulb (Chaigneau et al, 2003), suggesting that spatial resolution of hemodynamic-based fMRI can be on the order of ∼100 μm if only capillary signals are detected. Intrinsic spatial resolution for the venous vessel-based BOLD response is ∼1 mm (the diameter of the venous unit for groups 2 to 3 veins). If only small-sized venous vessels are detected, then BOLD spatial resolution improves; however, its spatial specificity is still poorer than techniques based on capillary changes.
Physiological sources of blood oxygenation level-dependent functional magnetic resonance imaging signals
The functional change in venous blood oxygenation level (Y) is dependent on the mismatch between CBF and CMRO2 changes. Assuming arterial Y=1.0 and constant hematocrit, the relative change in venous Y can be determined from relative changes to both CBF and CMRO2 as
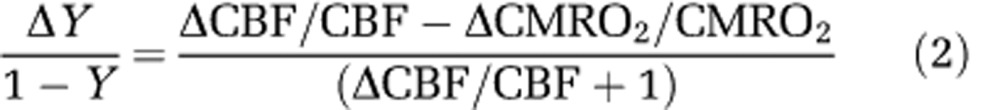 |
where Δ refers to the stimulus-induced change. An increase in venous oxygenation level decreases the blood OEF (oxygen extraction fraction) from blood to tissue (1−Y=OEF). When relative changes in CBF and CMRO2 are similar, ΔY will be close to zero, but when the relative change in CBF is much larger than the relative change in CMRO2, ΔY will be highly correlated with the CBF change.
Assuming that hematocrit level in venous blood does not change with stimulus, the BOLD signal change in extravascular tissue can be approximated (Davis et al, 1998) as
 |
where M is a constant, related to baseline physiological, vascular, and imaging parameters. Value for β of 1.5 is commonly assumed (Davis et al, 1998). The first physiological term of equation (3) relates to the mismatch between relative oxygen consumption and CBF change, while the second physiological term relates to the relative CBV change, calculated from Grubb's formula as (1+ΔCBV/CBV)=(1+ΔCBF/CBF)α, where α is the flow-volume converting power term (Grubb et al, 1974). An α value of 0.38 was obtained in anesthetized monkeys under global challenge (Grubb et al, 1974) and has been used for most human BOLD modeling studies (e.g., Davis et al, 1998).
Calibration constant M is highly dependent on imaging sequences (SE versus GE) and parameters (TE and B0), thus should not directly compare across literature values. M can be simulated assuming normal physiological and vascular parameter values (Ogawa et al, 1993b; Kim and Ugurbil, 1997a; Hyder et al, 2001), or can be experimentally determined by inducing hemodynamic changes without metabolic changes (Davis et al, 1998). Calibration studies with hypercapnia (Davis et al, 1998; Hoge et al, 1999b; Kim et al, 1999), hyperoxia (Chiarelli et al, 2007), or breath hold (Kastrup et al, 1999) measured CBF and BOLD to determine M from equation (3) with the assumption that ΔCMRO2=0. The fMRI community commonly determines oxygen metabolic changes from calibration with equation (3). The choice of initial assumed β value does not change the calculated ΔCMRO2/CMRO2 because the determined M factor is also adjusted accordingly (Davis et al, 1998). However, one important underlying assumption is that the total CBV change obtained from the CBF change with Grubb's equation is the same as the BOLD-induced venous CBV (CBVv) change (see additional assumptions in Kim et al, 1999). This assumption may be invalid (see later), and if so, then reported literature values for quantitative functional CMRO2 changes obtained from BOLD fMRI data may contain significant errors.
To easily conceptualize equation (3), a first-order linear approximation can be performed (Kim et al, 1999) as
 |
This approximation shows that an increase in Y (a decrease in OEF) will increase fMRI signal, while an increase in CBVv decreases fMRI signal. The term ΔY/(1−Y) is larger than the term ΔCBVv/(β·CBVv), and when venous CBV changes are negligible in equation (4), the BOLD signal change is simply related to the venous oxygenation level change weighted by baseline venous blood volume.
Since CBF, CMRO2, and CBVv responses contribute to BOLD fMRI dynamics (see equation (4)), these physiological contributions can be explained with biophysical models (e.g., Ogawa et al, 1993b; Boxerman et al, 1995; Ogawa et al, 1998). Quantitative contribution of physiological changes to BOLD fMRI responses requires knowledge of constants (e.g., M and α in equation (2)) not easily determined. Therefore, we describe only the properties of different physiological parameters and their impact on dynamic BOLD fMRI signals.
Dynamic Cerebral Blood Flow Responses
The CBF changes can be measured by perfusion-based fMRI techniques using arterial blood water as an endogenous flow tracer. Numerous CBF measurements have been performed with various stimuli (e.g., Kwong et al, 1992; Edelman et al, 1994; Kim, 1995). Perfusion-based fMRI methods have poor temporal resolution due to the requirement that spins from arterial blood outside the imaging slice must have sufficient time to move into capillaries and exchange with extravascular tissue water, and because control images must also be acquired. Usually, stimulus onset causes CBF to initially rise to an ‘overshoot' level, after which the increase in CBF decreases to a slightly lower ‘plateau' level during stimulus continuance. These increased CBF levels will increase venous oxygen saturation, which is directly related to a positive BOLD response.
Dynamic CBF responses at high temporal resolution can be obtained with a conventional laser Doppler flowmeter or from fMRI (e.g., Silva and Kim, 1999). Since blood flow dictates that arterial blood responses precede those of venous vessels, the CBF response is ∼0.5 to 1 second earlier than the BOLD response. To show the difference in hemodynamic onset times, CBF and BOLD responses in the rat somatosensory cortex to forepaw stimulus are plotted in Figure 5A (Silva et al, 2000); the CBF increase occurs ∼0.5 second after stimulus onset, while the BOLD response occurs ∼0.5 second later.
Figure 5.

Dynamic changes in stimulus-induced CBF, BOLD, CBV, and CMRO2-related fMRI signals. Stimulus starts at time=0 second and stimulus periods are indicated by black horizontal bars. (A) Dynamic CBF and BOLD responses to forepaw stimulus were obtained in the rat somatosensory cortex (Silva et al, 2000). These time courses for regions of interest from the cortical ‘surface' and the middle of the cortex (‘deep') show that the CBF response is earlier than the BOLD response. (B) Dynamic BOLD, CBV, and CMRO2-related responses were obtained in cat visual cortex (Nagaoka et al, 2006). BOLD and CBV data were obtained at normal physiological conditions, while the CMRO2-related change was acquired with infusion of a vasodilator to suppress stimulus-induced CBF and CBV changes. The CBV response was obtained after intravascular injection of iron oxide nanoparticles. Peak intensity from the time course of each response type was used for normalization. The BOLD response starts slightly later than CBVt and CMRO2 responses, but BOLD and CBVt peak times are similar during 10 seconds stimulation, with a lag in CMRO2 peak time. Note that a small BOLD dip was observed. (C) The amplitude and dynamics of BOLD responses in human visual cortex (Cohen et al, 2002) are closely dependent on baseline CBF levels. When baseline CBF is low due to hypocapnia, the BOLD response is of higher amplitude and faster versus normocapnia. Conversely, when baseline CBF is high due to hypercapnia, the BOLD response is of lower amplitude and sluggish versus normocapnia. BOLD, blood oxygenation level dependent; fMRI, functional magnetic resonance imaging; CBV, cerebral blood volume; CBF, cerebral blood flow; CMRO2, cerebral metabolic rate of oxygen utilization; CBVt, total CBV.
Dynamic Cerebral Metabolic Rate of Oxygen Utilization-Related Changes
It is well accepted that the CBF increase with stimulus more than compensates for the functional CMRO2 increase, and it was also generally assumed that CMRO2 increases rapidly and peaks quickly after stimulus onset. Most in-vivo assessments of dynamic changes in CMRO2 rely on blood oxygenation measurements. The aforementioned calibration studies have suggested that functional increases in CMRO2 are concomitant with increases in CBF (e.g., Davis et al, 1998). This observation is largely due to the overwhelming contribution of stimulus-induced CBF increases to blood oxygenation changes (Chiarelli et al, 2007). In addition, the calibration method assumes that the oxygen extracted from blood is instantaneously consumed by tissue cells, and the observed CMRO2 is same as the actual cellular response.
The above confounds are removed when a vasodilator is infused to suppress CBF and CBV functional responses (Fukuda et al, 2006; Nagaoka et al, 2006), such that stimulus-induced dynamic changes in blood oxygenation levels measured by fMRI indicate solely CMRO2 responses. This approach shows a functional CMRO2 response that begins earlier, but surprisingly peaks later than the BOLD response (Nagaoka et al, 2006) (see blue versus red time courses in Figure 5B). A similar slow functional CMRO2 response compared with CBF response was also observed in tissue oxygen tension data (Masamoto et al, 2008). The delayed peak in functional CMRO2 response (versus BOLD and CBF) may be explained by the astrocyte-neuron-lactate-shuttle hypothesis (reviews in Pellerin et al, 2007), in which lactate is produced by increased glycolysis in astrocytes and then becomes the primary substrate for oxidative metabolism in neurons.
An alternative reason for observing delayed peaks in CMRO2 responses by fMRI may involve temporal latencies between mitochondrial oxygen consumption and changes in venous blood oxygenation levels. This issue was recently examined by measuring dynamic cellular CMRO2 changes with flavoprotein autofluorescence imaging (Vazquez et al, 2012), where it was found that the tissue mitochondrial CMRO2 responds relatively fast (time constant ∼1 second) compared with the venous oxygenation level change (time constant ∼10 seconds), showing that dynamic CMRO2 responses obtained from BOLD fMRI do not instantaneously reflect temporal changes in tissue mitochondrial metabolic rates.
Dynamic Cerebral Blood Volume Responses
Dynamic CBF and CBV changes are intercorrelated, since CBF is dependent on CBV and velocity changes. The total CBV (CBVt) change can be estimated from the CBF change (Grubb et al, 1974), or can be measured with intravascular injection of contrast agent (Kennan et al, 1998; Mandeville et al, 1998; van Bruggen et al, 1998) (see Figures 4C and 5B) or by the vascular space occupancy method (Lu et al, 2003). In some early studies, the BOLD contribution to CBV-weighted fMRI was not corrected, leading to errors in quantifying dynamic CBV changes. More recently, it has been consistently observed that the CBVt response occurs earlier than the BOLD response (see green versus red time courses in Figure 5B).
Total CBV can be subdivided into arterial and venous components. Since ∼60% to 80% of baseline CBVt is from CBVv (Ito et al, 2001; Lee et al, 2001; An and Lin, 2002b), it is often assumed that stimulus-induced CBVt changes are dominated by CBVv changes (Buxton et al, 1998; Mandeville et al, 1999). This assumption has been used to determine changes in venous oxygenation level and CMRO2 from BOLD fMRI data. But determination of CMRO2 from CBF and BOLD fMRI data depends on understanding venous—not total—CBV changes (see equation (4)).
Compartment-specific CBV studies indicate that the CBVv change is actually much less than the CBVt change. Within a short stimulus period (<15 seconds), rat fMRI studies showed that arterial CBV (CBVa) changes are dominant, while CBVv changes are minimal (Kim et al, 2007). During a long stimulus period, CBVv increases slowly in cat studies (Figure 6A), eventually reaching a magnitude similar to the CBVa change (Kim and Kim, 2011). At a steady state, the relative change in CBVv is about half that of CBVt in rat studies (Lee et al, 2001). Similar observations were also detected in optical studies in rodents, where arterial dilation was dominant with short stimulus duration (Hillman et al, 2007; Vazquez et al, 2010; Drew et al, 2011; see also Figure 6D), and venous dilation occurred slowly with extended stimulus (Drew et al, 2011). After stimulus offset, cat fMRI studies show that CBVa rapidly decreases to baseline values or exhibits a small prolonged poststimulus undershoot, while CBVv is slow to return to baseline values (Figure 6A). Although low sensitivity and large signal fluctuations indeed complicate identification of poststimulus CBVa undershoots, it should be noted that similar poststimulus undershoots were observed in CBF fMRI data from the same animal model (see Figure 1D in Jin and Kim, 2008) and in surface arteriolar vessel diameters measured by two-photon microscopy in mice after termination of a 30-second vibrissae stimulus (see Figure 2 in Drew et al, 2011). In humans, positron emission tomographic studies showed that the CBVa change is dominant during hypocapnia and hypercapnia, while the CBVv change is minimal (Ito et al, 2005). Venous CBV can be noninvasively determined with the MRI technique named VERVE (venous refocusing for volume estimation) (Stefanovic and Pike, 2005), which relies on multispin-echo measurements with different interpulse delays. Recent fMRI measurements with VERVE in humans show that functional CBVv responses are significant during stimulation and the power exponent, α, is 0.23 during neural stimulus (Chen and Pike, 2009a) and 0.18 during steady-state global hypocapnia and hypercapnia challenges (Chen and Pike, 2010).
Figure 6.

Compartment-specific CBV changes during sensory stimulus. (A) Corresponding total, arterial, and venous CBV changes were measured by fMRI in the cat visual cortex (Kim and Kim, 2011). The arterial CBV change was obtained by fMRI using the varied magnetization transfer effect (Kim et al, 2008), while total CBV was determined with intravascular infusion of iron oxide nanoparticles. The venous CBV change was then estimated by the difference in total CBV and arterial CBV changes. The arterial CBV response is rapid like the total CBV response, while the venous CBV change is relatively slow. (B–D) Imaging of the rat somatosensory cortex followed isoflurane anesthesia and craniotomy (provided by Alberto Vazquez at the University of Pittsburgh). Intrinsic optical image with signal weighted to red blood cells shows pial vessels as hypointense structures (B). Baseline fluorescent microscopic images (C) enhanced by intravascular injection of Texas red dye show arterial and venous vessels (indicated by ‘A' and ‘V', respectively) as hyperintense structures. In the functional change map (D) determined by the difference between baseline images and images acquired during 4 seconds of forepaw stimulus, the highest signal intensities indicate stimulus-induced increases in dye content due to dilation. Only arterial vessels dilate, while venous vessels do not. fMRI, functional magnetic resonance imaging; CBV, cerebral blood volume.
The recent CBVv studies have three important implications for BOLD quantification: (1) since during stimulus the relative CBVv change is less than relative CBVt change, relative CMRO2 changes are underestimated when obtained with equation (3) and an α value of 0.38, as in most fMRI calibration studies (e.g., Davis et al, 1998), even at a steady state; (2) a decrease in BOLD signals with constant CBF during the stimulus period (Frahm et al, 1996) can be explained by a slow increase in CBVv; and (3) the time-independent BOLD linearity may not hold due to the time-dependent CBVv contribution when short versus long stimulus data are compared. If functional CBVv response is not experimentally measured, then the CBVv response determined from the relationship between CBF and CBVv should be used for the determination of ΔY and ΔCMRO2 from BOLD data. One simple approach for determining CMRO2 change from the BOLD fMRI signal is to minimize the neural stimulus-induced CBVv response with a relatively short stimulus (such as <15 seconds), and then to consider only venous oxygenation changes in the BOLD biophysical model (see equation (4)).
Dynamic Blood Oxygenation Level-Dependent Responses
The BOLD response function is determined by CBF, CMRO2, and CBVv changes. Since the BOLD response is sensitive to the draining effects from capillaries to pial veins, pixel-to-pixel differences in vascular content mean that even if stimulus-induced changes in CBF, CMRO2, and CBVv were identical across pixels, BOLD dynamic responses (onset time, time-to-peak, etc.) would still be expected to vary across pixels (Lee et al, 1995). This draining of blood into pial veins makes the BOLD response in the middle of the cortex start ∼0.5 second before the BOLD response at the cortical surface in rat somatosensory cortex (Silva et al, 2000; Tian et al, 2010), cat visual cortex (Jin and Kim, 2008), and human visual cortex (Siero et al, 2011). If instead fMRI signals from all pixels within an image originate mostly from microvessels including capillaries, then onset times should correspond to the capillary response times, which are likely to be similar across regions. If the microvessel contribution is dominant, then the difference in hemodynamic responses between regions may then be used to infer sequential neural activity (Buckner et al, 1996; Richter et al, 1997; Menon et al, 1998; Ogawa et al, 2000).
Sources of initial blood oxygenation level-dependent dips, poststimulus blood oxygenation level-dependent undershoots, and prolonged negative blood oxygenation level-dependent functional magnetic resonance imaging signals
Prolonged positive responses (where stimulus-induced signals are higher than baseline signals) are not the only type of response observed with conventional BOLD fMRI. Understanding signal sources of negative BOLD fMRI signals (signals lower than baseline), such as initial dips, poststimulus undershoots, and prolonged negative signals is of great interest.
Initial Blood Oxygenation Level-Dependent Dips
Optical spectroscopy studies by Malonek and Grinvald (1996) showed a delayed hemodynamic response that was diffuse with large spatial extent and also an initial CMRO2-based deoxyhemoglobin signal increase (termed the ‘optical dip') that was highly localized to the site of neuronal activity. Although the exact origin of the deoxyhemoglobin-weighted optical dip is still controversial (Malonek and Grinvald, 1996; Sirotin et al, 2009), it has been commonly observed. Similarly to the optical dip, a small initial BOLD dip has been detected in humans (Ernst and Hennig, 1994; Menon et al, 1995; Hu et al, 1997) and in animals (Kim et al, 2000) (see also red BOLD time course in Figure 5B), though existence of this response is still debated (Buxton, 2001). The initial BOLD dip may reflect (1) an increase in deoxyhemoglobin concentration due to CMRO2 increases before the CBF response and (2) an increase in CBVv preceding the CBF response. Recent measurements of vessel diameters (Drew et al, 2011) and CBV fMRI (Kim and Kim, 2011) during stimulus show a slow increase in CBVv (see Figure 6A), with no evidence of significant venous vessel dilation during the initial period, suggesting that the initial BOLD dip is due to an early mismatch between CMRO2 and CBF changes. However, detection of a highly localized initial BOLD dip requires both high spatial resolution and high temporal resolution, and the resulting reduction in sensitivity may not be practical for high-resolution fMRI studies.
Poststimulus Blood Oxygenation Level-Dependent Undershoots
One or more physiological factors may contribute to a poststimulus BOLD undershoot, including a poststimulus CBF undershoot (Hoge et al, 1999a; Jin and Kim, 2008; Chen and Pike, 2009b), a slow poststimulus return of CBVv to baseline (Mandeville et al, 1998; Chen and Pike, 2009b; Hua et al, 2011; Kim and Kim, 2011), and a slow poststimulus return of CMRO2-related oxygenation values to baseline (Frahm et al, 1996; Yacoub et al, 2006; Hua et al, 2011). One should be careful when interpreting early findings, because (1) CBVt responses are often measured instead of CBVv, (2) at high magnetic field studies, both CBF and CBV responses often contaminate the BOLD signal, and (3) there is no direct means of dynamically measuring CMRO2. In recent BOLD, CBF, and CBVv fMRI studies to explain the poststimulus BOLD fMRI undershoot, one report (Hua et al, 2011) suggested that ∼80% of the BOLD fMRI undershoot is from a slow return of CMRO2-related contributions, with the remainder related to a slow return of CBVv contributions, and no CBF undershoot contributions, while another paper (Chen and Pike, 2009b) reported that both a CBF undershoot and a slow return of CBVv to baseline are contributors. Exact contributors of the poststimulus undershoot may also depend on stimulus type and duration.
Even if CMRO2-related factors are dominant contributors to the poststimulus BOLD undershoot, this is still not an indication of an increase in cellular CMRO2 during the poststimulus period, as discussed previously in ‘Dynamic CMRO2-related changes'. More importantly, is the poststimulus BOLD undershoot useful for high-resolution fMRI? The answer is the same as for initial BOLD dips: although any CMRO2-related BOLD signal would improve spatial specificity to areas of neuronal activity, both high spatial resolution and high temporal resolution would be required to localize deoxyhemoglobin in capillaries before it drains into large vessels, with the resulting loss of sensitivity. Therefore, the usefulness of the poststimulus BOLD undershoot for high-resolution functional imaging studies is dependent on its signal sources.
Prolonged Negative Blood Oxygenation Level-Dependent Functional Magnetic Resonance Imaging Signals
Negative BOLD signals occurring during a stimulus period may be explained by (1) a decrease in CBF due to neural inhibition (Shmuel et al, 2002, 2006; Boorman et al, 2010; Wade and Rowland, 2010), (2) a decrease in CBF due to redistribution of CBF (the steal effect) into nearby active regions (Harel et al, 2002), (3) an increase in CMRO2 without concomitant CBF increase (Schridde et al, 2008), and (4) an increase in vasoconstrictive neurotransmitter with increased neural activity in subcortical areas (Shih et al, 2009). In areas where vascular reactivity is hampered, a negative BOLD response is likely due to increased CMRO2 without a concomitant increase in CBF. The physiological basis of negative BOLD signals therefore depends on stimulus type and brain region (e.g., cortical versus subcortical areas).
Influence of global hemodynamic baseline conditions on stimulus-evoked blood oxygenation level-dependent responses
It is well known that global CBF can be modulated by changes in arterial partial pressures of carbon dioxide and oxygen. It has also been shown or suggested that global perturbation of CBF can result from the intake of commonly used substances (e.g., caffeine, nicotine, and alcohol), changes in the concentration of endogenous substances (e.g., estrogen and adrenaline), or experimental administration of various drugs (e.g., cocaine or acetazolamide). These global CBF changes can affect the dynamics and magnitude of BOLD responses (Hoge et al, 1999a; Kemna and Posse, 2001; Cohen et al, 2002). Typically, when baseline CBF (and consequently baseline venous oxygenation) is low, the BOLD response is fast and intense (Cohen et al, 2002; Lu et al, 2008). For example, a faster and larger stimulus-evoked BOLD response occurs under hypocapnic conditions (black trace in Figure 5C) or with intake of the vasoconstrictor caffeine (Mulderink et al, 2002), while a slower and smaller response occurs with alcohol intake (Levin et al, 1998). Baseline-condition dependence of BOLD responses may be due to (1) a nonlinear relationships between BOLD responses versus baseline-dependent values of Y or (2) baseline-condition dependence of CBF responses. At higher baseline venous oxygenation levels, the maximal allowable value for ΔY decreases; and as ΔY approaches zero, the BOLD response no longer linearly correlates with CBF changes, especially for extremely large CBF responses (Lee et al, 2002). However, within the range of normal physiological conditions, it is most likely that baseline-condition dependence of BOLD responses is due to baseline-condition dependence of CBF responses.
Additionally, the hemodynamic response is sensitive to age (Yamada et al, 2000; Desposito et al, 2003), patterns of resting-state fluctuations, and resting-state neurotransmitter levels (Muthukumaraswamy et al, 2009). When the stimulus-induced fMRI response is compared under different physiological or pharmacological states, investigators must distinguish between effects resulting from altered neural activity and those resulting merely from global hemodynamic influences.
Basis of resting-state blood oxygenation level-dependent fluctuations
A seminal report by Biswal et al (1995) showed that in the resting-state, slow temporal fluctuations (<0.1 Hz) in BOLD responses were correlated between functionally related areas, as defined by conventional stimulus-evoked fMRI, suggesting that large-scale neural networks could be mapped without task performance. Despite some concern that some contributions to these fluctuations could be due to vasomotor oscillations (Mitra et al, 1997), there is sufficient evidence of neural contributions to resting-state BOLD fluctuations. The field of resting-state fMRI expanded greatly after large-scale ‘default-mode networks' was discovered in humans (Raichle et al, 2001) and in anesthetized monkeys (Vincent et al, 2007). Resting-state BOLD fMRI has become an important tool for empirically mapping various interhemispheric and intrahemispheric local and global networks and assessing connectivity in normal and diseased brains. Still, the relationship between resting-state BOLD fMRI and neural activity or neurovascular coupling is an area of intense research (see review article, Fox and Raichle, 2007). In monkey studies, Leopold and Logothetis (Leopold et al, 2003) measured fluctuations in band-limited power of LFP signals and found high coherence over cortical distances >1 cm, indicating that resting-state BOLD fluctuations reflect ongoing (spontaneous and coherent) neural activity. A question that needs to be answered by systematic investigation is whether the sources of resting-state BOLD responses are similar to those of stimulus-induced responses.
Concluding remarks
The BOLD effect in fMRI is very complex, and thus is still an area of intense research. However, the following conclusions can be drawn from our experiences and review of the existing literature.
Contrast in BOLD fMRI is determined by both intravascular and extravascular signal changes. With higher magnetic fields and longer TEs, the extravascular contribution increases and the intravascular contribution decreases; and therefore, the spatial specificity to parenchyma improves.
The magnitude of a BOLD fMRI response is weighted by baseline CBVv and stimulus-induced venous oxygenation level changes. This means that if one pixel has a higher value for baseline CBVv than another pixel, that pixel would show a higher BOLD response if all other factors were equal (including oxygenation level changes). Since vascular density and structure are unlikely to be similar across pixels in extremely high-resolution images, BOLD fMRI response magnitudes should therefore not compared across pixels.
Spatial resolution in BOLD fMRI is determined by the size of each venous vascular unit (∼1 mm diameter when signals from intracortical emerging veins contribute). Spatial resolution is also dependent on the area of activation, and can be improved by acquisition with SE sequences at high magnetic fields.
Steady-state CMRO2 changes are often determined from BOLD and CBF data by estimating the CBVt change from the CBF response with Grubb's formula and a volume-flow power term of 0.38. However, it is the CBVv response (not CBVt) that is relevant for BOLD fMRI, and at steady state, the CBVv responses are only about half of CBVt changes; therefore, functional CMRO2 changes reported in the literature are significantly underestimated when calculated from CBVt.
Functional CBF, CBVv, and CMRO2 responses contribute to the dynamics of BOLD fMRI responses. The CBVv response is sluggish, and negligible for short stimulus periods. This lack of significant CBVv contributions to short stimulus-induced BOLD responses simplifies the BOLD biophysical model.
Dynamic CMRO2 changes obtained from the BOLD biophysical model do not reflect dynamic cellular CMRO2 changes in mitochondria; and therefore, dynamic CMRO2 values obtained from BOLD data should not be interpreted as dynamic cellular responses. This pertains, for example, to interpretation of CMRO2-related contributions to the poststimulus BOLD undershoot.
The initial BOLD dip originates from an early increase in CMRO2, but the source of poststimulus BOLD undershoot is still controversial. Investigating the sources of these signals will definitely aid our understanding of neurovascular coupling, but both high spatial and temporal resolutions would be required to use these signals for fMRI, and thus sensitivity would likely be low.
Dynamic properties and magnitudes of BOLD functional responses are dependent on many physiological parameters as well as baseline conditions. In patients with neurovascular disorders, the BOLD response could be sluggish, or even decreased relative to baseline. This should not be interpreted simply as a decrease in neural activity, because neurovascular coupling may be hampered.
Resting-state fMRI studies are widely performed, but its physiological source needs to be systematically investigated.
Acknowledgments
The authors thank colleagues at the University of Pittsburgh, especially Alberto Vazquez for providing unpublished images and Kristy Hendrich for proofreading and providing critical comments on this manuscript.
The authors declare no conflict of interest.
Footnotes
This work has been funded partially by NIH grants to SGK (EB003324, EB003375, and NS44589), and by a World Class University program grant from Korea Science and Engineering Foundation (KOSEF) to SO, provided by the Korean government (MEST #00101190).
References
- An H, Lin W. Cerebral oxygen extraction fraction and cerebral venous blood volume measurements using MRI: effects of magnetic field variation. Magn Reson Med. 2002a;47:958–966. doi: 10.1002/mrm.10148. [DOI] [PubMed] [Google Scholar]
- An H, Lin W. Cerebral venous and arterial blood volumes can be estimated separately in humans using magnetic resonance imaging. Magn Reson Med. 2002b;48:583–588. doi: 10.1002/mrm.10257. [DOI] [PubMed] [Google Scholar]
- Attwell D, Buchan AM, Charpak S, Lauritzen M, Macvicar BA. Glial and neuronal control of brain blood flow. Nature. 2010;468:232–243. doi: 10.1038/nature09613. [DOI] [PMC free article] [PubMed] [Google Scholar]
- Bandettini PA, Wang EC, Hinks RS, Rikofsky RS. Time course EPI of human brain function during task activation. Magn Reson Med. 1992;25:390–397. doi: 10.1002/mrm.1910250220. [DOI] [PubMed] [Google Scholar]
- Biswal B, Yetkin FZ, Haughton VM, Hyde JS. Functional connectivity in the motor cortex of resting human brain using echo-planar MRI. Magn Reson Med. 1995;34:537–541. doi: 10.1002/mrm.1910340409. [DOI] [PubMed] [Google Scholar]
- Boorman L, Kennerley AJ, Johnston D, Jones M, Zheng Y, Redgrave PJ. Negative blood oxygen level dependence in the rat: a model for investigating the role of suppression in neurovascular coupling. J Neurosci. 2010;30:4285–4294. doi: 10.1523/JNEUROSCI.6063-09.2010. [DOI] [PMC free article] [PubMed] [Google Scholar]
- Boxerman JL, Bandettini PA, Kwong KK, Baker JR, Davis TL, Rosen BR. The intravascular contribution to fMRI signal change: Monte Carlo modeling and diffusion-weighted studies in vivo. Magn Reson Med. 1995;34:4–10. doi: 10.1002/mrm.1910340103. [DOI] [PubMed] [Google Scholar]
- Breger RK, Rimm AA, Fischer ME, Papke RA. T1 and T2 measurements on a 1.5 Tesla Commercial Imager. Radiology. 1989;171:273–276. doi: 10.1148/radiology.171.1.2928538. [DOI] [PubMed] [Google Scholar]
- Buckner RL, Bandettini PA, O'Craven KM, Savoy RL, Petersen SE, Raichle ME. Detection of cortical activation during averaged single trials of a cognitive task during functional magnetic resonance imaging. Proc Natl Acad Sci USA. 1996;93:14878–14883. doi: 10.1073/pnas.93.25.14878. [DOI] [PMC free article] [PubMed] [Google Scholar]
- Buxton RB. The elusive initial dip. Neuroimage. 2001;13:953–958. doi: 10.1006/nimg.2001.0814. [DOI] [PubMed] [Google Scholar]
- Buxton RB, Wong EC, Frank LR. Dynamics of blood flow and oxygenation changes during brain activation: the baloon model. Magn Reson Med. 1998;39:855–864. doi: 10.1002/mrm.1910390602. [DOI] [PubMed] [Google Scholar]
- Chaigneau E, Oheim M, Audinat ES, Charpak S. Two-photon imaging of capillary blood flow in olfactory bulb glomeruli. Proc Natl Acad Sci USA. 2003;100:13081–13086. doi: 10.1073/pnas.2133652100. [DOI] [PMC free article] [PubMed] [Google Scholar]
- Chen JJ, Pike GB. BOLD-specific cerebral blood volume and blood flow changes during neuronal activation in humans. NMR Biomed. 2009a;22:1054–1062. doi: 10.1002/nbm.1411. [DOI] [PubMed] [Google Scholar]
- Chen JJ, Pike GB. Origins of the BOLD post-stimulus undershoot. Neuroimage. 2009b;46:559–568. doi: 10.1016/j.neuroimage.2009.03.015. [DOI] [PubMed] [Google Scholar]
- Chen JJ, Pike GB. MRI measurement of the BOLD-specific flow-volume relationship during hypercapnia and hypocapnia in humans. Neuroimage. 2010;53:383–391. doi: 10.1016/j.neuroimage.2010.07.003. [DOI] [PubMed] [Google Scholar]
- Chiarelli PA, Bulte DP, Wise R, Gallichan DP. A calibration method for quantitative BOLD fMRI based on hyperoxia. Neuroimage. 2007;37:808–820. doi: 10.1016/j.neuroimage.2007.05.033. [DOI] [PubMed] [Google Scholar]
- Cohen ER, Ugurbil K, Kim S-G. Effect of basal conditions on the magnitude and dynamics of the blood oxygenation-level dependent fMRI response. J Cereb Blood Flow Metab. 2002;22:1042–1053. doi: 10.1097/00004647-200209000-00002. [DOI] [PubMed] [Google Scholar]
- Davis TL, Kwong KK, Weisskoff RM. Calibrated functional MRI: mapping the dynamics of oxidative metabolism. Proc Natl Acad Sci USA. 1998;95:1834–1839. doi: 10.1073/pnas.95.4.1834. [DOI] [PMC free article] [PubMed] [Google Scholar]
- Desposito M, Deouell LA, Gazzaley A. Alterations in the BOLD fMRI signal with ageing and disease: a challenge for neuroimaging. Nat Rev Neurosci. 2003;4:863–872. doi: 10.1038/nrn1246. [DOI] [PubMed] [Google Scholar]
- Detre JA, Leigh JS, Williams DS. Perfusion imaging. Magn Reson Med. 1992;23:37–45. doi: 10.1002/mrm.1910230106. [DOI] [PubMed] [Google Scholar]
- Dickson JD, Ash TW, Williams GB, Sukstanskii AL, Ansorge RE. Quantitative phenomenological model of the BOLD contrast mechanism. J Magn Reson. 2011;212:17–25. doi: 10.1016/j.jmr.2011.06.003. [DOI] [PMC free article] [PubMed] [Google Scholar]
- Donahue MJ, Hoogduin H, van Zijl PC, Jezzard P, Luijten PR. Blood oxygenation level-dependent (BOLD) total and extravascular signal changes and DeltaR2* in human visual cortex at 1.5, 3.0 and 7.0 T. NMR Biomed. 2011;24:25–34. doi: 10.1002/nbm.1552. [DOI] [PubMed] [Google Scholar]
- Drew PJ, Shih AY, Kleinfeld D. Fluctuating and sensory-induced vasodynamics in rodent cortex extend arteriole capacity. Proc Natl Acad Sci USA. 2011;108:8473–8478. doi: 10.1073/pnas.1100428108. [DOI] [PMC free article] [PubMed] [Google Scholar]
- Duong TQ, Kim D-S, Ugurbil K, Kim S-G. Localized cerebral blood flow response at submillimeter columnar resolution. Proc Natl Acad Sci USA. 2001;98:10904–10909. doi: 10.1073/pnas.191101098. [DOI] [PMC free article] [PubMed] [Google Scholar]
- Duong TQ, Yacoub E, Adriany G, Hu X, Ugurbil K, Kim SG. Microvascular BOLD contribution at 4 and 7T in the human brain: Gradient-echo and spin-echo fMRI with suppression of blood effects. Magn Reson Med. 2003;49:1019–1027. doi: 10.1002/mrm.10472. [DOI] [PubMed] [Google Scholar]
- Duvernoy HM, Delon S, Vannson JL. Cortical blood vessels of the human brain. Brain Res Bull. 1981;7:519–579. doi: 10.1016/0361-9230(81)90007-1. [DOI] [PubMed] [Google Scholar]
- Edelman RR, Siewert B, Darby DG, Thangaraj V, Nobre AC, Mesulam MM. Qualitative mapping of cerebral blood flow and functional localization with echo-planar MR imaging and signal targeting with alternating radio frequency. Radiology. 1994;192:513–520. doi: 10.1148/radiology.192.2.8029425. [DOI] [PubMed] [Google Scholar]
- Ekstrom A. How and when the fMRI BOLD signal relates to underlying neural activity: the danger in dissociation. Brain Res Rev. 2010;62:233–244. doi: 10.1016/j.brainresrev.2009.12.004. [DOI] [PMC free article] [PubMed] [Google Scholar]
- Ernst T, Hennig J. Observation of a fast response in functional MR. Magn Reson Med. 1994;32:146–149. doi: 10.1002/mrm.1910320122. [DOI] [PubMed] [Google Scholar]
- Fox MD, Raichle ME. Spontaneous fluctuations in brain activity observed with functional magnetic resonance imaging. Nat Rev Neurosci. 2007;8:700–711. doi: 10.1038/nrn2201. [DOI] [PubMed] [Google Scholar]
- Fox PT, Raichle ME. Focal physiological uncoupling of cerebral blood flow and oxidative metabolism during somatosensory stimulation in human subjects. Proc Natl Acad Sci USA. 1986;83:1140–1144. doi: 10.1073/pnas.83.4.1140. [DOI] [PMC free article] [PubMed] [Google Scholar]
- Fox PT, Raichle ME, Mintun MA, Dence C. Nonoxidative glucose consumption during focal physiologic neural activity. Science. 1988;241:462–464. doi: 10.1126/science.3260686. [DOI] [PubMed] [Google Scholar]
- Frahm J, Kruger KD, Merboldt KD, Kleinschmidt A. Dynamic uncoupling and recoupling of perfusion and oxidative metabolism during focal brain activation in man. Magn Reson Med. 1996;35:143–148. doi: 10.1002/mrm.1910350202. [DOI] [PubMed] [Google Scholar]
- Frohlich AF, Ostergaard L, Kiselev VG. Theory of susceptibility-induced transverse relaxation in the capillary network in the diffusion narrowing regime. Magn Reson Med. 2005;53:564–573. doi: 10.1002/mrm.20394. [DOI] [PubMed] [Google Scholar]
- Fukuda M, Wang P, Moon CH, Tanifuji M, Kim S-G. Spatial specificity of the enhanced dip inherently induced by prolonged oxygen consumption in cat visual cortex: implication for columnar resolution functional MRI. Neuroimage. 2006;30:70–87. doi: 10.1016/j.neuroimage.2005.09.026. [DOI] [PubMed] [Google Scholar]
- Gelman N, Gorell J, Barker P, Savage R, Spickler E, Windham J, Knight R. MR imaging of human brain at 3.0 T: preliminary report on transverse relaxation rates and relation to estimated iron content. Radiology. 1999;210:759–767. doi: 10.1148/radiology.210.3.r99fe41759. [DOI] [PubMed] [Google Scholar]
- Glover GH.2011Overview of functional magnetic resonance imaging Neurosurg Clin N Am 22133–139.vii [DOI] [PMC free article] [PubMed] [Google Scholar]
- Griffeth VE, Buxton RB. A theoretical framework for estimating cerebral oxygen metabolism changes using the calibrated-BOLD method: modeling the effects of blood volume distribution, hematocrit, oxygen extraction fraction, and tissue signal properties on the BOLD signal. Neuroimage. 2011;58:198–212. doi: 10.1016/j.neuroimage.2011.05.077. [DOI] [PMC free article] [PubMed] [Google Scholar]
- Grubb RL, Raichle ME, Eichling JO, Ter-Pogossian MM. The effects of changes in PaCO2 on cerebral blood volume, blood flow, and vascular mean transit time. Stroke. 1974;5:630–639. doi: 10.1161/01.str.5.5.630. [DOI] [PubMed] [Google Scholar]
- Harel N, Lee S-P, Nagaoka T, Kim D-S, Kim S-G. Origin of negative blood oxygenation level-dependent fMRI signals. J Cereb Blood Flow Metab. 2002;22:908–917. doi: 10.1097/00004647-200208000-00002. [DOI] [PubMed] [Google Scholar]
- Heeger DJ, Ress D. What does fMRI tell us about neuronal activity. Nat Rev Neurosci. 2002;3:142–151. doi: 10.1038/nrn730. [DOI] [PubMed] [Google Scholar]
- Herscovitch P, Raichle ME. What is the correct value for the brain-blood partition coefficient for water. J Cereb Blood Flow Metab. 1985;5:65–69. doi: 10.1038/jcbfm.1985.9. [DOI] [PubMed] [Google Scholar]
- Hillman EM, Devor A, Bouchard MB, Dunn AK, Krauss GW, Skoch J, Bacskai BJ, Dale AM, Boas DA. Depth-resolved optical imaging and microscopy of vascular compartment dynamics during somatosensory stimulation. Neuroimage. 2007;35:89–104. doi: 10.1016/j.neuroimage.2006.11.032. [DOI] [PMC free article] [PubMed] [Google Scholar]
- Hoge RD, Atkinson J, Gill B, Crelier GR, Marrett S, Pike GB. Stimulus-dependent BOLD and perfusion dynamics in human V1. Neuroimage. 1999a;1999:573–585. doi: 10.1006/nimg.1999.0443. [DOI] [PubMed] [Google Scholar]
- Hoge RD, Atkinson J, Gill B, Crelier GR, Marrett S, Pike GB. Linear coupling between cerebral blood flow and oxygen consumption in activated human cortex. Proc Natl Acad Sci USA. 1999b;96:9403–9408. doi: 10.1073/pnas.96.16.9403. [DOI] [PMC free article] [PubMed] [Google Scholar]
- Hu X, Le TH, Ugurbil K. Evaluation of the early response in fMRI in individual subjects using short stimulus duration. Magn Reson Med. 1997;37:877–884. doi: 10.1002/mrm.1910370612. [DOI] [PubMed] [Google Scholar]
- Hua J, Stevens RD, Huang AJ, Pekar JJ, van Zijl PC. Physiological origin for the BOLD poststimulus undershoot in human brain: vascular compliance versus oxygen metabolism. J Cereb Blood Flow Metab. 2011;31:1599–1611. doi: 10.1038/jcbfm.2011.35. [DOI] [PMC free article] [PubMed] [Google Scholar]
- Hyder F, Kida I, Behar KL, Kennan RP, Maciejewski PK, Rothman DL. Quantitative functional imaging of the brain: towards mapping neuronal activity by BOLD fMRI. NMR Biomed. 2001;14:413–431. doi: 10.1002/nbm.733. [DOI] [PubMed] [Google Scholar]
- Ito H, Ibaraki M, Kanno I, Fukuda H, Miura S. Changes in the arterial fraction of human cerebral blood volume during hypercapnia and hypocapnia measured by positron emission tomography. J Cereb Blood Flow Metab. 2005;25:852–857. doi: 10.1038/sj.jcbfm.9600076. [DOI] [PubMed] [Google Scholar]
- Ito H, Kanno I, Iida H, Hatazawa J, Shimosegawa E, Tamura H, Okudera T. Arterial fraction of cerebral blood volume in humans measured by positron emission tomography. Ann Nucl Med. 2001;15:111–116. doi: 10.1007/BF02988600. [DOI] [PubMed] [Google Scholar]
- Jin T, Kim SG. Cortical layer-dependent dynamic blood oxygenation, cerebral blood flow and cerebral blood volume responses during visual stimulation. Neuroimage. 2008;43:1–9. doi: 10.1016/j.neuroimage.2008.06.029. [DOI] [PMC free article] [PubMed] [Google Scholar]
- Jin T, Kim SG. Change of the cerebrospinal fluid volume during brain activation investigated by T (1rho)-weighted fMRI. Neuroimage. 2010;51:1378–1383. doi: 10.1016/j.neuroimage.2010.03.047. [DOI] [PMC free article] [PubMed] [Google Scholar]
- Jin T, Wang P, Tasker M, Zhao F, Kim S-G. Source of nonlinearity in echo-time-dependent BOLD fMRI. Magn Reson Med. 2006;55:1281–1290. doi: 10.1002/mrm.20918. [DOI] [PubMed] [Google Scholar]
- Jochimsen TH, Norris DG, Mildner T, Möller HE. Quantifying the intra- and extravascular contributions to spin-echo fMRI at 3 T. Magn Reson Med. 2004;52:724–732. doi: 10.1002/mrm.20221. [DOI] [PubMed] [Google Scholar]
- Jochimsen TH, Norris DG, Möller HE. Is there a change in water proton density associated with functional magnetic resonance imaging. Magn Reson Med. 2005;53:470–473. doi: 10.1002/mrm.20351. [DOI] [PubMed] [Google Scholar]
- Kastrup A, Kruger G, Glover GH, Moseley ME. Assessment of cerebral oxidative metabolism with breath holding and fMRI. Magn Reson Med. 1999;42:608–611. doi: 10.1002/(sici)1522-2594(199909)42:3<608::aid-mrm26>3.0.co;2-i. [DOI] [PubMed] [Google Scholar]
- Kemna LJ, Posse S. Effect of respiratory CO (2) changes on the temporal dynamics of the hemodynamic response in functional MR imaging. Neuroimage. 2001;14:642–649. doi: 10.1006/nimg.2001.0859. [DOI] [PubMed] [Google Scholar]
- Kennan RP, Scanley BE, Innis RB, Gore JC. Physiological basis for BOLD MR signal changes due to neuronal stimulation: Separation of blood volume and magnetic susceptibility effects. Magn Reson Med. 1998;40:840–846. doi: 10.1002/mrm.1910400609. [DOI] [PubMed] [Google Scholar]
- Kennan RP, Zhong J, Gore JC. Intravascular susceptibility contrast mechanisms in tissues. Magn Reson Med. 1994;31:9–21. doi: 10.1002/mrm.1910310103. [DOI] [PubMed] [Google Scholar]
- Kim D-S, Duong TQ, Kim S-G. High-resolution mapping of iso-orientation columns by fMRI. Nat Neurosci. 2000;3:164–169. doi: 10.1038/72109. [DOI] [PubMed] [Google Scholar]
- Kim S-G. Quantification of relative cerebral blood flow change by flow-sensitive alternating inversion recovery (FAIR) technique: application to functional mapping. Magn Reson Med. 1995;34:293–301. doi: 10.1002/mrm.1910340303. [DOI] [PubMed] [Google Scholar]
- Kim S-G, Fukuda M. Lessons from fMRI about mapping cortical columns. Neuroscientist. 2008;14:287–299. doi: 10.1177/1073858407309541. [DOI] [PMC free article] [PubMed] [Google Scholar]
- Kim S-G, Hendrich K, Hu X, Merkle H, Ugurbil K. Potential pitfalls of functional MRI using conventional gradient-recalled echo techniques. NMR Biomed. 1994;7:69–74. doi: 10.1002/nbm.1940070111. [DOI] [PubMed] [Google Scholar]
- Kim S-G, Rostrup E, Larsson HBW, Ogawa S, Paulson OB. Determination of relative CMRO2 from CBF and BOLD changes: significant increase of oxygen consumption rate during visual stimulation. Magn Reson Med. 1999;41:1152–1161. doi: 10.1002/(sici)1522-2594(199906)41:6<1152::aid-mrm11>3.0.co;2-t. [DOI] [PubMed] [Google Scholar]
- Kim S-G, Ugurbil K. Comparison of blood oxygenation and cerebral blood flow effects in fMRI: estimation of relative oxygen consumption change. Magn Reson Med. 1997a;38:59–65. doi: 10.1002/mrm.1910380110. [DOI] [PubMed] [Google Scholar]
- Kim S-G, Ugurbil K. Functional magnetic resonance imaging of the human brain. J Neurosci Methods. 1997b;74:229–243. doi: 10.1016/s0165-0270(97)02252-8. [DOI] [PubMed] [Google Scholar]
- Kim S-G, Ugurbil K. High-resolution functional magnetic resonance imaging of the animal brain. Methods. 2003;30:28–41. doi: 10.1016/s1046-2023(03)00005-7. [DOI] [PubMed] [Google Scholar]
- Kim T, Hendrich K, Kim S. Functional MRI with magnetization transfer effects: determination of BOLD and arterial blood volume changes. Magn Reson Med. 2008;60:1518–1523. doi: 10.1002/mrm.21766. [DOI] [PMC free article] [PubMed] [Google Scholar]
- Kim T, Kim S. Temporal dynamics and spatial specificity of arterial and venous blood volume changes during visual stimulation: implication for BOLD quantification. J Cereb Blood Flow Metab. 2011;31:1211–1222. doi: 10.1038/jcbfm.2010.226. [DOI] [PMC free article] [PubMed] [Google Scholar]
- Kim T, Masamoto K, Hendrich K, Kim S-G. Arterial versus total blood volume changes during neural activity-induced cerebral blood flow change: implication for BOLD fMRI. J Cereb Blood Flow Metab. 2007;27:1235–1247. doi: 10.1038/sj.jcbfm.9600429. [DOI] [PubMed] [Google Scholar]
- Kwong KK, Belliveau JW, Chesler DA, Goldberg IE, Weisskoff RM, Poncelet BP, Kennedy DN, Hoppel BE, Cohen MS, Turner R, et al. Dynamic magnetic resonance imaging of human brain activity during primary sensory stimulation. Proc Natl Acad Sci USA. 1992;89:5675–5679. doi: 10.1073/pnas.89.12.5675. [DOI] [PMC free article] [PubMed] [Google Scholar]
- Lee AT, Glover GH, Meyer CH. Discrimination of large venous vessels in time-course spiral blood-oxygen-level-dependent magnetic resonance functional neuroimaging. Magn Reson Med. 1995;33:745–754. doi: 10.1002/mrm.1910330602. [DOI] [PubMed] [Google Scholar]
- Lee S-P, Duong T, Yang G, Iadecola C, Kim S-G. Relative changes of cerebral arterial and venous blood volumes during increased cerebral blood flow: Implications for BOLD fMRI. Magn Reson Med. 2001;45:791–800. doi: 10.1002/mrm.1107. [DOI] [PubMed] [Google Scholar]
- Lee S-P, Silva AC, Kim S-G. Comparison of diffusion-weighted high-resolution CBF and spin-echo BOLD fMRI at 9.4 T. Magn Reson Med. 2002;47:736–741. doi: 10.1002/mrm.10117. [DOI] [PubMed] [Google Scholar]
- Lee S-P, Silva AC, Ugurbil K, Kim S-G. Diffusion-weighted spin-echo fMRI at 9.4 T: microvascular/tissue contribution to BOLD signal change. Magn Reson Med. 1999;42:919–928. doi: 10.1002/(sici)1522-2594(199911)42:5<919::aid-mrm12>3.0.co;2-8. [DOI] [PubMed] [Google Scholar]
- Leopold DA, Murayama Y, Logothetis NK. Very slow activity fluctuations in monkey visual cortex: implications for functional brain imaging. Cereb Cortex. 2003;13:422–433. doi: 10.1093/cercor/13.4.422. [DOI] [PubMed] [Google Scholar]
- Levin JM, Ross MH, Mendelson JH, Kaufman MJ, Lange N, Maas LC, Mello NK, Cohen BM, Renshaw PF. Reduction in BOLD fMRI response to primary visual stimulation following alcohol ingestion. Psychiatry Res. 1998;82:135–146. doi: 10.1016/s0925-4927(98)00022-5. [DOI] [PubMed] [Google Scholar]
- Logothetis NK. What we can do and what we cannot do with fMRI. Nature. 2008;453:869–878. doi: 10.1038/nature06976. [DOI] [PubMed] [Google Scholar]
- Logothetis NK, Pauls J, Augath M, Trinath T, Oeltermann A. Neurophysiological investigation of the basis of the fMRI signal. Nature. 2001;412:150–157. doi: 10.1038/35084005. [DOI] [PubMed] [Google Scholar]
- Lowel S, Freeman B, Singer W. Topographic organization of the orientation column system in large flat-mounts of the cat visual cortex: a 2-deoxyglucose study. J Comp Neurol. 1987;255:401–415. doi: 10.1002/cne.902550307. [DOI] [PubMed] [Google Scholar]
- Lu H, Golay X, Pekar J, Van Zijl P. Functional magnetic resonance imaging based on changes in vascular space occupancy. Magn Reson Med. 2003;50:263–274. doi: 10.1002/mrm.10519. [DOI] [PubMed] [Google Scholar]
- Lu H, Zhao C, Ge Y, Lewis-Amezcua K. Baseline blood oxygenation modulates response amplitude: physiologic basis for intersubject variations in functional MRI signals. Magn Reson Med. 2008;60:364–372. doi: 10.1002/mrm.21686. [DOI] [PMC free article] [PubMed] [Google Scholar]
- Malonek D, Grinvald A. Interactions between electrical activity and cortical microcirculation revealed by imaging spectroscopy: implication for functional brain mapping. Science. 1996;272:551–554. doi: 10.1126/science.272.5261.551. [DOI] [PubMed] [Google Scholar]
- Mandeville J, Marota J, Ayata C, Zaharchuk G, Moskowitz M, Rosen B, Weisskoff R. Evidence of a cerebrovascular postarteriole windkessel with delayed compliance. J Cereb Blood Flow Metab. 1999;19:679–689. doi: 10.1097/00004647-199906000-00012. [DOI] [PubMed] [Google Scholar]
- Mandeville JB, Marota JJ, Kosofsky BE, Keltner JR, Weissleder R, Rosen BR, Weisskoff RM. Dynamic functional imaging of relative cerebral blood volume during rat forepaw stimulation. Magn Reson Med. 1998;39:615–624. doi: 10.1002/mrm.1910390415. [DOI] [PubMed] [Google Scholar]
- Masamoto K, Vazquez A, Wang P, Kim S. Trial-by-trial relationship between neural activity, oxygen consumption, and blood flow responses. Neuroimage. 2008;40:442–450. doi: 10.1016/j.neuroimage.2007.12.011. [DOI] [PMC free article] [PubMed] [Google Scholar]
- Menon RS. Postacquisition suppression of large-vessel BOLD signals in high-resolution fMRI. Magn Reson Med. 2002;47:1–9. doi: 10.1002/mrm.10041. [DOI] [PubMed] [Google Scholar]
- Menon RS, Luknowsky DC, Gati JS. Mental chronometry using latency-resolved functional MRI. Proc Natl Acad Sci USA. 1998;95:10902–10907. doi: 10.1073/pnas.95.18.10902. [DOI] [PMC free article] [PubMed] [Google Scholar]
- Menon RS, Ogawa S, Hu X, Strupp JP, Anderson P, Ugurbil K. BOLD based functional MRI at 4 Tesla includes a capillary bed contribution: echo planar imaging correlates with previous optical imaging using intrinsic signals. Magn Reson Med. 1995;33:453–459. doi: 10.1002/mrm.1910330323. [DOI] [PubMed] [Google Scholar]
- Mitra PP, Ogawa S, Hu X, Ugurbil K. The nature of spatiotemporal changes in cerebral hemodynamics as manifested in functional magnetic resonance imaging. Magn Reson Med. 1997;37:511–518. doi: 10.1002/mrm.1910370407. [DOI] [PubMed] [Google Scholar]
- Mukamel R, Gelbard H, Arieli A, Hasson U, Fried I, Malach R. Coupling between neuronal firing, field potentials, and FMRI in human auditory cortex. Science. 2005;309:951–954. doi: 10.1126/science.1110913. [DOI] [PubMed] [Google Scholar]
- Mulderink TA, Gitelman DR, Mesulam MM, Parrish TB. On the use of caffeine as a contrast booster for BOLD fMRI studies. Neuroimage. 2002;15:37–44. doi: 10.1006/nimg.2001.0973. [DOI] [PubMed] [Google Scholar]
- Muthukumaraswamy SD, Edden RA, Jones DK, Swettenham JB, Singh KD. Resting GABA concentration predicts peak gamma frequency and fMRI amplitude in response to visual stimulation in humans. Proc Natl Acad Sci USA. 2009;106:8356–8361. doi: 10.1073/pnas.0900728106. [DOI] [PMC free article] [PubMed] [Google Scholar]
- Nagaoka T, Zhao F, Wang P, Harel N, Kennan RP, Ogawa S, Kim S-G. Increases in oxygen consumption without cerebral blood volume change during visual stimulation under hypotension condition. J Cereb Blood Flow Metab. 2006;26:1043–1051. doi: 10.1038/sj.jcbfm.9600251. [DOI] [PubMed] [Google Scholar]
- Ogawa S, Lee TM. Magnetic resonance imaging of blood vessels at high fields: in vivo and in vitro measurements and image simulation. Magn Reson Med. 1990;16:9–18. doi: 10.1002/mrm.1910160103. [DOI] [PubMed] [Google Scholar]
- Ogawa S, Lee TM, Barrere B. Sensitivity of magnetic resonance image signals of a rat brain to changes in the cerebral venous blood oxygenation. Magn Reson Med. 1993a;29:205–210. doi: 10.1002/mrm.1910290208. [DOI] [PubMed] [Google Scholar]
- Ogawa S, Lee T-M, Kay AR, Tank DW. Brain magnetic resonance imaging with contrast dependent on blood oxygenation. Proc Natl Acad Sci USA. 1990a;87:9868–9872. doi: 10.1073/pnas.87.24.9868. [DOI] [PMC free article] [PubMed] [Google Scholar]
- Ogawa S, Lee T-M, Nayak AS, Glynn P. Oxygenation-sensitive contrast in magnetic resonance image of rodent brain at high magnetic fields. Magn Reson Med. 1990b;14:68–78. doi: 10.1002/mrm.1910140108. [DOI] [PubMed] [Google Scholar]
- Ogawa S, Lee T-M, Stepnoski R, Chen W, Zhu X-H, Ugurbil K. An approach to probe some neural systems interaction by functional MRI at neural time scale down to milliseconds. Proc Natl Acad Sci USA. 2000;97:11026–11031. doi: 10.1073/pnas.97.20.11026. [DOI] [PMC free article] [PubMed] [Google Scholar]
- Ogawa S, Menon RS, Kim S-G, Ugurbil K. On the characteristics of functional magnetic resonance imaging of the brain. Annu Rev Biophys Biomol Struct. 1998;27:447–474. doi: 10.1146/annurev.biophys.27.1.447. [DOI] [PubMed] [Google Scholar]
- Ogawa S, Menon RS, Tank DW, Kim SG, Merkle H, Ellermann JM, Ugurbil K. Functional brain mapping by blood oxygenation level-dependent contrast magnetic resonance imaging. A comparison of signal characteristics with a biophysical model. Biophys J. 1993b;64:803–812. doi: 10.1016/S0006-3495(93)81441-3. [DOI] [PMC free article] [PubMed] [Google Scholar]
- Ogawa S, Tank DW, Menon R, Ellermann JM, Kim SG, Merkle H, Ugurbil K. Intrinsic signal changes accompanying sensory stimulation: functional brain mapping with magnetic resonance imaging. Proc Natl Acad Sci USA. 1992;89:5951–5955. doi: 10.1073/pnas.89.13.5951. [DOI] [PMC free article] [PubMed] [Google Scholar]
- Park SH, Masamoto K, Hendrich K, Kanno I, Kim SG. Imaging brain vasculature with BOLD microscopy: MR detection limits determined by in vivo two-photon microscopy. Magn Reson Med. 2008;59:855–865. doi: 10.1002/mrm.21573. [DOI] [PMC free article] [PubMed] [Google Scholar]
- Pauling L, Coryell CD. The magnetic properties and structure of hemoglobin, oxyhemoglobin and carbonmonoxyhemoglobin. Proc Natl Acad Sci USA. 1936;22:210–216. doi: 10.1073/pnas.22.4.210. [DOI] [PMC free article] [PubMed] [Google Scholar]
- Pawlik G, Rackl A, Bing RJ. Quantitative capillary topography and blood flow in the cerebral cortex of cats: an in vivo microscopic study. Brain Res. 1981;208:35–58. doi: 10.1016/0006-8993(81)90619-3. [DOI] [PubMed] [Google Scholar]
- Pellerin L, Bouzier-Sore A-K, Aubert A, Serres S, Merle M, Costalat R, Magistretti PJ. Activity-dependent regulation of energy metabolism by astrocytes: an update. Glia. 2007;55:1251–1262. doi: 10.1002/glia.20528. [DOI] [PubMed] [Google Scholar]
- Petzold GC, Murthy VN. Role of astrocytes in neurovascular coupling. Neuron. 2011;71:782–797. doi: 10.1016/j.neuron.2011.08.009. [DOI] [PubMed] [Google Scholar]
- Raichle ME.1987Circulatory and metabolic correlates of brain function in normal humans Handbook of physiology-the nervous system Bethesda: American Physiological Society; Vol V, pp643–674. [Google Scholar]
- Raichle ME, MacLeod AM, Snyder AZ, Powers WJ, Gusnard DA, Shulman GL. A default mode of brain function. Proc Natl Acad Sci USA. 2001;98:676–682. doi: 10.1073/pnas.98.2.676. [DOI] [PMC free article] [PubMed] [Google Scholar]
- Reina-De La Torre F, Rodriguez-Baeza A, Sahuquillo-Barris J. Morphological Characteristics and Distribution Pattern of the Arterial Vessels in Human Cerebral Cortex: A Scanning Electron Microscope Study. Anat Rec. 1998;251:87–96. doi: 10.1002/(SICI)1097-0185(199805)251:1<87::AID-AR14>3.0.CO;2-7. [DOI] [PubMed] [Google Scholar]
- Richter W, Andersen PM, Georgopoulos AP, Kim S-G. Sequential activity in human motor areas during a delayed cued movement task studied by time-resolved fMRI. NeuroReport. 1997;8:1257–1261. doi: 10.1097/00001756-199703240-00040. [DOI] [PubMed] [Google Scholar]
- Schridde U, Khubchandani M, Motelow JE, Sanganahalli BG, Hyder F, Blumenfeld H. Negative BOLD with large increases in neuronal activity. Cereb Cortex. 2008;18:1814–1827. doi: 10.1093/cercor/bhm208. [DOI] [PMC free article] [PubMed] [Google Scholar]
- Segebarth C, Belle V, Delon C, Massarelli R, Decety J, Le Bas J-F, Decorpts M, Benabid AL. Functional MRI of the human brain: predominance of signals from extracerebral veins. NeuroReport. 1994;5:813–816. doi: 10.1097/00001756-199403000-00019. [DOI] [PubMed] [Google Scholar]
- Shih YY, Chen CC, Shyu BC, Lin ZJ, Chiang YC, Jaw FS, Chen YY, Chang C. A new scenario for negative functional magnetic resonance imaging signals: endogenous neurotransmission. J Neurosci. 2009;29:3036–3044. doi: 10.1523/JNEUROSCI.3447-08.2009. [DOI] [PMC free article] [PubMed] [Google Scholar]
- Shmuel A, Augath M, Oeltermann A, Logothetis N. Negative functional MRI response correlates with decreases in neuronal activity in monkey visual area V1. Nat Neurosci. 2006;9:569–577. doi: 10.1038/nn1675. [DOI] [PubMed] [Google Scholar]
- Shmuel A, Yacoub E, Pfeuffer J, Van de Moortele PF, Adriany G, Hu X, Ugurbil K. Sustained negative BOLD, blood flow and oxygen consumption response and its coupling to the positive response in the human brain. Neuron. 2002;36:1195–1210. doi: 10.1016/s0896-6273(02)01061-9. [DOI] [PubMed] [Google Scholar]
- Siero JC, Petridou N, Hoogduin H, Luijten PR, Ramsey NF. Cortical depth-dependent temporal dynamics of the BOLD response in the human brain. J Cereb Blood Flow Metab. 2011;31:1999–2008. doi: 10.1038/jcbfm.2011.57. [DOI] [PMC free article] [PubMed] [Google Scholar]
- Silva A, Kim S-G. Pseudo-continuous arterial spin labeling technique for measuring CBF dynamics with high temporal resolution. Magn Reson Med. 1999;42:425–429. doi: 10.1002/(sici)1522-2594(199909)42:3<425::aid-mrm3>3.0.co;2-s. [DOI] [PubMed] [Google Scholar]
- Silva AC, Lee S-P, Iadecola C, Kim S-G. Early temporal characteristics of CBF and deoxyhemoglobin changes during somatosensory stimulation. J Cereb Blood Flow Metab. 2000;20:201–206. doi: 10.1097/00004647-200001000-00025. [DOI] [PubMed] [Google Scholar]
- Sirotin YB, Hillman EM, Bordier C, Das A. Spatiotemporal precision and hemodynamic mechanism of optical point spreads in alert primates. Proc Natl Acad Sci USA. 2009;106:18390–18395. doi: 10.1073/pnas.0905509106. [DOI] [PMC free article] [PubMed] [Google Scholar]
- Song AW, Wong EC, Tan SG, Hyde JS. Diffusion weighted fMRI at 1.5 T. Magn Reson Med. 1996;35:155–158. doi: 10.1002/mrm.1910350204. [DOI] [PubMed] [Google Scholar]
- Stefanovic B, Pike GB. Venous refocusing for volume estimation: VERVE functional magnetic resonance imaging. Magn Reson Med. 2005;53:339–347. doi: 10.1002/mrm.20352. [DOI] [PubMed] [Google Scholar]
- Stroman PW, Kornelsen J, Lawrence J, Malisza KL. Functional magnetic resonance imaging based on SEEP contrast: response function and anatomical specificity. Magn Reson Imaging. 2005;23:843–850. doi: 10.1016/j.mri.2005.07.009. [DOI] [PubMed] [Google Scholar]
- Stroman PW, Tomanek B, Krause V, Frankenstein UN, Malisza KL. Functional magnetic resonance imaging of the human brain based on signal enhancement by extravascular protons (SEEP fMRI) Magn Reson Med. 2003;49:433–439. doi: 10.1002/mrm.10831. [DOI] [PubMed] [Google Scholar]
- Thulborn KR, Waterton JC, Mattews PM, Radda GK. Oxygenation dependence of the transverse relaxation time of water protons in whole blood at high field. Biochem Biophys Acta. 1982;714:265–270. doi: 10.1016/0304-4165(82)90333-6. [DOI] [PubMed] [Google Scholar]
- Tian P, Teng IC, May LD, Kurz R, Lu K, Scadeng M, Hillman EM, De Crespigny AJ, D'Arceuil HE, Mandeville JB, Marota JJ, Rosen BR, Liu TT, Boas DA, Buxton RB, Dale AM, Devor A. Cortical depth-specific microvascular dilation underlies laminar differences in blood oxygenation level-dependent functional MRI signal. Proc Natl Acad Sci USA. 2010;107:15246–15251. doi: 10.1073/pnas.1006735107. [DOI] [PMC free article] [PubMed] [Google Scholar]
- Turner R. How much cortex can a vein drain? Downstream dilution of activation-related cerebral blood oxygenation changes. Neuroimage. 2002;16:1062–1067. doi: 10.1006/nimg.2002.1082. [DOI] [PubMed] [Google Scholar]
- Uludag K, Muller-Bierl B, Ugurbil K. An integrative model for neuronal activity-induced signal changes for gradient and spin echo functional imaging. Neuroimage. 2009;48:150–165. doi: 10.1016/j.neuroimage.2009.05.051. [DOI] [PubMed] [Google Scholar]
- van Bruggen N, Busch E, Palmer JT, Williams S-P, de Crespigny AJ. High-resolution functional magnetic resonance imaging of the rat brain: mapping changes in cerebral blood volume using iron oxide contrast media. J Cereb Blood Flow Metab. 1998;18:1178–1183. doi: 10.1097/00004647-199811000-00003. [DOI] [PubMed] [Google Scholar]
- van Eijsden P, Hyder F, Rothman DL, Shulman RG. Neurophysiology of functional imaging. Neuroimage. 2009;45:1047–1054. doi: 10.1016/j.neuroimage.2008.08.026. [DOI] [PMC free article] [PubMed] [Google Scholar]
- Vazquez AL, Fukuda M, Kim SG.2012Evolution of the dynamic changes in functional cerebral oxidative metabolism from tissue mitochondria to blood oxygen J Cereb Blood Flow Metabe-pub ahead of print 1 February 2012; doi: 10.1038/jcbfm.2011.198 [DOI] [PMC free article] [PubMed]
- Vazquez AL, Fukuda M, Tasker ML, Masamoto K, Kim SG. Changes in cerebral arterial, tissue and venous oxygenation with evoked neural stimulation: implications for hemoglobin-based functional neuroimaging. J Cereb Blood Flow Metab. 2010;30:428–439. doi: 10.1038/jcbfm.2009.213. [DOI] [PMC free article] [PubMed] [Google Scholar]
- Vincent JL, Patel GH, Fox MD, Snyder AZ, Baker JT, Van Essen DC, Zempel JM, Snyder LH, Corbetta M, Raichle ME. Intrinsic functional architecture in the anaesthetized monkey brain. Nature. 2007;447:83–86. doi: 10.1038/nature05758. [DOI] [PubMed] [Google Scholar]
- Viswanathan A, Freeman RD. Neurometabolic coupling in cerebral cortex reflects synaptic more than spiking activity. Nat Neurosci. 2007;10:1308–1312. doi: 10.1038/nn1977. [DOI] [PubMed] [Google Scholar]
- Wade AR, Rowland J. Early suppressive mechanisms and the negative blood oxygenation level-dependent response in human visual cortex. J Neurosci. 2010;30:5008–5019. doi: 10.1523/JNEUROSCI.6260-09.2010. [DOI] [PMC free article] [PubMed] [Google Scholar]
- Weisskoff RM, Zuo CS, Boxerman JL, Rosen BR. Microscopic susceptibility variation and transverse relaxation: theory and experiment. Magn Reson Med. 1994;31:601–610. doi: 10.1002/mrm.1910310605. [DOI] [PubMed] [Google Scholar]
- Woolsey TA, Rovainen CM, Cox SB, Henegar MH, Liang GE, Liu D, Moskalenko YE, Sui J, Wei L. Neuronal units linked to microvascular modules in cerebral cortex: response elements for imaging the brain. Cereb Cortex. 1996;6:647–660. doi: 10.1093/cercor/6.5.647. [DOI] [PubMed] [Google Scholar]
- Wright GA, Hu BS, Macovski A. Estimating oxygen saturation of blood in vivo with MR imaging at 1.5 T. J Magn Reson Imag. 1991;1:275–283. doi: 10.1002/jmri.1880010303. [DOI] [PubMed] [Google Scholar]
- Yablonskiy D, Haacke E. Theory of NMR signal behavior in magnetically inhomogenous tissues: the static dephasing regime. Magn Reson Med. 1994;32:749–763. doi: 10.1002/mrm.1910320610. [DOI] [PubMed] [Google Scholar]
- Yacoub E, Duong TQ, Van De Moortele P, Lindquist M, Adriany G, Kim S-G, Ugurbil K, Hu X. Spin-echo fMRI in humans using high spatial resolutions and high magnetic fields. Magn Reson Med. 2003;49:665–664. doi: 10.1002/mrm.10433. [DOI] [PubMed] [Google Scholar]
- Yacoub E, Shmuel A, Pfeuffer J, Van De Moortele P, Adriany G, Andersen P, Vaughan J, Merkle H, Ugurbil K, Hu X. Imaging brain function in humans at 7 Tesla. Magn Reson Med. 2001;45:588–594. doi: 10.1002/mrm.1080. [DOI] [PubMed] [Google Scholar]
- Yacoub E, Ugurbil K, Harel N. The spatial dependence of the poststimulus undershoot as revealed by high-resolution BOLD- and CBV-weighted fMRI. J Cerb Blood Flow Metab. 2006;26:634–644. doi: 10.1038/sj.jcbfm.9600239. [DOI] [PubMed] [Google Scholar]
- Yamada H, Sadato N, Konishi Y, Muramoto S, Kimura K, Tanaka M, Yonekura Y, Ishii Y, Itoh H. A milestone for normal development of the infantile brain detected by functional MRI. Neurology. 2000;55:218–223. doi: 10.1212/wnl.55.2.218. [DOI] [PubMed] [Google Scholar]
- Yang X, Hyder F, Shulman RG. Activation of single whisker barrel in rat brain localized by functional magnetic resonance imaging. Proc Natl Acad Sci USA. 1996;93:475–478. doi: 10.1073/pnas.93.1.475. [DOI] [PMC free article] [PubMed] [Google Scholar]
- Yen CC, Fukuda M, Kim SG. BOLD responses to different temporal frequency stimuli in the lateral geniculate nucleus and visual cortex: insights into the neural basis of fMRI. Neuroimage. 2011;58:82–90. doi: 10.1016/j.neuroimage.2011.06.022. [DOI] [PMC free article] [PubMed] [Google Scholar]
- Zhao F, Wang P, Hendrich K, Kim S-G. Spatial specificity of cerebral blood volume-weighted fMRI responses at columnar resolution. Neuroimage. 2005;27:416–424. doi: 10.1016/j.neuroimage.2005.04.011. [DOI] [PubMed] [Google Scholar]
- Zhao F, Wang P, Hendrich K, Ugurbil K, Kim S-G. Cortical layer-dependent BOLD and CBV responses measured by spin-echo and gradient-echo fMRI: insights into hemodynamic regulation. Neuroimage. 2006;30:1149–1160. doi: 10.1016/j.neuroimage.2005.11.013. [DOI] [PubMed] [Google Scholar]
- Zhao F, Wang P, Kim SG. Cortical depth-dependent gradient-echo and spin-echo BOLD fMRI at 9.4T. Magn Reson Med. 2004;51:518–524. doi: 10.1002/mrm.10720. [DOI] [PubMed] [Google Scholar]
- Zhao J, Clingman C, Närväinen M, Kauppinen R, van Zijl P. Oxygenation and hemotocrit dependence of transverse relaxation rates of blood at 3T. Magn Reson Med. 2007;58:592–597. doi: 10.1002/mrm.21342. [DOI] [PubMed] [Google Scholar]
- Zhong J, Kennan RP, Fulbright RK, Gore JC. Quantification of intravascular and extravascular contributions to BOLD effects induced by alteration in oxygenation or intravascular contrast agents. Magn Reson Med. 1998;40:526–536. doi: 10.1002/mrm.1910400405. [DOI] [PubMed] [Google Scholar]