

Abstract
Lyme disease is the most prevalent vector-borne disease in North America, and both the annual incidence and geographic range are increasing. The emergence of Lyme disease has been attributed to a century-long recovery of deer, an important reproductive host for adult ticks. However, a growing body of evidence suggests that Lyme disease risk may now be more dynamically linked to fluctuations in the abundance of small-mammal hosts that are thought to infect the majority of ticks. The continuing and rapid increase in Lyme disease over the past two decades, long after the recolonization of deer, suggests that other factors, including changes in the ecology of small-mammal hosts may be responsible for the continuing emergence of Lyme disease. We present a theoretical model that illustrates how reductions in small-mammal predators can sharply increase Lyme disease risk. We then show that increases in Lyme disease in the northeastern and midwestern United States over the past three decades are frequently uncorrelated with deer abundance and instead coincide with a range-wide decline of a key small-mammal predator, the red fox, likely due to expansion of coyote populations. Further, across four states we find poor spatial correlation between deer abundance and Lyme disease incidence, but coyote abundance and fox rarity effectively predict the spatial distribution of Lyme disease in New York. These results suggest that changes in predator communities may have cascading impacts that facilitate the emergence of zoonotic diseases, the vast majority of which rely on hosts that occupy low trophic levels.
Keywords: coyote range expansion, Ixodes, mesopredator release, trophic cascade, zoonosis
There is growing recognition that changes in host community ecology and trophic interactions can contribute to the emergence of infectious diseases (1–3). In particular, the transmission of vector-borne zoonotic diseases to humans depends on multiple species interactions that influence host and vector abundance and infection prevalence. Most zoonotic pathogens are harbored by wildlife that occupy low trophic levels (1). The extirpation of top predators and the consequent restructuring of predator communities (4, 5) may thus increase the risk of zoonotic diseases if predation of reservoir hosts plays a key role in disease suppression. A paradigmatic case of disease emergence that is thought to be driven by changes in the host community is Lyme disease (Fig. 1).
Fig. 1.

(A) A simplified web of interactions involved in the ecology of Lyme disease. Solid lines indicate negative interactions, such as predation or parasitism. Dotted lines indicate resulting state transitions of ticks. Susceptible larva, St, infected nymphs, It, uninfected nymphs, Jt, and small-mammal hosts, Nm, broken into susceptible, Sm, and infected, Im, classes are dynamically modeled. The density of dilution hosts, F, and predators, P, are incorporated into the model with parameters. Reproductive hosts are included with a parameter for the birth rate of ticks, ν. Our model uses ecologically realistic assumptions, such as logistic population growth, a type II functional response for ticks, and a type III functional response for generalist predators. (B) The model reveals a sharp nonlinear increase in the density of infected nymphs (DIN) and (C) nymphal infection prevalence (NIP) as the maximum predation rate (predator density × their consumption rate as prey increase to infinity) declines. The dotted, solid, and dashed lines corresponds to ν = 1.5, 1, and 0.5 million larva born per km2 per year, respectively.
Lyme disease is the most prevalent vector-borne disease in North America, and both the annual incidence and geographic range are still increasing (6). The disease is caused by the bacteria Borrelia burgdorferi, which is transmitted to humans in the eastern United States primarily by the nymphal stage of Ixodes scapularis ticks (7). The emergence of Lyme disease has been attributed to the century-long population recovery of deer, which are not competent hosts for transmitting B. burgdorferi to ticks but are nonetheless important reproductive hosts for adult ticks (7, 8). Support for this hypothesis comes partly from studies of experimental removal or exclusion of deer, which has often led to reduced tick densities (9). However, substantial research indicates that experimental or natural increases of deer density above a low threshold often have little effect on nymphal tick abundance (reviewed in ref. 10; see also refs. 11–13; Table S1). This research suggests that when deer are sufficiently abundant, other factors, such as hosts for immature ticks, may become limiting. Decades after the recolonization of deer, and despite a shift in management objectives from increasing deer populations to stabilizing or reducing them (14), Lyme disease cases have increased enormously (380% increase in Minnesota, 280% in Wisconsin, and 1,300% in Virginia from 1997 to 2007; Fig. S1), which suggests that other previously unidentified ecological changes may now be facilitating the emergence of Lyme disease.
A growing body of evidence implicates small-mammal abundance as a key determinant of the density of infected nymphs, the primary measure of entomological risk for Lyme disease (12, 15, 16). Molecular evidence suggests that four species of small mammals (the white-footed mouse Peromyscus leucopus, Eastern chipmunk Tamias striatus, short-tailed shrew Sorex brevicauda, and masked shrew Sorex cinereus) are responsible for infecting 80–90% of ticks (17). Thus, it is possible that changes in the ecology of small mammals play a role in the continuing increase of Lyme disease. Small-mammal populations are influenced both by resource availability, which has been correlated with the subsequent density of infected nymphs (12, 15) and by predation (18). The latter finding has led to the suggestion that predation may play a key role in suppressing Lyme disease (1).
A major change in predator–prey interactions in North America over the last half-century has resulted from the range expansion and population growth of a new top predator—the coyote, Canis latrans, which has spread across the continent following the extirpation of gray wolves, Canis lupus (19). The expansion of coyotes likely suppressed the abundance of several small-mammal predators, with the reduction of foxes by interference competition with coyotes being the best documented (20–22). The replacement of foxes by coyotes would likely reduce predation rates on small-mammal prey (i.e., the reverse of mesopredator release) because red fox (Vulpes vulpes) densities are typically an order of magnitude higher than coyote densities (23–25), and small mammals make up a larger fraction of their diets, particularly in the eastern United States, where coyotes have hybridized with wolves (26) and rely far more on deer (27, 28). Further, red fox cache prey for later consumption and are thus capable of killing large quantities of prey when prey are abundant (e.g., after an acorn mast). The high abundance of foxes (29), their ability to kill large quantities of small mammals due to both dietary preference and prey-caching behavior, and their adaptability to human-dominated landscapes makes them potentially highly important to suppressing Lyme disease hosts in areas around human habitation. Thus, somewhat paradoxically, the expansion of coyotes likely decreased predation rates on small mammals by suppressing more-efficient predators (foxes).
Here we test the hypothesis that changes in predation have contributed to the continuing emergence of Lyme disease by analyzing disease models that explicitly incorporate predation intensity, and by examining spatial and temporal correlations at multiple scales between Lyme disease, coyote, fox, and deer abundance.
Results
Host–Vector Dynamical Model.
We built a host–vector model to determine how changes in predation might impact Lyme disease risk (Fig. 1, Methods, and Table S2), and found that predation can have a strong nonlinear influence on both the density and infection prevalence of nymphs (Fig. 1 and Fig. S2). At intermediate predator densities, small changes in predation can cause large changes in Lyme disease risk. For example, a 20% reduction in predation near the inflection point in Fig. 1B more than doubles the density of infected nymphs. This nonlinearity is due to the interaction of predation with the quadratic shape of logistic population growth. Host densities near carrying capacity are by definition unproductive. Increasing the predation rate reduces host density, which increases population growth rates. When the host population is maximally productive near intermediate host densities, further increases in predation cannot be compensated for with more reproduction, which allows small increases in predation to cause greater reductions in host density (Fig. S3). Additionally, at these intermediate densities the host turnover rate is highest (maximal steady-state birth and death rates), which reduces host infection prevalence because hosts are born uninfected.
In this model, increasing deer abundance can also increase the density of infected nymphs if it increases the tick birth rate (Fig. 1B). However, the relationship between deer abundance and the tick birth rate is highly uncertain because adult ticks may be able to increasingly concentrate bloodmeals on fewer deer or alternate hosts as deer abundance declines. To explore the hypothesis that the relationship between deer and Lyme disease risk (density of infected nymphs) saturates (i.e., further increases in already abundant deer have little impact on nymph abundance), we reanalyzed data from deer removal studies that recorded deer abundance and the response of nymphs (30). Deer abundance was a poor predictor of tick abundance (measured as nymphs per mouse) 2 y later (Fig. 2A), which did not decline despite great reduction in deer abundance. Similarly, reducing deer density from >90 km−2 to 10 km−2 at Bluff Point coastal reserve in Groton, CT, only reduced tick density below 20 deer per km2 (Fig. 2B) (31).
Fig. 2.

Relationships between deer abundance and Lyme disease risk measured by the density of infected nymphs. (A) I. scapularis nymph abundance, measured as nymphs per mouse, in response to deer removal experiment in Deblinger et al. (30). (B) Nymph density (100 m−2) as a function of deer density (per km2) from Stafford et al. (31). When all data are included, there is a saturating relationship, and there is no significant relationship without the point with the lowest deer density despite nearly 10-fold variation in deer density.
The model suggests that nymphal infection prevalence is only weakly influenced by the tick birth rate (Fig. 1C), because the fraction of ticks that are infected depends primarily on the composition of the host community and only weakly on the abundance of ticks. This finding is consistent with observations that nymphal infection prevalence does not decline inside deer exclosures (32), but does increase with small-mammal abundance (15, 16). The density of infected nymphs is a more direct Lyme disease risk factor than the infection prevalence of nymphs. If adult tick feeding rates saturate, then the key drivers of both the density and infection prevalence of nymphs would be hosts for immature ticks. Thus, the impact of predators would be greater than suggested here if reducing the density of hosts for immature ticks significantly reduces the tick birth rate (see additional model results in Figs. S4–S6).
Temporal Correlations.
Over the past 30 y, correlations between deer abundance and Lyme disease were not significant or mixed in direction (Fig. 3), regardless of whether we scaled antlered-deer harvest by hunting license sales or used raw antlered-deer harvest data (Tables S3 and S4). Thus, we examined the potential role of predators as drivers of Lyme incidence with data on proxies of coyote and fox abundance (i.e., harvest by hunters). Harvests varied up to 10-fold as coyotes increased and foxes declined during the emergence of Lyme disease (Fig. 3). In Minnesota, fox hunter harvest decreased 95% from a high of 78,000 in 1991 to a low of 4,000 in 2008, whereas coyote harvest increased 2,200% from a low of 2,000 in 1982 to 46,000 in recent years. In Wisconsin, coyote hunter harvests increased 660% from a low of 6,847 in 1984 to over 52,000 in 2009, whereas fox harvests decreased 80% from over 25,000 to under 5,000 over that time. In Pennsylvania, only 1,810 coyotes were harvested in 1990, but harvests increased nearly 1,600% to a high of over 30,000 in 2009. In Virginia, where Lyme disease cases have only recently increased (more than 300% increase from 2005 to 2007), coyotes have also increased only recently, averaging ∼3,000 in the 1990s, reaching nearly 10,000 in 2004, and increasing to a recent high of nearly 25,000 (Fig. S1).
Fig. 3.

Temporal trends between Lyme cases and (A) deer harvest per license, the hunter harvest of (B) coyotes, and (C) foxes are consistent with the predation hypothesis. As predicted by the model, the relationship between foxes and Lyme is nonlinear (Lyme cases are on a log scale). (D) Statistical models were compared with AICc. All models with greater than 1% model weight did not have temporally autocorrelated residuals (P > 0.05 Box–Pierce test). Model selection in Pennsylvania underestimates the importance of foxes because we use only data since 1990, the first year that coyote data were collected (fox-only model is best if coyotes are excluded and the full fox and deer time series are analyzed).
Lyme disease cases were positively correlated with coyote abundance and negatively correlated with fox abundance in all four states (Fig. 3). The best models, using a model selection approach based on an information theoretic criterion (33), included measures of predator abundance for all four states. In contrast, deer abundance was present in the best fitting model only in Virginia (Fig. 3D).
Spatial Correlations.
To test whether the spatial distribution of Lyme disease is correlated with the spatial distribution of deer or small-mammal predators, we examined Lyme disease incidence in Wisconsin, Pennsylvania, Virginia, and New York. Across space, Lyme disease incidence did not consistently increase with deer abundance. Deer and Lyme incidence were negatively correlated in Wisconsin and Pennsylvania, positively correlated in Virginia, and uncorrelated in New York (Fig. 4 C–F). In contrast, the spatial distribution of Lyme disease incidence in New York (the only state for which we had spatial data on predator abundance), is positively correlated with coyotes and negatively correlated with foxes (Fig. 4 A and B), which suggests a more important role for variation in the abundance of predators than deer. Lyme disease is notably rare in western New York, where fox are abundant, despite having among the highest deer abundance in the state. It is worth noting that the nonlinear relationship between foxes and Lyme in Fig. 4B closely resembles model predictions (Fig. 1). Previously compiled data on catch-per-unit effort of red fox by trappers and buck harvest density match the spatial distribution of carnivores and deer derived from harvest-independent data (34).
Fig. 4.

Spatial relationships among deer, predators, and Lyme disease. (A) In New York, observation rates from the bow-hunter wildlife survey indicate that Lyme disease incidence (cases per 100,000) is positively correlated with coyotes, (B) negatively correlated with foxes, and (C) unrelated to deer. Coyote observations are scaled by foxes to highlight the transition in the predator community and its impact on Lyme disease. (D) Deer as estimated by the buck harvest density are positively (but weakly) correlated with Lyme disease incidence in Virginia counties (R2 = 0.1, P = 0.001). (E) In contrast, deer density estimates (from sex-age-kill models) are negatively correlated with Lyme incidence in Wisconsin counties (R2 = 0.06, P = 0.05, but driven by few data points—not significant when removed) and (F) negatively correlated in Pennsylvania deer management units (R2 = 0.14, P = 0.09), where the unit with the lowest deer density has the second-highest Lyme incidence. (Insets) Darker red indicates more-abundant wildlife populations and higher Lyme incidence (in four classes: 0–10, 10–50, 50–100, and >100 cases per 100,000).
Temporal Correlations at Smaller Spatial Scales.
Harvest-independent data from multiple regions of Wisconsin also suggest that Lyme incidence is more tightly linked to changes in predator abundance (coyote increase and fox decrease leading to lower overall predation rates) than deer abundance. In Wisconsin, where Lyme disease incidence has increased greatly over the past decade, landowner wildlife surveys indicate that a fox decline and coyote increase occurred throughout the state (Fig. 5), which corroborates the statewide trends from hunter harvest data (Fig. 3). Deer observations have been stable or declining over this period (Fig. 5), although due to high deer abundance, these surveys may be a less-sensitive index for deer. However, on a fine spatial scale, deer density in management units with the highest Lyme incidence did not change over the last decade, whereas Lyme disease cases increased 300% (Fig. S7). Deer densities increased at most sites from the early 1980s until the mid 1990s, which may have caused the initial emergence of Lyme disease in Wisconsin. However, in the past 15 y, deer abundance has slowed markedly, with one-fourth of units showing no increase and several others increasing only a small percentage (Fig. S7).
Fig. 5.

The percent of surveyed rural landowners who saw coyotes, foxes, and deer in five geographic regions of Wisconsin from 1999 to 2009 according to the annual Summer Wildlife Inquiry run by the Department of Natural Resources. Lyme incidence in each region is the weighted average (by area) of county-level incidence.
Discussion
The increase in deer during the early 20th century is thought to have allowed tick populations to grow and spread from small remnant populations, and this likely contributed significantly to the initial rise in Lyme disease cases (7). However, in recent decades, Lyme disease has continued to increase substantially in many places where deer populations have stabilized (Figs. 2 and 4). Further, we detected no relationship between the spatial distribution of Lyme disease and deer abundance in four states (Fig. 4). The weak correlations between changes in deer and Lyme disease incidence is consistent with a saturation in the probability that an adult tick finds a host (e.g., deer) with deer density (Fig. 2). Additionally, recent work from New York found no relationship between threefold variation in deer abundance and the density of infected nymphs over 13 y (12), and there was no response in nymph abundance to a recent deer culling program in New Jersey (13). Thus, though there is convincing evidence linking deer to high nymph densities from deer exclosure studies, and from the complete or near-complete deer removal on islands, linking deer abundance to ticks when deer are abundant has been less successful, particularly at mainland sites where there are many other potential reproductive hosts for Ixodes ticks and where most Lyme disease cases are contracted (reviewed in Table S1).
At the same time, over the past three decades there has been a regional red fox decline coincident with an expanding coyote population. Both spatial and temporal evidence across multiple states suggest that these changes in predator abundance are more closely linked with increases in Lyme disease than are changes in deer abundance. Our theoretical model suggested that changes in predation can in fact lead to the observed increases in Lyme risk, in that both the density and infection prevalence of nymphal ticks are sensitive to reduced predation (Fig. 1). Taken together with the empirical data on spatial and temporal patterns of Lyme incidence, deer, and predator abundance, these results suggest that the red fox declines may have resulted in increased Lyme disease risk due to the loss of predation as an ecosystem service. Detailed studies and experimental manipulation of predators could help elucidate whether controlling Lyme disease might be best accomplished by a combination of predator manipulation and severe reductions in deer densities necessary to reduce tick abundance.
More broadly, these results suggest a need to explore the role of predation in the community ecology of other emerging zoonotic diseases, which overwhelmingly rely on hosts that occupy low trophic levels (1). Due to the widespread eradication of large carnivores (4), top predators in many terrestrial ecosystems are now medium-sized carnivores such as coyotes (5). These medium-sized carnivores can indirectly increase the abundance and diversity of low trophic-level species, such as rodents and songbirds, by suppressing populations of smaller carnivores such as foxes (20). Strong interactions among predators (35) that lead to cascading effects on prey have been documented for over 60 systems worldwide (21). As top predators are extirpated in some parts of the world, and recolonize in others, it will be important to understand the consequences for community composition and for the abundance of low trophic-level species in particular. Such restructuring of predator communities may have unintended consequences for human disease.
Methods
Host–Vector Disease Model.
We use a vector-borne, susceptible-infected (36) modeling framework that describes the dynamics of ticks and small-mammal hosts, and includes parameters to account for the density of alternate hosts and deer. We group multiple species into a functional group of small-mammal hosts with density, Nm. The small-mammal host population growth rate, G(Nm), is logistic with maximum intrinsic growth rate, r, and carrying capacity, K. The mortality rate, M(Nm), follows a Holling type III functional response, which is characteristic of prey-switching generalist predation, with maximum predation rate, a, half-saturation parameter, c, and predator density, P (37–39). This functional response can exhibit alternative stable states in a small region of parameter space, but we stress that our results depend only on an S-shaped functional response, which is characteristic of switching or aggregating behavior in response to more-abundant prey (Fig. S3). An S-shaped functional response is also obtained with a type II functional response when predators respond numerically to increasing prey density (i.e., a combined numerical and functional response; SI Text, Parameters and Derivations).
The differential equation for the total host population is
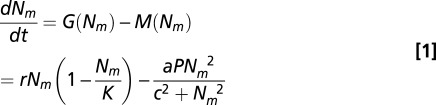 |
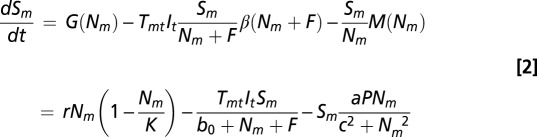
The small-mammal host population consists of susceptible, Sm, and infected, Im, classes. Susceptible hosts become infected with probability Tmt when bitten by an infected nymph, It. A fraction of tick bites occur on incompetent “dilution” hosts, F, so that these hosts divert blood meals away from small mammals but also increase total host abundance. The tick bite rate, β(Nm + F), follows a type II functional response. Because each tick life stage requires a single blood meal, the functional response saturates at 1 as the abundance of hosts increases (i.e., all ticks can feed if there are infinite hosts). The half-saturation parameter, b0, represents the density of small mammals where half of ticks would be expected to feed. Thus, the tick bite rate can be interpreted as the fraction of ticks that successfully feed given the total population of hosts, Nm + F.
The differential equations for susceptible and infected small-mammal hosts are
 |
and
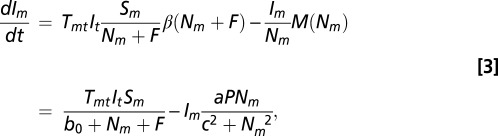 |
where susceptible hosts are created by birth and lost by infection or predation, and infected hosts are created by infection and lost by predation. We assume no increase in predation risk associated with being infected. Therefore, the relative abundance of the susceptible and infected classes determines the relative predation rate of each class.
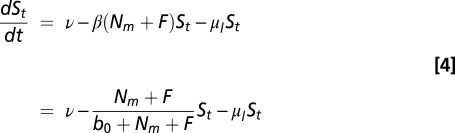
Larval ticks, St, which are all susceptible, have birth rate ν and per-capita death rate μl. We use a constant birth rate that can be varied independently, because it is unknown how vertebrate biomass and community composition influence the tick birth rate. Any larval tick that successfully feeds on either a small-mammal host or dilution host leaves this class so that the differential equation for larva is
 |
Nymphs die at rate, μn, and also leave their class by successfully feeding. Nymphs become infected when larva successfully contract Borrelia from an infected host (i.e., this depends on the frequency of infected hosts) with probability Ttm. Thus, the differential equation for infected nymphs, It, is
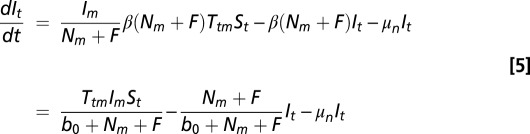 |
Uninfected nymphs, Jt, can be uninfected because a larval tick fed on a susceptible or dilution host or because a larval tick fed on an infected host but did not contract Borrelia. The equation for uninfected nymphs thus has an additional term to account for the probability that feeding on an infected host did not cause infection, but can be simplified to
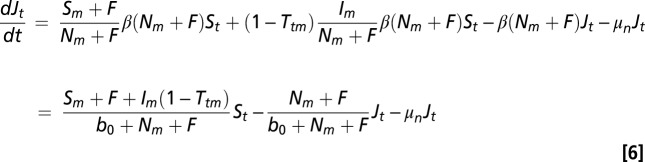 |
We solved for the steady states as a function of the steady-state small-mammal density  . The closed-form solutions, which are presented in SI Text, Steady-State Solutions, explicitly demonstrate the strength of the known multiple drivers of Lyme disease.
Data Analysis.
Spatial Analysis.
New York enlists bow hunters to survey wildlife from tree stands. We averaged the observation rates of each species from 2005 to 2007 in each management unit to compare with Lyme disease incidence from 2006 to 2008. Lyme disease incidence is recorded at a county scale, so we allocated incidence to management units as a weighted average based on the relative area of each county in each wildlife management unit groupings.
In Virginia we used buck harvest per square mile reported in the Virginia deer management plan (14) as a proxy for deer density. Both the harvest data and Lyme disease data are on the county spatial scale. Wisconsin and Pennsylvania produce deer density estimates using the sex-age-kill model (40), which estimates density in management units using data on harvest, age, and sex structure, and fawn-to-doe ratios. Lyme disease incidence is recorded at a county scale. In Pennsylvania, wildlife management units are larger than counties, so we allocated Lyme incidence to management units as above. In Wisconsin, wildlife management units are smaller than counties, so we allocated deer density to counties based on the relative area of each wildlife management unit in each county. For Wisconsin, we additionally analyze changes in deer densities since 1981 in 25 randomly chosen management units intersecting counties with the highest incidence (Fig. S7).
Time-Series Methods.
We use harvest-based proxies for white-tailed deer, coyote, and red fox abundance. To compare the populations of coyotes and foxes with annual Lyme disease cases, we use hunter harvest as a proxy for abundance. Any longitudinal changes in hunting effort are unlikely to be biased in favor of one of these species over another, suggesting that a decline in fox harvests and an increase in coyote harvests represent real population changes. Data on trapper harvest is more widely available but is not reliable because it is influenced by exogenous factors such as pelt prices and changes in trapping regulations designed to prevent incidental catch of high-value or endangered species. Many states, including the four we consider, have liberal coyote- and fox-hunting regulations, including very long or continuous seasons and no bag limits. We therefore conduct our analysis on the subset of large states from which we could obtain hunter harvest time-series data: Wisconsin, Minnesota, Pennsylvania, and Virginia (New York does not collect hunter harvest data); the exception is Pennsylvania, for which we have only total harvest (hunter + trapper) data, which are not as reliable an index for foxes but are likely representative of the population expansion of coyotes as they colonized the state.
As a proxy for deer abundance, we use antlered deer harvest, which is routinely used by wildlife management agencies to monitor trends in deer abundance. Antlered deer harvest is a robust estimate of the statewide deer population due to the large number of hunters that sample the deer population with success rates dependent on the abundance of deer. We scale antlered deer harvest by hunting license sales to capture changes in hunter participation (Fig. S8). Analysis of the hunter functional response from 10 datasets supports a type I functional response (41), which suggests that hunter success rates are expected to increase linearly, rather than simply monotonically, with deer density. Additionally, hunter success rates (Fig. S8; <25% in MN, PA, and WI, and <40% in VA) suggest increases in deer abundance would be represented by increased harvests, because hunters are not saturated with deer. Longitudinal hunter harvest data has been shown to correlate well with trends in deer density and has been used in the literature not only for crude population trends but also for more sophisticated time-series analysis (42–45).
Combining the available wildlife harvest time series, we evaluate the relative support of the predation and deer hypotheses. We additionally analyze antlered deer harvest data not corrected for license sales (Table S3) and harvests of deer, coyotes, and foxes all scaled by hunting license sales (Table S4) to ensure that our results are statistically robust to changes in hunter participation. We use deer (big game) license sales throughout because small-game hunters focus on a variety of species, and individuals may only report that they are coyote or fox hunters if they opportunistically kill one of these species incidental to other activities (46). The strength of each candidate model was evaluated using corrected Akaike Information Criterion (33, 47).
Supplementary Material
Acknowledgments
We thank John Erb and the Minnesota and Wisconsin Departments of Natural Resources; the Pennsylvania Game Commission; Mike Fies and the Virginia Department of Game and Inland Fisheries; and Edward Kautz and the New York Department of Environmental Conservation for collecting and sharing data. We thank Yiwei Wang for original artwork in Fig. 1. This work was supported by a National Science Foundation (NSF) Graduate Research Fellowship (to T.L.); NSF Grants EF 0924195 (to M.M.), EF-0914866 (to A.M.K.), and 0963022, 0729707, and 0713994 (to C.C.W.); and National Institutes of Health Grant 1R01AI090159 (to A.M.K.).
Footnotes
The authors declare no conflict of interest.
This article is a PNAS Direct Submission.
This article contains supporting information online at www.pnas.org/lookup/suppl/doi:10.1073/pnas.1204536109/-/DCSupplemental.
References
- 1.Ostfeld RS, Holt RD. Are predators good for your health? Evaluating evidence for top-down regulation of zoonotic disease reservoirs. Front Ecol Environ. 2004;2:13–20. [Google Scholar]
- 2.Jones CG, Ostfeld RS, Richard MP, Schauber EM, Wolff JO. Chain reactions linking acorns to gypsy moth outbreaks and Lyme disease risk. Science. 1998;279:1023–1026. doi: 10.1126/science.279.5353.1023. [DOI] [PubMed] [Google Scholar]
- 3.Keesing F, et al. Impacts of biodiversity on the emergence and transmission of infectious diseases. Nature. 2010;468:647–652. doi: 10.1038/nature09575. [DOI] [PMC free article] [PubMed] [Google Scholar]
- 4.Estes JA, et al. Trophic downgrading of planet Earth. Science. 2011;333:301–306. doi: 10.1126/science.1205106. [DOI] [PubMed] [Google Scholar]
- 5.Prugh LR, et al. The rise of the mesopredator. Bioscience. 2009;59:779–791. [Google Scholar]
- 6.Bacon RM, Kugeler KJ, Mead PS. Morbidity and Mortality Weekly Report. Atlanta: Centers for Disease Control; 2008. Surveillance for Lyme disease—United States, 1992–2006; pp. 1–9. [PubMed] [Google Scholar]
- 7.Barbour AG, Fish D. The biological and social phenomenon of Lyme disease. Science. 1993;260:1610–1616. doi: 10.1126/science.8503006. [DOI] [PubMed] [Google Scholar]
- 8.Spielman A, Wilson ML, Levine JF, Piesman J. Ecology of Ixodes dammini-borne human babesiosis and Lyme disease. Annu Rev Entomol. 1985;30:439–460. doi: 10.1146/annurev.en.30.010185.002255. [DOI] [PubMed] [Google Scholar]
- 9.Wilson ML, Telford SRI, 3rd, Piesman J, Spielman A. Reduced abundance of immature Ixodes dammini (Acari: Ixodidae) following elimination of deer. J Med Entomol. 1988;25:224–228. doi: 10.1093/jmedent/25.4.224. [DOI] [PubMed] [Google Scholar]
- 10.Ostfeld RS. Lyme Disease: The Ecology of a Complex System. New York: Oxford Univ Press; 2011. [Google Scholar]
- 11.Wilson ML, Levine JF, Spielman A. Effect of deer reduction on abundance of the deer tick (Ixodes dammini) Yale J Biol Med. 1984;57:697–705. [PMC free article] [PubMed] [Google Scholar]
- 12.Ostfeld RS, Canham CD, Oggenfuss K, Winchcombe RJ, Keesing F. Climate, deer, rodents, and acorns as determinants of variation in Lyme-disease risk. PLoS Biol. 2006;4:e145. doi: 10.1371/journal.pbio.0040145. [DOI] [PMC free article] [PubMed] [Google Scholar]
- 13.Jordan RA, Schulze TL, Jahn MB. Effects of reduced deer density on the abundance of Ixodes scapularis (Acari: Ixodidae) and Lyme disease incidence in a northern New Jersey endemic area. J Med Entomol. 2007;44:752–757. doi: 10.1603/0022-2585(2007)44[752:eorddo]2.0.co;2. [DOI] [PubMed] [Google Scholar]
- 14.Ellis B. 2007. Virginia Deer Management Plan 2006–2015. Wildlife Information Publication No. 07-1 (Virginia Dept of Game and Inland Fisheries, Wildlife Division, Richmond, VA)
- 15.Ostfeld RS, et al. Effects of acorn production and mouse abundance on abundance and Borrelia burgdorferi infection prevalence of nymphal Ixodes scapularis ticks. Vector Borne Zoonotic Dis. 2001;1:55–63. doi: 10.1089/153036601750137688. [DOI] [PubMed] [Google Scholar]
- 16.Tsao JI, et al. An ecological approach to preventing human infection: vaccinating wild mouse reservoirs intervenes in the Lyme disease cycle. Proc Natl Acad Sci USA. 2004;101:18159–18164. doi: 10.1073/pnas.0405763102. [DOI] [PMC free article] [PubMed] [Google Scholar]
- 17.Brisson D, Dykhuizen DE, Ostfeld RS. Conspicuous impacts of inconspicuous hosts on the Lyme disease epidemic. Proc Biol Sci. 2008;275:227–235. doi: 10.1098/rspb.2007.1208. [DOI] [PMC free article] [PubMed] [Google Scholar]
- 18.Hanski I, Henttonen H, Korpimäki E, Oksanen L, Turchin P. Small-rodent dynamics and predation. Ecology. 2001;82:1505–1520. [Google Scholar]
- 19.Gompper ME. Top carnivores in the suburbs? Ecological and conservation issues raised by colonization of North-Eastern North America by coyotes. Bioscience. 2002;52:185–190. [Google Scholar]
- 20.Crooks KR, Soule ME. Mesopredator release and avifaunal extinctions in a fragmented system. Nature. 1999;400:53–566. [Google Scholar]
- 21.Ritchie EG, Johnson CN. Predator interactions, mesopredator release and biodiversity conservation. Ecol Lett. 2009;12:982–998. doi: 10.1111/j.1461-0248.2009.01347.x. [DOI] [PubMed] [Google Scholar]
- 22.Sargeant AB, Allen SH, Hastings JO. Sptial relations between sympatric coyotes and red foxes in North Dakota. J Wildl Manage. 1987;51:285–293. [Google Scholar]
- 23.Way JG, Ortega IM, Auger PJ. Eastern coyote home range, territoriality and sociality on urbanized Cape Cod, Massachusetts. Northeast Wildlife. 2002;57:1–18. [Google Scholar]
- 24.Patterson BR, Messier F. social organization and space use of coyotes in Eastern Canada relative to prey distribution and abundance. J Mammal. 2001;82:463–477. [Google Scholar]
- 25.Tremblay JP, Crete M, Huot J. Summer foraging behavior of eastern coyotes in rural versus forest landscape: A possible mechanism of source sink dynamics. Ecoscience. 1998;5:172–182. [Google Scholar]
- 26.Kays R, Curtis A, Kirchman JJ. Rapid adaptive evolution of northeastern coyotes via hybridization with wolves. Biol Lett. 2010;6:89–93. doi: 10.1098/rsbl.2009.0575. [DOI] [PMC free article] [PubMed] [Google Scholar]
- 27.Major JT, Sherburne JA. Interspecific relationships of coyotes, bobcats, and red foxes in Western Maine. J Wildl Manage. 1987;51:606–616. [Google Scholar]
- 28.Gompper ME. The Ecology of Northeastern Coyotes: Current Knowledge and Priorities for Future Research. New York: Wildlife Conservation Society; 2002. [Google Scholar]
- 29.Samia NI, et al. Dynamics of the plague-wildlife-human system in Central Asia are controlled by two epidemiological thresholds. Proc Natl Acad Sci USA. 2011;108:14527–14532. doi: 10.1073/pnas.1015946108. [DOI] [PMC free article] [PubMed] [Google Scholar]
- 30.Deblinger RD, Wilson ML, Rimmer DW, Spielman A. Reduced abundance of immature Ixodes dammini (Acari: Ixodidae) following incremental removal of deer. J Med Entomol. 1993;30:144–150. doi: 10.1093/jmedent/30.1.144. [DOI] [PubMed] [Google Scholar]
- 31.Stafford KC, 3rd, Denicola AJ, Kilpatrick HJ. Reduced abundance of Ixodes scapularis (Acari: Ixodidae) and the tick parasitoid Ixodiphagus hookeri (Hymenoptera: Encyrtidae) with reduction of white-tailed deer. J Med Entomol. 2003;40:642–652. doi: 10.1603/0022-2585-40.5.642. [DOI] [PubMed] [Google Scholar]
- 32.Daniels TJ, Fish D, Schwartz I. Reduced abundance of Ixodes scapularis (Acari: Ixodidae) and Lyme disease risk by deer exclusion. J Med Entomol. 1993;30:1043–1049. doi: 10.1093/jmedent/30.6.1043. [DOI] [PubMed] [Google Scholar]
- 33.Burnham KP, Anderson DR. Model Selection and Multi-Model Inference: A Practical Information-Theoretic Approach. 2nd Ed. New York: Springer; 2002. [Google Scholar]
- 34.Roberts N. Furbearer harvest assessment and management. In: MacDuff A, Smith S, editors. Furbearer Management News. Albany, NY: New York State Dept of Environmental Conservation; Summer 2008. [Google Scholar]
- 35.Levi T, Wilmers CC. Wolves-coyotes-foxes: A cascade among carnivores. Ecology. 2012;93:921–929. doi: 10.1890/11-0165.1. [DOI] [PubMed] [Google Scholar]
- 36.Kermack WO, McKendrick AG. A contribution to the mathematical theory of epidemics. Proc R Soc Lond A. 1927;115:700–721. [Google Scholar]
- 37.Erlinge S, et al. Predation as a regulating factor on small rodent populations in southern Sweden. Oikos. 1983;40:36–52. [Google Scholar]
- 38.Turchin P. Complex Population Dynamics: A Theoretical/Empirical Synthesis. Princeton, NJ: Princeton Univ Press; 2003. [Google Scholar]
- 39.Murdoch WW. Switching in general predators: Experiments on predator specificity and stability of prey populations. Ecol Monogr. 1969;39:335–354. [Google Scholar]
- 40.Skalski JR, Ryding KE, Millspaugh JJ. Wildlife Demography: Analysis of Sex, Age, and Count Data. San Diego: Academic; 2005. [Google Scholar]
- 41.VanDeelen TR, Etter DR. Effort and the functional response of deer hunters. Hum Dimens Wildl. 2003;8:97–108. [Google Scholar]
- 42.Forchhammer MC, Stenseth NC, Post E, Langvatn R. Population dynamics of Norwegian red deer: Density-dependence and climatic variation. Proc Biol Sci. 1998;265:341–350. doi: 10.1098/rspb.1998.0301. [DOI] [PMC free article] [PubMed] [Google Scholar]
- 43.Sand H, Bergstrom R, Cederlund G, Ostergren M, Stalfelt F. Density-dependent variation in reproduction and body mass in female moose Alces alces. Wildl Biol. 1996;2:233–245. [Google Scholar]
- 44.Picton HD. Climate and the prediction of reproduction of three ungulate species. J Appl Ecol. 1984;21:869–879. [Google Scholar]
- 45.Mysterud A, Yoccoz NG, Stenseth NC, Langvatn R. Relationships between sex ratio, climate and density in red deer: The importance of spatial scale. J Anim Ecol. 2000;69:959–974. [Google Scholar]
- 46.Krause GF, Sampson FW, Orr JM. Biased coyote harvest estimates: A paradox. J Wildl Manage. 1969;33:444–446. [Google Scholar]
- 47.Hurvich CM, Tsai CL. Regression and time series model selection in small samples. Biometrika. 1989;76:297–307. [Google Scholar]
Associated Data
This section collects any data citations, data availability statements, or supplementary materials included in this article.