

Background: The DNA adenine methyltransferase has several functions, including epigenetic gene regulation.
Results: Processivity of Dam is influenced by the extent and sequence of flanking DNA.
Conclusion: Activity of Dam is modulated by the clustering of GATC sites, which occurs in known regulatory regions.
Significance: Differing mechanisms of Dam can help explain its diverse roles, including its participation in virulence regulation.
Keywords: DNA-binding Protein, DNA Methyltransferase, Enzyme Kinetics, Epigenetics, Gene Regulation, Nucleic Acid Enzymology, Hopping, Processivity
Abstract
The methylation of adenine in palindromic 5′-GATC-3′ sites by Escherichia coli Dam supports diverse roles, including the essential regulation of virulence genes in several human pathogens. As a result of a unique hopping mechanism, Dam methylates both strands of the same site prior to fully dissociating from the DNA, a process referred to as intrasite processivity. The application of a DpnI restriction endonuclease-based assay allowed the direct interrogation of this mechanism with a variety of DNA substrates. Intrasite processivity is disrupted when the DNA flanking a single GATC site is longer than 400 bp on either side. Interestingly, the introduction of a second GATC site within this flanking DNA reinstates intrasite methylation of both sites. Our results show that intrasite methylation occurs only when GATC sites are clustered, as is found in gene segments both known and postulated to undergo in vivo epigenetic regulation by Dam methylation. We propose a model for intrasite methylation in which Dam bound to flanking DNA is an obligate intermediate. Our results provide insights into how intrasite processivity, which appears to be context-dependent, may contribute to the diverse biological roles that are carried out by Dam.
Introduction
The monomeric Escherichia coli Dam2 methylates adenines at the N6 position of palindromic 5′-GATC-3′ sites (1). Unlike the majority of bacterial DNA methyltransferases, Dam lacks a cognate endonuclease. Dam is involved in the mismatch repair system (2), chromosome replication (3), nucleoid structure determination (4), and gene regulation (5, 6). Known and putative dam genes are co-conserved with MutH, a key protein for mismatch repair (7). Immediately after replication, only the parental strand is methylated, which guides the mismatch repair system; these hemimethylated GATC sites are the substrate of Dam. Although nearly all of the 20,000 GATC sites in E. coli are involved in mismatch repair, ∼0.1% of these are excluded from this process (8) and can be heritably unmethylated. However, these sites can be methylated upon differing environmental conditions (9), suggesting that they may be involved in gene regulation. The methylation state of a subset of these GATC sites epigenetically regulates gene transcription (Fig. 1) such as the pap (10), gtr (5), and agn43 (11) promoters, where GATC sites switch between the unmethylated to the fully methylated states.
FIGURE 1.
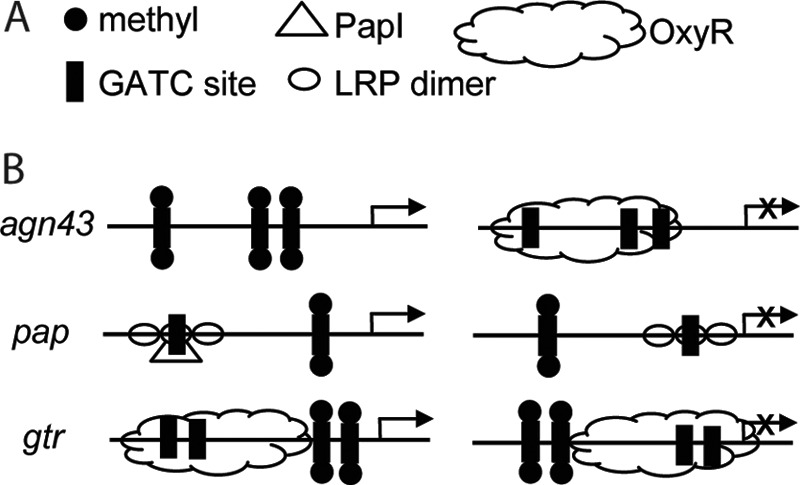
Known examples of methylation state-dependent epigenetically regulated operons. A, legend. B, operons in the “on” state (left panel) and in the “off” state (right panel).
GATC sites known and postulated to be involved in gene regulation are highly clustered (supplemental Fig. 1, supplemental Table 1) and have unique flanking sequences in comparison with the majority of genomic GATC sites (6). Some sites have a conserved A-tract 5′ to the GATC site, which affects the methylation rate and the intersite processive methylation of the enzyme (12, 13). An A-tract is referred to as a nonpreferred flank, whereas most non-AT-rich flanks are referred to as preferred. Intersite processivity refers to the ability of an enzyme to modify two or more sites without dissociating. Other sites have AT-rich flanks, which have modestly lowered methylation rates, and most have A-tracts near and around the GATC sites. It appears as if these transiently unmethylated GATC sites are in similar DNA contexts, in the small minority of regulatory sites in the E. coli genome, distinguishable from the majority of other GATC sites. Upon more robust classifications, these sites may form a set of “molecular rules” (14), providing a basis for identifying new epigenetically regulated operons and giving insight into the function of the other unmethylated GATC sites in the E. coli genome. We want to explore how Dam behaves at these unique regions.
Initial studies on unmethylated DNA showed that Dam is able to methylate the adenines on both DNA strands within a single cognate site before dissociation, which was referred to as intrasite processivity (15). To accomplish this, the enzyme must switch strands and reorient itself, breaking and reforming its contacts with the DNA (Fig. 2A). The restriction endonucleases BfiI (16) and BcnI (17), which cleave both strands of DNA within one cognate site, appear to rely on a similar reorientation of a single active site. The phenomenon of intrasite processivity is suggestive of hopping, where proteins interact with and move along DNA not only by one-dimensional sliding, but by using several dissociation-reassociation steps (18, 19). Although diverse techniques have been used to show that several proteins rely on mechanisms other than sliding (20, 21), there are limited details about how hopping works.
FIGURE 2.
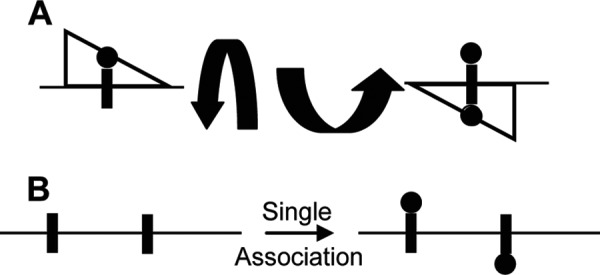
Schematic of intrasite and intersite processivity. A, schematic of the intrasite processivity of Dam (open triangle) where each adenine in the palindromic GATC site is methylated. Arrows represent how Dam must both switch strands and rotate 180°. B, intersite processivity experiment where enzyme encounters a piece of DNA and can modify sites on both strands before dissociation. See the Introduction and references for diversity of enzymes and modifications (23–26). Sites to be modified are represented as closed rectangles, and modifications to the sites are represented as closed circles.
Hopping has generated significant interest as a way to understand how proteins can efficiently find their recognition sites when an overwhelming excess of nonspecific DNA is present (22). Hopping has also been used to explain how an enzyme can processively modify DNA when two or more sites have the opposite strand orientation, requiring the enzyme to reorient itself between modifying the first and subsequent sites (Fig. 2B). Importantly, during this process, the enzyme has a greater probability of rebinding the original DNA molecule than binding to another DNA molecule. Several enzymes display this activity, including T4 Dam (23), uracil DNA glycosylase (24), human alkyladenine DNA glycosylase (25), and BbvcI restriction endonucleases (26). Given the diversity of enzymes that can switch DNA strands and the general lack of mechanistic understanding of the underlying processes, we sought to explore the factors that regulate the intrasite hopping mechanism of Dam.
Our original description of intrasite methylation by Dam relied on short, single site synthetic double-stranded DNA (15). In contrast, prior work with plasmids showed that this activity is largely suppressed (1), suggesting that flanking DNA segments longer than those used in our original studies may regulate this activity. Although the majority of GATC sites on the bacterial genome are predicted to be separated by ∼260 bp, GATC sites known and postulated to be involved in gene regulation are generally separated by ∼10–100 bp (supplemental Fig. 1). The purpose of this study is to characterize how the sequence contexts of GATC sites, specifically their clustering, regulate the intrasite processivity of Dam, with the goal of better understanding the mechanisms of the varied roles of Dam in the cell. We also want to explore how proteins are able to processively modify their cognate sites by switching strands.
EXPERIMENTAL PROCEDURES
DNA Substrates
All restriction endonucleases were obtained from New England Biolabs. All synthetic DNA substrates and primers were obtained from Integrated DNA Technologies and Midland Certified Reagent and were resuspended in TE buffer (10 mm Tris, pH 7.5, 1 mm EDTA). They were annealed with their reverse complements in a 1:1 mixture for 5 min at 95 °C and allowed to cool to room temperature (∼5 h). Annealing was verified by PAGE. Substrate 1A (see Table 1) is 5′-GTTCGTCATGCATGCAATGGAAAAGATCAGGTACCTGAATCACGAACGTTAGGCATTCGC-3′. The substrate used in the mutant analysis (see Fig. 6) is: 5′-ATCGTGGACTTCTACTTGGATGGAGGATCGGATGACACGTATTCCAGGAATTCACGTTAC-3′. The production of several PCR amplicons used the following strategy. A synthetic oligonucleotide with two GATC sites and two restriction sites between the GATC sites was cloned into plasmid pBR322 (New England Biolabs). 362- and 777-bp spacers were generated by PCR and cloned into the plasmid, generating different distances between the GATC sites. These plasmids were PCR-amplified with different primers to adjust the spacings from the GATC sites to the ends of the DNA. The same strategy applied to an engineered vector with a single GATC site.
TABLE 1.
Intrasite processivity is modulated by lengths of flanking DNA
The numbers under the cartoon column refer to the amount of base pairs surrounding the GATC sites. kchem refers to the observable single exponential rate constant (min−1) derived from the tritium assay. “Yes” and “No” under the intrasite column refer to intrasite processive and sequential, respectively. See Fig. 4 for tritium and DpnI assays of these substrates.

FIGURE 6.

Intrasite processivity of Dam mutants. The tritium data (closed circle) and DpnI data (inverted gray triangle) for Dam mutants with a 60-bp substrate are shown. A, K139A; B, N132A; C, R116A; D, R95A; E, N126A. Only E is sequential. Error bars represent between 2 and 5 replicates, mean ± S.D.
The following substrates were cloned into the plasmid pBR322 at the EcoRI and HindIII sites: double site, 5′-AATTCGGTGATCTTTTCGACCCGGGAGCTGGTAGTATGCCCATGGTTCGATCTTTTGCCA-3′, and single site, 5′AATTCGGTGATCTTTTCGACCCGGGAGCTGGTAGTATGCCCATGGTTCGGTCTTTTGCCA-3′, making new plasmids called pBRMut0double and pBRMut0single. The cloned, synthetic insert had additional cloning sites within it: XmaI and NcoI (bolded and italicized). These sites were used to insert PCR-purified spacers between the two GATC site(s) (underlined). Upon PCR amplification, the spacers were digested with XmaI and NcoI to generate overhangs. The spacers were generated by PCR from the plasmid pBR322 with restriction sites using the same forward primer: 5′-ATTCCCGGGGGCTACCCTGTGGAACACCT-3′,with different reverse primers for each sized spacer: substrates 2C and 2D from Table 1, 5′-TAATCCATGGGCAGCTGCGGTAAAGCTCAT-3′, substrate 2E from Table 1, 5′-TAATCCATGGCATGTTCTTTCCTGCGTTATCCCC-3′.Plasmid pBRMut0 was digested, and the spacers were inserted, making plasmids pBRMut2 and pBRMut3. Amplicons with 115/119-bp flanking GATC sites were amplified from plasmid pBRMut0,2,3 using primers: forward, 5′-GGGTTCCGCGCACATTTCCC-3′ and reverse, 5′-CCAGGGTGACGGTGCCGAGG-3′. Amplicons with 300-bp flanking GATC sites were amplified from plasmid pBRMut0,2,3 using primers: forward, 5′-GCATCTTTTACTTTCACCAGCG-3′, and reverse, 5′-GGCTCCAAGTAGCGAAGCGAGC-3′. PCR amplicons were purified using the Agilent PCR clean-up kit and ethanol-precipitated to achieve the desired concentrations.
Single Turnover Reactions
All single turnover reactions were done in methylation reaction buffer (100 mm Tris, pH 8.0, 1 mm EDTA, 1 mm DTT, 0.2 mg/ml BSA) with 400 nm DNA, 420 nm Dam, 0.2 mg/ml BSA, and 30 μm S-adenosylmethionine (6 Ci/mmol mixture of unlabeled and [3H]methyl-labeled, PerkinElmer Life Sciences). Reactions were initiated with DNA with a total volume ranging from 60 to 80 μl and were done at 15 °C. 8-μl reaction fractions were quenched with 8 μl of 1% SDS. 14.5-μl quenched fractions were spotted on DE81 filter paper. The paper was washed three times with a 50 mm KH2PO4 buffer, washed once in 80% ethanol, washed once in 95% ethanol, and dried in diethyl-ether; all washing steps were for 5 min. Papers were dried and submerged in Bio-Safe II scintillation fluid. Tritium levels were quantified using a Beckman Coulter LS6500 scintillation counter and converted to nm of DNA product. Plateau levels of 100% were defined by the complete methylation-available adenines in the reaction mixture. All single turnover tritium reactions were fit to a single exponential (Equation 1, A0 is the plateau level, which is 100%).
DpnI Assay
2.5 μl of the single turnover (here, 30 μm of unlabeled S-adenosylmethionine) assay was heat-inactivated in 14.8 μl of 75 °C water for 20 min. After slow cooling, 2 μl of NEBuffer 4 was added, and the mixture was incubated at 37 °C for ∼20 min. 0.7 μl of DpnI was added to NEBuffer (14 units), and the solution was rapidly mixed. The cutting reaction proceeded for 10 min at 37 °C until it was heat-inactivated in an 80 °C water bath for 20 min and slow-cooled to room temperature for subsequent gel analysis. The reaction products were analyzed using PAGE (20–5% 29:1 acrylamide:bisacrylamide, depending on substrate length) for 2 h at 300 V in Tris-boric acid EDTA. Gels were stained with SybrAu and scanned on a Typhoon PhosphorImager (GE Healthcare). Nucleic acids were quantified using the software provided with the Typhoon. The densities of the different nucleic acid bands after several hours of reaction incubation (complete methylation) and subsequent digestion with the DpnI restriction endonuclease are defined as having the reaction being 100% complete (supplemental Figs. 2 and 4, which include sample gels).
Competition Experiment
The competition experiment consisted of a single turnover reaction with substrate 1A, to which an equimolar amount of a 500-bp nonspecific (no GATC sites) piece of DNA was added. The reaction was initiated with a mixture of substrate 1A and the nonspecific DNA. The nonspecific DNA was generated by PCR using plasmid pBR322 as a template and the forward primer 5′-ATTCCCGGGGGCTACCCTGTGGAACACCT-3′ and the reverse primer 5′-TAATCCATGGCCCGGCATCCGCTTACAGAC-3′.
Enzyme Expression and Purification
Dam was expressed and purified as described previously (27). In summary, Dam was overexpressed in XL2 Blue (Stratagene) E. coli cells grown at 37 °C in LB media with 25 μg/ml kanamycin and 12.5 μg/ml tetracycline. After reaching an optical density of 0.4–0.6, the cells were induced with 1 mm isopropyl-1-thio-β-d-galactopyranoside and 0.05% l-arabinose and grown for 2 h. The pellets were resuspended in 40 ml of P11 buffer (50 mm potassium phosphate, pH 7.4, 10 mm β-mercaptoethanol, 1 mm EDTA, 1 mm PMSF, 0.2 mm NaCl, 10% glycerol) and lysed by sonication: 70% amplitude, 2 s on, 15 s off, total time 1 min. Lysate was centrifuged for 60 min at 15,000 rpm at 4 °C. Supernatant was loaded onto a 60-ml phosphocellulose (Whatman) column. The protein was eluted with a salt gradient from 0.2 and 0.8 m NaCl, and fractions with Dam were pooled and dialyzed in Blue Sepharose buffer (20 mm potassium phosphate buffer, pH 7.0, 10 mm β-mercaptoethanol, 1 mm EDTA, 1 mm PMSF, 10% glycerol). Upon overnight dialysis, the protein was loaded onto a 20-ml Blue Sepharose 6 FastFlow (GE Healthcare) column and eluted with a salt gradient between 0 and 1.5 m NaCl. Fractions were pooled and flash frozen at −80 °C. The protein concentration was determined using the extinction coefficient of 1.16 mg−1cm−1 at 280 nm.
RESULTS
Assay Development
The original evidence for intrasite processive methylation relied on single turnover experiments and a tritiated S-adenosylmethionine assay with a single site 21-bp double-stranded DNA substrate (15). For Dam, product release is rate-limiting, and the observed rate constant from a single turnover reaction is the methyl transfer rate constant, kchem (27). Our experiments are defined as single turnover because enzyme is in excess of DNA molecules, but not available adenines, and the addition of more enzyme does not alter kchem (data not shown). The tritium assay measures total methylation, which can be both single and double methylation (of a single site, which has two adenines); it cannot be used to directly monitor the formation of double methylation. Here, we sought to track double methylation events exclusively. To address this, we developed an assay using the restriction endonuclease DpnI, which cuts doubly methylated GATC sites significantly more efficiently than hemimethylated sites. We optimized conditions so that no hemimethylated DNA was cut and >85% of doubly methylated DNA was cut (supplemental Materials and Methods, supplemental Fig. 2). This was done to confirm that the reaction defined as intrasite processive involved no hemimethylated intermediates. To validate this assay, the DpnI cutting profile was compared with the tritium assay, giving the same rate constant (Fig. 3A). This confirms that for this substrate (1B from Table 1), both experimental methods, which are identical except for the readout, measure the rate of double methylation, the action defined as intrasite processivity.
FIGURE 3.
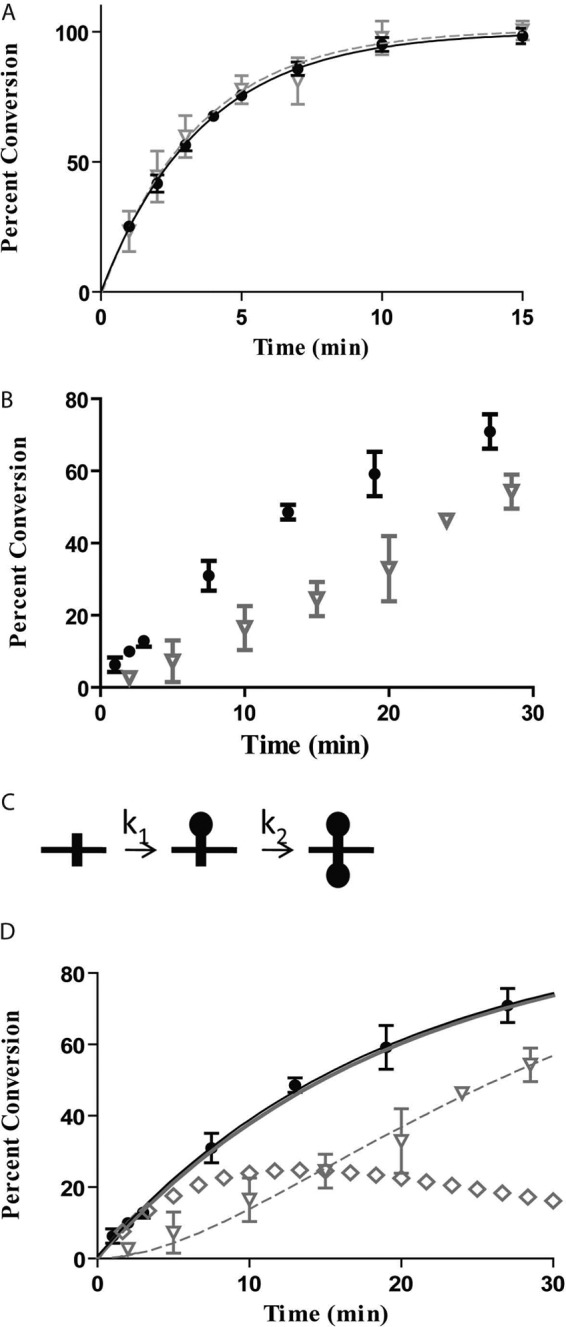
Validation of DpnI assay to detect intrasite processivity. Comparison of tritium and DpnI assay, 200 nm DNA, 210 nm Dam, 30 μm S-adenosylmethionine, and 15 °C are shown. 100% conversion for the DpnI trace refers to complete methylation of substrate and subsequent DpnI digestion based on the assay described in supplemental Fig. 2. Tritium data are represented by black dots, and DpnI data for the 115-bp fragment are represented by inverted gray triangles. Error bars represent between 2 and 5 replicates, mean ± S.D. A, substrate 1B. Single turnover fit for tritium is a solid black line, and single turnover fit for the DpnI data is a dashed gray line. B, tritium data (closed circle) and DpnI data (inverted gray triangle) for substrate 1C. C, reaction scheme for total methylation of an unmethylated site. k1 is the methylation rate constant from unmethylated to hemimethylated; k2 is the methylation rate constant from hemimethylated to doubly methylated. D, rate constants k1 = 0.10 min−1 and k2 = 0.053 min−1 are used in Equation 3 (dashed gray line) and Equation 4 (solid gray line) to fit with the data. Also included is the single turnover fit from the tritium data (solid black line), and the profile for hemimethylated DNA (gray diamonds).
Dam does not always display intrasite processivity, as demonstrated by a delay in the DpnI cutting profile in comparison with the tritium data (Fig. 3B, substrate 1C, Table 1). The discrepancy in the observed activity of the two methods is attributed to the presence of a hemimethylated intermediate, which is enumerated in the tritium assay, but not by DpnI. Using the tritium data, the DpnI data, and kinetic modeling, we confirmed that this delay represents an almost completely non-intrasite processive mechanism, which will be referred to as sequential. For the sequential reaction, Dam methylates one strand and then completely dissociates from the DNA before returning to methylate the second strand. The ability of Dam to fully methylate a GATC site can be simplified into the reaction scheme in Fig. 3C, and the individual components can be tracked by Equations 2–4 (k1 and k2 are as described in Fig. 3; A0 is the plateau level, which is 100%) regardless of its methylation mechanism (28). These equations are used to relate the tritium data to the DpnI data, both of which are read-outs for the same reaction. Although k1 and k2 represent observed rates of methylation, imbedded in each term are several other events, such as DNA binding, translocation, and methylation. Several groups have used the strategy employed here of directly monitoring activity, not including the other microscopic rate constants, to model processive, nonprocessive, and partially processive events (24, 26). Processivity is defined simply as the relative enhancement in k2 over k1. Knowing the values of k1 and k2 allows one to profile individual species of the reaction separately, showing the amount of single methylation, double methylation, and total methylation (which is a combination of single and double methylation) at any time point. The double methylation product profile is equivalent to the DpnI data. Total methylation, reflecting the sum of hemimethylation (B, Equation 2) and double methylation (C, Equation 3), is equivalent to the tritium data (Equation 4). Therefore, k1 and k2 can be modeled using a least squares fit such that the tritium data match the trace from Equation 4 and the DpnI data match the trace for Equation 3 (Fig. 3D). In summary, the legitimacy of the DpnI assay is confirmed by deriving rate constants from the DpnI data and matching the trace with the tritium data.
 |
For an intrasite processive event, k2 is much faster than k1; the initial methylation is followed by a rapid methylation of the opposite strand with no detectable hemimethylated products. The enhancement in k2 comes from the enzyme maintaining contact with the DNA during both methylations, foregoing dissociation and rebinding steps. Alternatively, for a sequential reaction, each methylation event involves free enzyme poised to bind DNA, and the first methylation event would not affect the second methylation. Because the rate of the methylation of hemimethylated to fully methylated is close to that of nonmethylated to fully methylated, k1 would be predicted to be similar to k2 for a sequential process (15). Because enzymes can display a gradient of processivity, several ratios of k2:k1 were modeled to predict the DpnI traces of partially processive scenarios (supplemental Fig. 3). Notably, when k2 is only 10-fold larger than k1, the DpnI trace matches the tritium trace. This suggests that there is a narrow window of possible rate constants between sequential and intrasite methylation. A sequential process requires the enzyme to undergo product dissociation, the rate-limiting step, and release of the cofactor product before the second methylation step can occur. These processes could make k2 slower than the observed rate of k1. Given this reasoning, it is impossible to define what ratio of k1:k2 would constitute a truly sequential process. Interestingly, the tritium data fit to a single exponential (one observable rate constant) for both sequential and intrasite methylation. This observation can be rationalized. If the site is methylated entirely via an intrasite mechanism, the second rate constant is too fast to be detectable; when sequential, the two rate constants approach each other, again resulting in what appears to be a single exponential.
WT Single Turnover Results
Intrasite processivity was confirmed on a short synthetic piece of DNA (substrate 1A) with nonpreferred flanks (Fig. 4A). Adding additional flanks of ∼100 bp (PCR-derived substrates, see “Experimental Procedures”) to each side of the GATC site still showed intrasite processivity (Table 1, Fig. 3A). However, when extending the flanks on one side of the site, the DpnI cutting data match the trace for a sequential mechanism. Again, k1 and k2 are modeled such that the tritium data correlate with the Dpn1 data (Fig. 3). This shows that intrasite processivity is compromised by flanking DNA (Fig. 4). As seen in Table 1, greater than ∼400 bp of nonspecific flanking DNA on one side of the GATC site causes the reaction to be sequential for single site substrates. Additionally, the methylation rate constants decrease significantly upon the addition of larger flanks (see “Discussion”).
FIGURE 4.

Intrasite processivity is modulated by lengths of flanking DNA. The tritium data (closed circle) and DpnI data (inverted gray triangle) for substrates from Table 1. k1 and k2 (as described under “Results” and in the legend for Fig. 3, min−1) are given for the single site sequential substrates: substrate 1A (A); substrate 1D (B); k1 = 0,072, k2 = 0.036, substrate 1E (C); k1 = 0,025, k2 = 0.014 substrate 2B (D); substrate 2C (E); substrate 2D (F), substrate 2E (G); and substrate 1LL (H). Although the kinetic scheme is too complicated to predict what the sequential methylation of each site would be for substrate 2E, the characteristic delay in the DpnI trace in comparison with the tritium trace is convincing enough to assume that the hemimethylated intermediate is present. For D–G, the DpnI data represent the accumulation of the 115-mer fragment, which was nearly identical to the 119-mer fragment (not shown). Error bars represent between 2 and 5 replicates, mean ± S.D.
Double site substrates were used to explore the relationship between intrasite processivity and the clustering of GATC sites. The reaction conditions were the same as used for single site substrates (enzyme:DNA, 1.05:1); note here that the number of GATC sites is approximately twice the amount of enzyme. Interestingly, all four methylation events were embedded in a single rate constant for methylation by following tritium incorporation (Fig. 4, D–F). The DpnI data, which are simpler to interpret than the tritium because they trace each site separately, showed that each site underwent intrasite processivity. This was shown for several substrates (Table 1). However, intrasite processivity is compromised when 777 bp are added between the two sites (Table 1, Fig. 4G).
The DpnI assay allows for a direct comparison of methylation profiles for substrates with and without an additional GATC site. Based on the information in Table 1, only if more than ∼400 bp surround the site is intrasite processivity lost. Introduction of a second GATC site, however, resurrects intrasite processivity at both GATC sites. The third and fourth rows of Table 1 show identical substrates, except that the ones on the right have an additional site added and show intrasite processive methylation. Additionally, a single site substrate, 1LL, with flanks of 300 and 350 bp surrounding the GATC site, is intrasite processive (Fig. 4, Table 1). This shows that decreases in methylation rate constants alone do not lead to a sequential mechanism because substrate 1C has a similar rate constant but does not display intrasite processivity.
Taken together, the single and double site data show that intrasite processivity is sensitive to the amount of DNA surrounding GATC sites. Also, the results in Table 1 can address the potential concern that intrasite processivity manifests itself by Dam switching strands at the ends of the DNA. Substrate 1B shows intrasite processivity, where the shortest distance from the GATC site to the end of the DNA is 115 bp; substrates 1C–E have the same feature, but are not intrasite processive. Therefore, if the “end effect” contributed to intrasite processivity, substrates 1C–E would have some intrasite character, which is not shown. Furthermore, the low concentrations of DNA do not support the functional oligomerization of Dam (15). To further explore how flanking nonspecific DNA affects the observed methylation rates and intrasite processivity, a competition experiment was done using substrate 1A and the same amount (in molecules) of a 500-bp piece of nonspecific DNA (Fig. 5). Substrate 1A retained intrasite processivity, confirming that the nonspecific DNA needs to be flanking the site to be inhibitory. Additionally, the observed rate constant decreases significantly (kchem is 0.011 ± 0.001 min−1) in comparison with when no competitor DNA is present. This outcome suggests that Dam spends an appreciable amount of time on the nonspecific DNA. If Dam has no affinity for nonspecific DNA, then the addition of competitor DNA would be predicted to have no effect on the rate of methylation (see “Discussion”).
FIGURE 5.
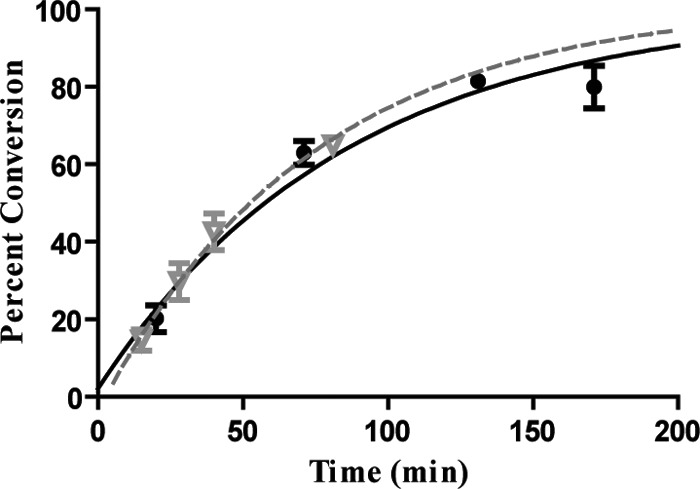
Competition experiment with nonspecific DNA. The tritium data (closed circle) and DpnI data (inverted gray triangle) for substrate 1B with a 500-bp piece of chase DNA included are shown. Single exponential fits for tritium and Dpn1 are a black line and a dashed gray line, respectively. kchem for the reaction is 0.011 ± 0.001 min−1. Error bars represent between 2 and 5 replicates, mean ± S.D.
Mutant Single Turnover Results
Our previously characterized Dam mutants are disrupted at the interface between Dam and DNA outside of the GATC site; these mutants uniformly show decreases in methylation rate constants and in intersite processivity (29). The latter result implies that disruption of this interface challenged the ability of Dam to move on DNA. The movement of Dam on DNA, including its transition from specific to nonspecific sites and its ability to switch strands, is a fundamental aspect of intrasite processivity. Therefore, we explored the potential for intrasite processivity for each mutant (Fig. 6). All but one mutant shows intrasite processivity on a short synthetic oligonucleotide with preferred flanks; N126A, the mutant with the largest reduction in methylation, was shown to undergo a sequential reaction scheme. This finding shows that a single DNA-contacting residue can disrupt intrasite processivity and provides insight for WT the intrasite processive mechanism of Dam (see “Discussion”).
DISCUSSION
The mechanism whereby epigenetically controlled operons switch methylation states to facilitate bacterial gene regulation remains elusive (Fig. 1). Although several rounds of replication are necessary for the transition from doubly methylated to unmethylated sites (no E. coli adenine demethylase has been identified), the opposite transition may have no restrictions. Intrasite processivity could be a way for unmethylated sites to be fully methylated in one round of replication because there are very low levels of Dam in the cell (30), allowing the cell to respond more efficiently to external stimuli. The unmethylated GATC sites known and speculated to be involved in epigenetic gene regulation all have unique contextual properties in comparison with the overwhelming majority of GATC sites that are involved in the mismatch repair system. In this study, we show that intrasite processivity is dependent on the context of the GATC sites, providing a basis for the modulation of Dam activity at particular genomic locations. The mechanistic effects of the clustering of methylation sites seen here may be related to a broader biological paradigm. For example, methylation sites in promoters modified by the human de novo DNA methyltransferase human de novo DNA methyltransferase 3A are overrepresented by 5-fold in CpG islands (31). This clustering, along with flanking sequence preferences, modulates the processivity of human de novo DNA methyltransferase 3A (32).
Our data show that when presented with DNA that is hundreds of base pairs in length, Dam carries out double methylation of an unmethylated site only in the presence of another site, less than 400 bp away. This, along with the activity of other highly regulated DNA-binding proteins, provides insight into potential mechanisms of epigenetic gene regulation. Under our experimental conditions, intrasite processivity is facilitated by other sites as far away as ∼400 bp, which is much more than necessary to accommodate the separation of ∼10–100 bp observed at genomic regions undergoing epigenetic regulation (see the Introduction). However, under physiological conditions (salt, molecular crowding, etc.), the ability of Dam to stay associated to DNA between sites may be hindered.
To doubly methylate DNA, Dam must both switch strands and flip its orientation (Fig. 2). Two potential mechanisms seem plausible: (i) the enzyme dissociates and reassociates directly at the GATC site as it switches strands, and (ii) the enzyme dissociates to the DNA flanking the GATC site as it switches strands (Fig. 7). Mechanism i involves a partitioning between direct reorientation and movement onto adjacent nonspecific DNA. Importantly, for mechanism i, this movement to nonspecific DNA is not an intermediate for intrasite processivity. In contrast, mechanism ii proposes an indirect reorientation process with an obligate binding to adjacent nonspecific DNA to achieve intrasite processivity. Three independent lines of evidence support mechanism ii. First, the observed methylation rate constant decreases with increasing DNA, as does the extent of the reaction. This is inconsistent with mechanism i, even if the enzyme moving to a flanking DNA segment is in competition with the direct dissociation and reassociation mechanism. In other words, mechanism i predicts a decrease in the asymptote but not in the rate constant for intrasite methylation. Second, intrasite processivity is salt-dependent, where greater than ∼150 mm NaCl inhibits the enzyme from methylating both strands at once (15). A salt dependence in processivity is consistent with hopping (25) due to the effect on binding and dissociation. Therefore, Dam most likely uses hopping to accomplish intrasite processivity. Although the precise nature of hopping has not been defined for any protein, it involves some dissociation of the enzyme from the DNA, which results largely in the reassociation to the same DNA, but at sites removed from the originally bound site. Hopping has been estimated to account for protein “jumps” as far as 100 bp of DNA (33). The reassociation for intrasite processivity, therefore, will most likely be at a nonspecific site.
FIGURE 7.
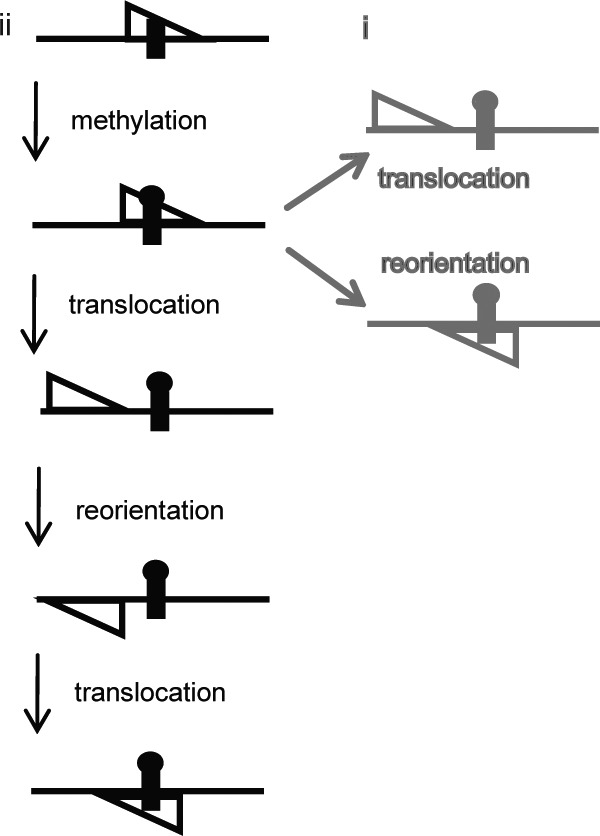
Potential models of intrasite processivity and its regulation. The direct mechanism (mechanism i, under “Discussion”) is depicted in gray. The indirect mechanism (mechanism ii, under “Discussion”), where intrasite processivity proceeds by an intermediate with flanking DNA, is shown in black. Notably, the translocation step in mechanism i represents a loss of intrasite processivity. For mechanism i, the observed rate of the reaction and the occurrence of intrasite processivity would not be predicted to change with increases of flanking DNA.
Third, our observation that intrasite processivity is lost when only one side of the GATC site has flanking DNA beyond 400 bp suggests that the enzyme samples both sides of the GATC site in its path toward intrasite methylation, further arguing that Dam binds to nonspecific flanking DNA when carrying out intrasite processive catalysis. If this were not the case, one would expect that intrasite processivity would be decreased only if both sides have flanks longer than ∼400 bp, which we do not observe. In other words, Dam must traverse the single GATC site at least once when first moving in the direction of the shorter segment (115 bp) to display a complete loss of intrasite processivity. Furthermore, our interpretation of the mechanism of intrasite processivity, namely the role of flanking DNA, was similarly proposed by Siksnys and co-workers (17) for the intrasite processive BcnI restriction endonuclease (see the Introduction).
The ability of an adjacent Dam recognition site to reinstate intrasite processivity on DNA with large flanking sequences is at first difficult to understand (Fig. 8). However, others have demonstrated that the lifetime of a protein on a segment of DNA is enhanced when multiple recognition sites are placed within certain distances (34). Longer retention of the protein on the DNA results from the protein translocating to the tight binding sites. We hypothesize that by providing Dam these adjacent recognition sites, the enzyme has greater opportunity to return to the original site and carry out intrasite processive catalysis.
FIGURE 8.
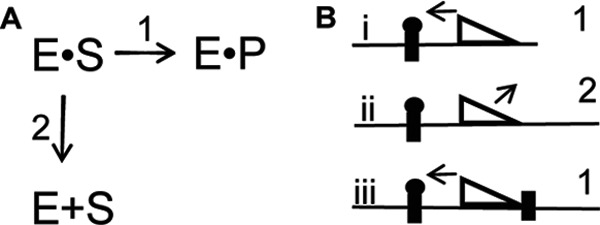
How flanking DNA regulates intrasite processivity. A, E is Dam, S is hemimethylated DNA, and P is fully methylated DNA. Shown is a schematic depicting the possible outcomes following the initial methylation of a GATC site. Either the enzyme will undergo intrasite processivity (scheme 1), or the enzyme will leave the hemimethylated substrate (scheme 2). B, the type of substrate dictates which mechanism occurs from A (scheme 1 or scheme 2). In i, the enzyme stays associated with the DNA long enough to remethylate it. However, in ii, the enzyme leaves the DNA because it spends too much time on the nonspecific DNA away from its GATC site, forcing scheme 2. In iii, the second GATC site allows Dam to spend longer on the DNA, pushing the reaction toward scheme 1.
Dam alanine mutations made to phosphate-contacting residues adjacent to the recognition site showed the interesting result of decreased methylation and intersite processivity, but Kd dissociation constants that remained similar to WT (29). Here, we show that N126A Dam, the mutant with the most severely decreased methylation and intersite processivity, is the only mutant incapable of carrying out intrasite processivity (Fig. 6). Our previous explanation for why the processivity of N126A and the other Dam mutants is decreased invoked the decreased methylation rate at the second site (29). This is most likely occurring with N126A during intrasite processivity as well. Thus, the slower methylation combined with the unchanged affinity should result in decreased intrasite processive methylation. What is intriguing is that all of the originally studied Dam mutants showed some decrease in intersite processivity, whereas the most severely impacted mutant (N126A) shows changes in intrasite processivity. This may derive from the use of preferred and nonpreferred flanking sequences for the prior intersite study (29), whereas here the single site has a preferred flanking sequence. The modeling results (supplemental Fig. 3) suggest that our assay for intrasite processivity is extremely responsive to small changes in the relative values of the two methylation events, whereas the assay for intersite processivity is less responsive.3
Supplementary Material
Acknowledgment
We thank Stephanie Coffin for providing purified Dam mutants and helpful discussions.

This article contains supplemental Materials and Methods, Table 1, and Figs. 1–4.
A. J. Pollak and N. O. Reich, unpublished results.
- Dam
- DNA adenine methyltransferase.
REFERENCES
- 1. Herman G. E., Modrich P. (1982) Escherichia coli dam methylase: physical and catalytic properties of the homogeneous enzyme. J. Biol. Chem. 257, 2605–2612 [PubMed] [Google Scholar]
- 2. Wion D., Casadesús J. (2006) N6-methyl-adenine: an epigenetic signal for DNA-protein interactions. Nat. Rev. Microbiol. 4, 183–192 [DOI] [PMC free article] [PubMed] [Google Scholar]
- 3. Marinus M. G., Casadesus J. (2009) Roles of DNA adenine methylation in host-pathogen interactions: mismatch repair, transcriptional regulation, and more. FEMS Microbiol. Rev. 33, 488–503 [DOI] [PMC free article] [PubMed] [Google Scholar]
- 4. Touzain F., Petit M. A., Schbath S., El Karoui M. (2011) DNA motifs that sculpt the bacterial chromosome. Nat. Rev. Microbiol. 9, 15–26 [DOI] [PubMed] [Google Scholar]
- 5. Broadbent S. E., Davies M. R., van der Woude M. W. (2010) Phase variation controls expression of Salmonella lipopolysaccharide modification genes by a DNA methylation-dependent mechanism. Mol. Microbiol. 77, 337–353 [DOI] [PMC free article] [PubMed] [Google Scholar]
- 6. Casadesús J., Low D. (2006) Epigenetic gene regulation in the bacterial world. Microbiol. Mol. Biol. Rev. 70, 830–856 [DOI] [PMC free article] [PubMed] [Google Scholar]
- 7. Løbner-Olesen A., Skovgaard O., Marinus M. G. (2005) Dam methylation: coordinating cellular processes. Curr. Opin. Microbiol. 8, 154–160 [DOI] [PubMed] [Google Scholar]
- 8. Ringquist S., Smith C. L. (1992) The Escherichia coli chromosome contains specific, unmethylated dam and dcm sites. Proc. Natl. Acad. Sci. U.S.A. 89, 4539–4543 [DOI] [PMC free article] [PubMed] [Google Scholar]
- 9. Tavazoie S., Church G. M. (1998) Quantitative whole-genome analysis of DNA-protein interactions by in vivo methylase protection in E. coli. Nat. Biotechnol. 16, 566–571 [DOI] [PubMed] [Google Scholar]
- 10. Hernday A. D., Braaten B. A., Low D. A. (2003) The mechanism by which DNA adenine methylase and PapI activate the pap epigenetic switch. Mol. Cell 12, 947–957 [DOI] [PubMed] [Google Scholar]
- 11. Kaminska R., van der Woude M. W. (2010) Establishing and maintaining sequestration of Dam target sites for phase variation of agn43 in Escherichia coli. J. Bacteriol. 192, 1937–1945 [DOI] [PMC free article] [PubMed] [Google Scholar]
- 12. Coffin S. R., Reich N. O. (2008) Modulation of Escherichia coli DNA methyltransferase activity by biologically derived GATC-flanking sequences. J. Biol. Chem. 283, 20106–20116 [DOI] [PMC free article] [PubMed] [Google Scholar]
- 13. Peterson S. N., Reich N. O. (2006) GATC flanking sequences regulate Dam activity: evidence for how Dam specificity may influence pap expression. J. Mol. Biol. 355, 459–472 [DOI] [PubMed] [Google Scholar]
- 14. van der Woude M. W. (2011) Phase variation: how to create and coordinate population diversity. Curr. Opin. Microbiol. 14, 205–211 [DOI] [PubMed] [Google Scholar]
- 15. Coffin S. R., Reich N. O. (2009) Escherichia coli DNA adenine methyltransferase: intrasite processivity and substrate-induced dimerization and activation. Biochemistry 48, 7399–7410 [DOI] [PubMed] [Google Scholar]
- 16. Sasnauskas G., Zakrys L., Zaremba M., Cosstick R., Gaynor J. W., Halford S. E., Siksnys V. (2010) A novel mechanism for the scission of double-stranded DNA: BfiI cuts both 3′-5′ and 5′-3′ strands by rotating a single active site. Nucleic Acids Res. 38, 2399–2410 [DOI] [PMC free article] [PubMed] [Google Scholar]
- 17. Sasnauskas G., Kostiuk G., Tamulaitis G., Siksnys V. (2011) Target site cleavage by the monomeric restriction enzyme BcnI requires translocation to a random DNA sequence and a switch in enzyme orientation. Nucleic Acids Res. 39, 8844–8856 [DOI] [PMC free article] [PubMed] [Google Scholar]
- 18. Halford S. E., Marko J. F. (2004) How do site-specific DNA-binding proteins find their targets? Nucleic Acids Res. 32, 3040–3052 [DOI] [PMC free article] [PubMed] [Google Scholar]
- 19. Stanford N. P., Szczelkun M. D., Marko J. F., Halford S. E. (2000) One- and three-dimensional pathways for proteins to reach specific DNA sites. EMBO J. 19, 6546–6557 [DOI] [PMC free article] [PubMed] [Google Scholar]
- 20. Tafvizi A., Mirny L. A., van Oijen A. M. (2011) Dancing on DNA: kinetic aspects of search processes on DNA. Chem. Phys. Chem. 12, 1481–1489 [DOI] [PMC free article] [PubMed] [Google Scholar]
- 21. Vuzman D., Azia A., Levy Y. (2010) Searching DNA via a “Monkey Bar” mechanism: the significance of disordered tails. J. Mol. Biol. 396, 674–684 [DOI] [PubMed] [Google Scholar]
- 22. Zhou H. X. (2011) Rapid search for specific sites on DNA through conformational switch of nonspecifically bound proteins. Proc. Natl. Acad. Sci. U.S.A. 108, 8651–8656 [DOI] [PMC free article] [PubMed] [Google Scholar]
- 23. Zinoviev V. V., Evdokimov A. A., Malygin E. G., Sclavi B., Buckle M., Hattman S. (2007) Differential methylation kinetics of individual target site strands by T4 Dam DNA methyltransferase. Biol. Chem. 388, 1199–1207 [DOI] [PubMed] [Google Scholar]
- 24. Porecha R. H., Stivers J. T. (2008) Uracil DNA glycosylase uses DNA hopping and short-range sliding to trap extrahelical uracils. Proc. Natl. Acad. Sci. U.S.A. 105, 10791–10796 [DOI] [PMC free article] [PubMed] [Google Scholar]
- 25. Hedglin M., O'Brien P. J. (2010) Hopping enables a DNA repair glycosylase to search both strands and bypass a bound protein. ACS Chem. Biol. 5, 427–436 [DOI] [PMC free article] [PubMed] [Google Scholar]
- 26. Gowers D. M., Wilson G. G., Halford S. E. (2005) Measurement of the contributions of one-dimensional and three-dimensional pathways to the translocation of a protein along DNA. Proc. Natl. Acad. Sci. U.S.A. 102, 15883–15888 [DOI] [PMC free article] [PubMed] [Google Scholar]
- 27. Mashhoon N., Carroll M., Pruss C., Eberhard J., Ishikawa S., Estabrook R. A., Reich N. (2004) Functional characterization of Escherichia coli DNA adenine methyltransferase, a novel target for antibiotics. J. Biol. Chem. 279, 52075–52081 [DOI] [PubMed] [Google Scholar]
- 28. Fersht A. (1998) Structure and Mechanism in Protein Science, pp. 143–145, W. H. Freeman, New York [Google Scholar]
- 29. Coffin S. R., Reich N. O. (2009) Escherichia coli DNA adenine methyltransferase: the structural basis of processive catalysis and indirect read-out. J. Biol. Chem. 284, 18390–18400 [DOI] [PMC free article] [PubMed] [Google Scholar]
- 30. Boye E., Marinus M. G., Løbner-Olesen A., (1992) Quantitation of Dam methyltransferase in Escherichia coli. J. Bacteriol. 174, 1682–1685 [DOI] [PMC free article] [PubMed] [Google Scholar]
- 31. Handa V., Jeltsch A. (2005) Profound flanking sequence preference of Dnmt3a and Dnmt3b mammalian DNA methyltransferases shape the human epigenome. J. Mol. Biol. 348, 1103–1112 [DOI] [PubMed] [Google Scholar]
- 32. Wienholz B. L., Kareta M. S., Moarefi A. H., Gordon C. A., Ginno P. A., Chédin F. (2010) DNMT3L modulates significant and distinct flanking sequence preference for DNA methylation by DNMT3A and DNMT3B in vivo. PLoS Genet. 6, e101106. [DOI] [PMC free article] [PubMed] [Google Scholar]
- 33. Halford S. E. (2009) An end to 40 years of mistakes in DNA-protein association kinetics? Biochem. Soc. Trans. 37, 343–348 [DOI] [PubMed] [Google Scholar]
- 34. Rau D. C., Sidorova N. Y. (2010) Diffusion of the restriction nuclease EcoRI along DNA. J. Mol. Biol. 395, 408–416 [DOI] [PMC free article] [PubMed] [Google Scholar]
Associated Data
This section collects any data citations, data availability statements, or supplementary materials included in this article.