

Background: Hexokinase 2 (HK2) is frequently overexpressed in malignant tumors.
Results: miR-143 down-regulates HK2 and inhibits glucose metabolism and cancer progression.
Conclusion: miR-143 is an essential regulator of cancer glycolysis via targeting HK2.
Significance: Discovering the important role of miRNA in cancer metabolism may provide potential targets for cancer therapy.
Keywords: Glycolysis, Hexokinase, Lung Cancer, MicroRNA, mTOR, Warburg Effect, gNET, miR-143
Abstract
High glycolysis, well known as “Warburg effect,” is frequently observed in a variety of cancers. Whether the deregulation of miRNAs contributes to the Warburg effect remains largely unknown. Because miRNA regulates gene expression at both mRNA and protein levels, we constructed a gene functional association network, which allows us to detect the gene activity instead of gene expression, to integratively analyze the microarray data for gene expression and miRNA expression profiling and identify glycolysis-related gene-miRNA pairs deregulated in cancer. Hexokinase 2 (HK2), coding for the first rate-limiting enzyme of glycolysis, is among the top list of genes predicted and potentially regulated by multiple miRNAs including miR-143. Interestingly, miR-143 expression was inversely associated with HK2 protein level but not mRNA level in human lung cancer samples. miR-143, down-regulated by mammalian target of rapamycin activation, reduces glucose metabolism and inhibits cancer cell proliferation and tumor formation through targeting HK2. Collectively, we have not only established a novel methodology for gene-miRNA pair prediction but also identified miR-143 as an essential regulator of cancer glycolysis via targeting HK2.
Introduction
The “Warburg effect” described the unique metabolic phenomenon that conversion of glucose into lactic acid is enhanced even in the presence of oxygen (1, 2). As compared with normal somatic cells, tumor cells preferentially utilize this far less efficient glycolytic process for energy production. The high rate of glycolysis commonly observed in cancers is presumably ascribed to up-regulation of key enzymes in glycolysis including hexokinase 2 (HK2),5 glyceraldehyde-3-phosphate dehydrogenase (GAPDH), 6-phosphofructo-1-kinase (PFK1) (3, 4). Hexokinases catalyze the first irreversible step of the glycolytic pathway where glucose is phosphorylated to glucose-6-phosphate with consumption of ATP (5). There are four important mammalian hexokinase isozymes designated HK1–4 that vary in subcellular locations and kinetics with respect to different substrates and conditions and physiological functions (6). HK2, the predominant isoform overexpressed in malignant tumors, is strategically bound to the outer mitochondrial membrane (2, 7). At this location, HK2 helps couple ATP formation in mitochondria to the phosphorylation of glucose, thus conferring cancer cells with a highly glycolytic phenotype and ample biosynthetic precursor (2, 8). In addition to its critical metabolic role, HK2 can also promote cancer by repressing mitochondrial function on cell death and helping immortalize cancer cells (2).
MicroRNAs (miRNAs) are a group of small endogenously noncoding RNAs. Mature miRNAs negatively regulate their target genes through imperfect complementary sequence pairing to the 3′-untranslated region (UTR) of target genes, resulting in either mRNA degradation or translational repression (9). miRNAs play critical regulatory roles in diverse biological processes including metabolism (10, 11) and tumorigenesis (12, 13). Recent studies have shown that the global alteration of miRNA expression is a hallmark of tumorigenesis and serves as a diagnosis and prognosis signature (14, 15). However, little is known about the role of miRNA in cancer metabolism, especially in the Warburg effect.
We have previously constructed a comprehensive gene functional association network, gNET, by integration of datasets including protein-protein interactions, gene co-annotations, and gene co-expressions, which were successfully applied to the development of a novel Gene Association Network-based Pathway Analysis (GANPA) (16). Here we have taken advantage of the gNET and applied it to the prediction of deregulated gene-miRNA pairs via calculation of gene activity. We have identified the HK2-miR-143 as one of the most significantly deregulated pairs involved in cancer glycolysis process. Moreover, we have also identified another novel connection between mTOR activation and miR-143 in regulation of HK2 gene expression.
EXPERIMENTAL PROCEDURES
Prediction of Candidate miRNA-Gene Pairs Deregulated in Cancer Glycolysis
Raw data of miRNA expression in lung cancer was downloaded from ArrayExpress, under accession number E-TABM-22 (141 lung cancers and 104 normal lung tissues). After background correction, log 2 transformation, and quantile normalization (17), miRNA expression changes in lung cancers as compared with normal lungs were measured with two-sample Student's t test statistics, which were standardized to Z statistics with mean of 0 and S.D. of 1, designated as Z(M).
Two lung cancer gene expression microarray data sets, GSE7670 (27 lung cancers and 27 normals) (18) and GSE10072 (58 lung cancers and 49 normals) (19), were downloaded from the National Center for Biotechnology Information (NCBI) Gene Expression Omnibus (GEO) (www.ncbi.nlm.nih.gov/geo). Raw data were preprocessed with updated probe set definitions (20) using the robust multiarray average algorithm (17, 21, 22). Student's t test statistics measuring gene expression changes were then standardized to Z statistics, designated as Z(G) for any measured gene G.
To match miRNA expression and target gene regulation in lung caners, we designed a “gene activity change measure” that determines whether a gene is functionally activated or inhibited by taking into account expression changes of both itself and its neighbor genes from a gNET, with the notion that mammalian miRNAs also regulate target genes in a translational repression mechanism, probably without obvious mRNA decay and beyond detection capability of mRNA microarrays.
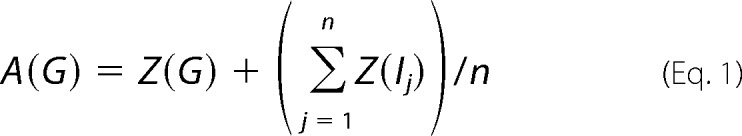 |
Here A(G) is the activity measure of any glycolytic gene G, Z(G) is Z statistic measuring expression changes of G, n is the number of genes associated with G in gNET, and Z(Ij) is the Z statistic of the ith functionally associated gene. The glycolytic genes were each with an n larger than 10, providing that the averaged expression of these associated genes are likely to be stable.
To rank the potential involvement of miRNA-target pairs in lung cancers, we derived conserved miRNA target information from TargetScan (Release 5.1) (23) and scored each miRNA-gene pair with
Here S(MG) is the score for a pair of miRNA M and any of its predicted conserved target gene G. Z(M) is the Z statistic of expression changes of M, and A(G) is the activity measure of G, with −1 to adjust the direction of gene activity changes to its miRNA regulator. A stronger positive (negative) value suggests a higher possibility of up (down)-regulation of miRNA and down (up)-regulation of its paired gene in lung cancer.
Mouse Treatment
Lung cancer mouse models (both KrasG12D and CC10-rtTA, Tetop-EGFR-TL) were described previously (24, 25). All mice were housed in a specific pathogen-free environment at Shanghai Institute of Biochemistry and Cell Biology and treated in strict accordance with protocols approved by the Institutional Animal Use Committee of the Shanghai Institutes for Biological Sciences, Chinese Academy of Sciences.
Immunohistochemical Staining
Mouse lung tumor tissues were paraffin-embedded and sectioned at 5 μm. The sections were heat-immobilized, deparaffinized by xylene, rehydrated in a graded series of ethanol, and washed with distilled water. For antigen unmasking, the tumor sections were boiled in 10 mm sodium citrate buffer (pH 6.0) for 7 min and cooled to room temperature. After washing with TBST (Tris-buffered saline containing 0.1% Tween 20), endogenous peroxidase activity was blocked by incubation in 3% H2O2 in methanol for 10 min at room temperature. Then the sections were stained with antibodies for HK2, which was 1:25 diluted in antibody dilution buffer, using avidin-biotin complex and diaminobenzidine kits according to the manufacturers' protocols and counterstained with Mayer's hematoxylin solution. High power fields (×400) were photographed under an Eclipse 80i (Nikon, Tokyo, Japan) microscope.
Cell Culture
HEK-293T and BEAS-2B cells were cultured in DMEM with 10% FBS. CRL-5807, CRL-5803, and L574 cells were cultured in RPMI 1640 with 5% FBS. Cell transfection was done using Fugene HD (Roche Applied Science) according to the manufacturer's protocols.
Luciferase Reporter Assay
To construct luciferase reporter plasmids, the 3′-UTR of HK2 was amplified with primers 5′-ACTAGCTAGCAACCCCTGAAATCGGAAGG-3′ and 5′-ACTAGCTAGCAGTTAACATCACATAGTTAA-3′. The DNA fragment was cloned into the pRL-SV40 vector (Promega) using the XbaI site, and the resulting plasmid was termed pRL-SV40-HK2-3′-UTR. Five nucleotides corresponding to either miR-125a/b or miR-143 seed sequences were mutated in pRL-SV40-HK2-3′-UTR, termed as pRL-SV40-HK2-3′-UTR-Mut-1 and pRL-SV40-HK2-3′-UTR-Mut-2, respectively. The miR-125a/b and miR-143 expression vector pSIF-copGFP-miR-125a/b/143 was derived from the vector pSIF-copGFP (System Biosciences). To construct the HK2 expression plasmid, the coding sequence of HK2 was amplified with primers 5′-CAGGAATTCGGCCGCGGCAGGATGATTG-3′ and 5′-TTAGGATCCGTTCTATCGCTGTCCAGCCTC-3′. The DNA fragment was cloned into the pCDH-CMV-MCS-EF1-puro vector (System Biosciences). Each reporter construct was co-transfected into HEK-293T cells in 24-well plates together with pSIF-copGFP-miR-125a/b or -miR-143 or control vector pSIF-copGFP. Firefly luciferase plasmid pGL3-control (Promega) was used as internal control. The cells were harvested for assessment of luciferase activity at 36 h after transfection. The luciferase activity was measured with Dual-Luciferase reporter assay system (Promega) and normalized to pGL3-control.
Immunofluorescence
Cells were washed with 1× PBS after 48 h of transfection and then fixed with 4% paraformaldehyde and permeabilized with 0.5% Triton X-100 in 1× PBS. Rabbit anti-HK2 (Cell Signaling) was used as primary antibody, and Alexa Fluor® 555 donkey anti-rabbit IgG (Invitrogen) was used as secondary antibody to visualize HK2. Nuclei were stained with DAPI.
Western Blot Analysis
Cells were harvested for Western blotting 48 h after transfection. Protein samples were probed with HK2, phospho-S6 (Cell Signaling), or β-actin (Sigma) monoclonal antibody. Protein expression was assessed by Pierce® ECL Western blotting substrate (Thermo Scientific) and exposed to x-ray film (Eastman Kodak Co.). The film was scanned, and the digitalized images were quantified by densitometry.
MTT and Soft Agar Colony Formation Assay
Cells were seeded on 96-well plates after 48 h of viral infection, and the MTT assay was performed daily for 5 days. For soft agar assay, 5000 virus-infected cells were plated in 0.4% top agarose on top of 1% agarose base supplemented with complete medium in 6-well plates. After 2 weeks, cells were stained with 0.005% crystal violet, and colonies (>1 mm in diameter) were counted. All experiments were performed in triplicate.
RNA Extraction and Real-time PCR Quantification
Total RNA was extracted from either cells or tissues with Trizol® reagent (Invitrogen). Quantification of miRNA was performed by stem-loop real-time PCR as described previously (26). The level of HK2 mRNA was determined with the QuantiFast SYBR Green RT-PCR kit (TOYOBO, Osaka, Japan). U6 snRNA and GAPDH mRNA were used as internal references to calculate miRNA and mRNA expression, respectively. The real-time PCR results were analyzed and expressed as relative miRNA or mRNA expression of CT (threshold cycle) value, which was then converted to -fold changes.
Glucose Consumption, Glc-6-P, and Lactate Production
Virus-infected cells were seeded on a 12-well plate at a density of 1 × 10⁵ per well, and the culture medium was changed to DMEM with low glucose (Invitrogen) 6 h later. The concentrations of glucose, glucose 6-phosphate (Glc-6-P), and l-lactate were measured after another 24 h with a glucose test kit (Applygen Technologies, Beijing, China), glucose-6-phosphate assay kit (BioVision), and l-lactate assay kit (Eton Bioscience) individually.
Xenograft in Nude Mice
For miRNA functional study, CRL-5807 cells expressing miR-143 or control were subcutaneously transplanted into either side of nude mice (n = 6). For HK2 rescue assay, CRL-5807 cells expressing either miR-143 or miR-143 with HK2 were subcutaneously transplanted into either side of nude mice (n = 6). Tumor volume was monitored twice a week, and mice were sacrificed 8 weeks later for tumor weight analysis and pathological inspection.
Specimen Collection
This study was approved by the Institutional Review Board of the Fudan University Shanghai Cancer Center, Shanghai, China. All participants gave written informed consent. In brief, the 39 lung tumor specimens with paired pathological normal lungs were collected from July 2009 to June 2010, and the detailed information was shown in supplemental Table S1.
Statistical Analysis
Statistical significance was analyzed by Student's t test and expressed as a p value.
RESULTS
Establishment of Algorithm for Prediction of Deregulated Glycolytic Gene-miRNA Pairs in Lung Cancer
To test the hypothesis that miRNA is involved in glucose metabolism in cancer, we integratively analyzed the miRNA and gene expression profiling in lung cancer. Because miRNA regulates target genes at both the mRNA and the protein levels (12, 27, 29, 30), traditional methods simply using gene expression value for gene-miRNA pair prediction may fail to pick up those genes with mainly protein level changes. To overcome this problem, we have taken advantage of the gNET previously established based on protein-protein interactions, co-annotations, and gene co-expressions and assigned a gene with an activity measure dependent on the expression level of its functional associated genes (16). We then integrated this method with TargetScan to identify gene-miRNA pairs significantly deregulated in cancer glycolysis (Fig. 1A). Among the scores of miRNA-gene pairs, a strong positive (negative) value suggests a high possibility of up (down)-regulation of miRNA and down (up)-regulation of its paired gene (supplemental Table S2). Interestingly, HK2, coding for the enzyme that catalyzes the first irreversible step of the glycolytic pathway (5), is one of the top genes predicted to be targeted by multiple miRNAs.
FIGURE 1.

The regulation of HK2 by miR-125a/b and miR-143. A, a schematic diagram of the strategy to predict candidate gene-miRNA pairs deregulated in cancer glycolysis. B and C, immunohistochemical staining (B) and Western blot analysis (C) of HK2 protein level in mice KrasG12D (Kras) lung tumors and normal lungs. D and E, reporter gene assay using HK2 3′-UTR region with either miR-125a/b binding site mutated (D) or miR-143 binding site mutated (E) after ectopic expression of the indicated miRNAs. F, real-time PCR quantification of miR-125a/b and miR-143 expression in mice KrasG12D lung tumors and normal lungs. All data are shown as mean ± S.E. *, p < 0.05, **, p < 0.01 and ***, p < 0.001.
miR-125a/b and miR-143 Target HK2
Hexokinase 2 plays essential roles in tumor growth, survival, and metastasis (31). Consistent with the Warburg effect, mouse lung tumors driven by either KrasG12D or epidermal growth factor receptor (EGFR) mutant (T790M_L858R) (24, 25) have a much higher expression of HK2 in comparison with normal lungs (Fig. 1, B and C, and supplemental Fig. S1, A and B). To validate whether five candidate miRNAs (let-7, miR-143, miR-9, miR-125a, and miR-125b) actually regulate HK2 expression, the reporter plasmid in which full-length 3′-UTR of HK2 was placed downstream of Renilla luciferase gene was constructed for reporter gene assays. In contrast to let-7a and miR-9, ectopic expression of miR-125a, miR-125b, or miR-143 resulted in a significant reduction of reporter activity as well as endogenous HK2 level in 293T cells (supplemental Fig. S1, D and E). Mutations in the targeting sites of miR-125a/b or miR-143, which are conserved across species including human, chimpanzee, horse, mouse, and rat, remarkably abolished the inhibitory effects of these miRNAs (supplemental Fig. S1C and Fig. 1, D and E), indicating that miR-125a/b and miR-143 could regulate HK2 expression via targeting the 3′-UTR of HK2. We further quantified miR-125a/b and miR-143 levels in mouse lung tumors by real-time PCR. Interestingly, the miRNA-125b and miR-143 levels were significantly lower in tumors in comparison with normal lungs (Fig. 1F and supplemental Fig. S1F), implying the potential down-regulation of Hk2 by miR-125a/b and miR-143.
We next investigated the regulation of HK2 expression by the miRNAs in lung cancer cell lines and normal bronchial epithelial cells (supplemental Fig. S2). Western blot analyses revealed that overexpression of miR-125a/b or miR-143 down-regulates HK2 protein level (Fig. 2A). Consistently, immunofluorescence data showed a clear suppression of endogenous HK2 in cells with ectopic miRNA expression (Fig. 2B). Similar observation was obtained in mouse lung cancer cell line L574 (p53−/−, KrasG12D) (supplemental Fig. S3A). Conversely, transfection of antisense inhibitors of miRNAs into human bronchial epithelial cells BEAS-2B resulted in an elevation of endogenous HK2 expression (Fig. 2, C and D). Besides, the regulation of HK2 by miR-143 was also validated in other cancer types, such as colorectal adenocarcinoma, glioma, and hepatocellular carcinoma, suggesting a common mechanism of miRNA-143 targeting HK2 (supplemental Fig. S3B). Taken together, these findings have convincingly demonstrated that miR-125a/b or miR-143 down-regulates endogenous HK2 expression.
FIGURE 2.

miR-125a/b and miR-143 suppress endogenous HK2 expression in lung cancer cell lines. A, Western blot analysis of HK2 after various miRNA transfection in CRL-5807 (left panel) and CRL-5803 (right panel). B, immunofluorescence detection of HK2 expression after transfection of the indicated miRNAs in CRL-5807 (left panels, scale bar, 50 μm) and CRL-5803 (right panels, scale bar, 20 μm). HK2 is indicated by red. Transfected cells are indicated by GFP-positive (green). C and D, Western blot (C) and immunofluorescence (D) analyses of HK2 expression following anti-miRNA transfection in BEAS-2B cells. Scale bar, 10 μm.
miR-143 Inhibits Non-Small Cell Lung Cancer Cell Glycolysis, Proliferation, and Tumorigenesis via Targeting HK2
Because the miR-143-HK2 pair gets the highest score among the three miRNAs and because miR-143 shows consistent results in assays performed in both human and mouse lung cancer cell lines, we then focused on miR-143 in the following functional studies. Considering the important role of HK2 in cancer metabolism, we first investigated the biological function of miR-143 in cancer glycolysis and progression. Ectopic expression of miR-143 in human lung cancer cells CRL-5803 efficiently reduced glucose consumption and Glc-6-P and l-lactate production (Fig. 3, A–C). Consistent with the effect of miR-143 in reducing glucose metabolism of cancer cells, miR-143 overexpression significantly inhibited CRL-5803 and CRL-5807 cell proliferation and colony formation in soft agar (Fig. 3, D and E, and supplemental Fig. S4, A–C). Furthermore, tumor growth of xenografts derived from CRL-5803 and CRL-5807 cells was significantly inhibited by ectopic miR-143 expression (Fig. 3F, supplemental Figs. S4, D–F, and S5, A and B).
FIGURE 3.

miR-143 inhibits lung cancer cell glycolysis, proliferation, and tumorigenesis via HK2 down-regulation. A–C, detection of glucose consumption (A), Glc-6-P (B), and l-lactate production (C) in CRL-5803 cells with only miR-143 overexpression or with HK2 reintroduction after miR-143 overexpression. ctrl, control; G6P, Glc-6-P. D–F, cell growth assay (D), soft agar colony formation assay (E), and tumor formation in xenografts (F) of lung cancer cells CRL-5807 with or without miR-143 ectopic expression. G–I, cell growth assay (G), soft agar colony formation assay (H), and tumor formation in xenografts (I) after reintroduction of HK2 into CRL-5807 cells with miR-143 expression. *, p < 0.05, **, p < 0.01 and ***, p < 0.001.
To further demonstrate the repression of HK2 by miR-143 in a physiological context, we detected the effect of HK2 shRNA and showed that knockdown of HK2 in CRL-5807 cells significantly diminished cell proliferation rate and colony-forming ability, which was accompanied with decrease of glucose consumption (supplemental Fig. S6), indicating that RNAi-mediated silencing of HK2 phenocopied the effect of miR-143 on cancer cell glycolysis and proliferation. More importantly, expression of HK2 restored glucose consumption reduction and inhibition of proliferation and decreased tumor formation induced by miR-143 (Fig. 3, A–C and G–I, supplemental Fig. S5, C and D). Similar results were also observed in mouse lung cancer cell line L574 (supplemental Fig. S7).
Additionally, we performed loss-of-function analyses of miR-143 with miRNA sponge to competitively inhibit endogenous miRNA function. miR-143 sponge expression effectively increased HK2 expression and glucose utilization and promoted cell proliferation and colony formation in soft agar of CRL-5803 cells, which could be reverted by HK2 knockdown, indicating that the effect of the miR-143 sponge was mediated through HK2 (supplemental Fig. S8). In conclusion, these results have demonstrated that miR-143 inhibits cancer cell glycolysis, proliferation, and tumorigenesis via HK2 down-regulation.
miR-143 Was Inversely Associated with HK2 Protein Level in Human Lung Cancer Samples
We further sought to address the significance of HK2 repression by miRNAs in human lung cancer. We detected the mRNA and protein level of HK2 and also the expression of miR-125a/b and miR-143 in 39 lung tumor specimens with paired pathological normal lungs (Fig. 4, A and B, and supplemental Fig. S9A). Although some lung tumors showed lower HK2 expression or higher miRNA expression, a majority of lung tumor specimens (31 of 39) with a higher HK2 expression did have low expression of miRNAs (Fig. 4, A and B). Statistical analysis confirmed the significant inverse correlation between the miRNA expression and HK2 protein levels in the paired samples (Fig. 4C, miR-125a, R = −0.4114, p = 0.0093; miR-125b, R = −0.5148, p = 0.0008; miR-143, R = −0.4594, p = 0.0033). Intriguingly, we have observed no significant correlation between the miRNAs and HK2 mRNA level in these clinical samples (supplemental Fig. S9B, miR-125a, p = 0.8187; miR-125b, p = 0.22; miR-143, p = 0.1382), highlighting the power of our method in prediction of genes targeted by miRNAs at the protein level using miRNA and gene expression profiles.
FIGURE 4.

miR-143 was inversely associated with HK2 protein level in human lung cancer samples. A, detection of miR-125a/b and miR-143 levels by quantitative PCR. Values below zero indicate miRNAs with low expression in lung tumor tissue as compared with paired normal lung. B, Western blot analyses of HK2 levels in human lung cancer specimens with paired normal lungs. N, normal; T, tumor. C, statistical analysis of correlation between miR-125a/b/143 and HK2 protein level. HK2 protein level was divided into three groups (low, moderate, and high) according to the ratio of HK2 protein level in tumor to normal counterpart. Correlation coefficients (R) and p values were shown.
miR-143 Is Regulated by mTOR Signaling
To further explore the molecular mechanisms in the regulation of miRNA expression, we screened a series of pathway-specific inhibitors and found that mTOR inhibitors rapamycin and PP242 could distinctively up-regulate miRNA expression and down-regulate HK2 protein level simultaneously (Fig. 5, A and B). This regulation was further confirmed after treatment with short hairpin RNA (shRNA) targeting mTOR in CRL-5803 cells (supplemental Fig. S10). Given that the mTOR signaling pathway is often hyperactive in cancers (32, 33), we reasoned that mTOR activation may promote HK2 expression via down-regulating miR-143. To test this hypothesis, we performed the reporter gene assay and found that rapamycin significantly reduced the activity of reporter with wild-type HK2 3′-UTR but not that with mutated 3′-UTR (Fig. 5D). Furthermore, we detected the effect of miR-143 sponge after mTOR knockdown in CRL-5803 cells. Strikingly, HK2 down-regulation resulting from mTOR knockdown was partially rescued after miR-143 sponge expression (Fig. 5E). Taken together, we have identified an unexpected link between mTOR signaling and miR-143 in regulating the Warburg effect in cancer through HK2 (Fig. 5F).
FIGURE 5.

The mTOR signaling pathway participates in miR-143 regulation. A, detection of miRNA expression in CRL-5807 cells after treatment with different pathway-specific inhibitors: SB-203580 and SB-202190, p38 MAPK inhibitors; U0126, MEK inhibitor; rapamycin and PP242, mTOR inhibitors; LY-294002, PI3K inhibitor; triciribine and BML-257, Akt inhibitors; valproic acid (VPA), histone deacetylase inhibitors. B, Western blot analysis of HK2 after treatment with mTOR or Akt inhibitors. C, detection of miR-143 expression in CRL-5908 and CRL-5844 cells after treatment with rapamycin. D, reporter gene assay with the reporter plasmids carrying either wild-type or mutated HK2 3′-UTR with or without rapamycin treatment in CRL-5908 cells. *, p < 0.05 and **, p < 0.01. DMSO, dimethyl sulfoxide. E, measurement of HK2 and phospho-S6 expression with or without miR-143 sponge expressed in CRL-5803 cells after mTOR knockdown. F, a schematic diagram shows linking mTOR signaling to the miRNAs that participate in the Warburg effect in cancer via regulating HK2.
DISCUSSION
We have here developed a novel methodology for gene-miRNA pair prediction and uncovered an essential role of mTOR-miR-143 axis in the Warburg effect through regulation of HK2 expression. Classical methods for deregulated gene-miRNA pair prediction based on gene expression profiling have provided invaluable information and great help for biological research. However, there are still certain limitations in consideration of the diverse regulatory ways of miRNA toward target genes at mRNA or protein levels. Taking advantage of the gNET, we have successfully established a novel algorithm via calculation of gene activities and identified important genes involved in the Warburg effect even without significant changes at mRNA levels. Our data have shown that miR-125a/b and miR-143, previously reported to be lowly expressed in lung cancer (15), target endogenous HK2 and inhibit glucose metabolism, cell proliferation, and tumorigenesis. This was phenocopied by HK2 knockdown. Recent studies have also found similar results in head and neck squamous cell carcinoma and breast cancer, suggesting a common mechanism of miR-143 down-regulating HK2 (34, 35). Besides HK2, we have observed that another important enzyme in glycolytic process, like lactate dehydrogenase A, is regulated by miR-449a at the protein level (supplemental Fig. S11). Although further efforts are warranted for experimental confirmation, our findings highlight the importance of miRNAs in regulating cancer glycolysis.
Activation of mTOR pathway is frequently observed in cancer. Whether mTOR activation is involved in miRNA regulation remains largely unknown. A recent study has begun to uncover the potential role of mTOR activation in miRNA biogenesis in skeletal myogenesis (28). Our findings here are quite unexpected; after screening a series of pathway-specific inhibitors, we intriguingly found that mTOR was involved in regulation of miR-143 expression. This regulation was further supported and confirmed by reporter gene assay and rescue experiments. Although the detailed mechanisms involved in miR-143 regulation by mTOR signaling still remain to be further explored, our data hopefully improve current understanding of the regulatory network of cancer metabolism and provide potential targets for the development of cancer therapeutic strategies.
Supplementary Material
Acknowledgments
We thank Dr. Dangsheng Li, Boyi Gang for helpful comments and Dr. Yong Li, Ming Chen, Lei Zhu, and Minghua Lu for material contribution and technical support.
This work was supported by the National Basic Research Program of China (Grants 2010CB912102 and 2012CB910800), the National Natural Science Foundation of China (Grants 30971461 and 81101583), the Science and Technology Commission of Shanghai Municipality (Grant 09JC1416300), the Postdoctoral Research Program of Shanghai Institutes for Biological Sciences, Chinese Academy of Sciences (Grant 2011KIP504), the China Postdoctoral Science Foundation funded project (Grant 20100480639), and the Sanofi-Aventis-Shanghai Institutes for Biological Sciences scholarship program.

This article contains supplemental Tables S1 and S2 and Figs. S1–S11.
- HK2
- hexokinase 2
- gNET
- gene functional association network
- miRNA
- microRNA
- miR-143
- microRNA-143
- mTOR
- mammalian target of rapamycin
- MTT
- 3-(4,5-dimethylthiazol-2-yl)-2,5-diphenyltetrazolium bromide.
REFERENCES
- 1. Warburg O. (1956) On the origin of cancer cells. Science 123, 309–314 [DOI] [PubMed] [Google Scholar]
- 2. Mathupala S. P., Ko Y. H., Pedersen P. L. (2009) Hexokinase-2 bound to mitochondria: cancer's stygian link to the “Warburg Effect” and a pivotal target for effective therapy. Semin. Cancer Biol. 19, 17–24 [DOI] [PMC free article] [PubMed] [Google Scholar]
- 3. Yeung S. J., Pan J., Lee M. H. (2008) Roles of p53, MYC, and HIF-1 in regulating glycolysis: the seventh hallmark of cancer. Cell. Mol. Life Sci. 65, 3981–3999 [DOI] [PMC free article] [PubMed] [Google Scholar]
- 4. Hsu P. P., Sabatini D. M. (2008) Cancer cell metabolism: Warburg and beyond. Cell 134, 703–707 [DOI] [PubMed] [Google Scholar]
- 5. Mathupala S. P., Ko Y. H., Pedersen P. L. (2006) Hexokinase II: cancer's double-edged sword acting as both facilitator and gatekeeper of malignancy when bound to mitochondria. Oncogene 25, 4777–4786 [DOI] [PMC free article] [PubMed] [Google Scholar]
- 6. Wilson J. E. (2003) Isozymes of mammalian hexokinase: structure, subcellular localization, and metabolic function. J. Exp. Biol. 206, 2049–2057 [DOI] [PubMed] [Google Scholar]
- 7. Pedersen P. L., Mathupala S., Rempel A., Geschwind J. F., Ko Y. H. (2002) Mitochondrial bound type II hexokinase: a key player in the growth and survival of many cancers and an ideal prospect for therapeutic intervention. Biochim. Biophys. Acta 1555, 14–20 [DOI] [PubMed] [Google Scholar]
- 8. Wolf A., Agnihotri S., Micallef J., Mukherjee J., Sabha N., Cairns R., Hawkins C., Guha A. (2011) Hexokinase 2 is a key mediator of aerobic glycolysis and promotes tumor growth in human glioblastoma multiforme. J. Exp. Med. 208, 313–326 [DOI] [PMC free article] [PubMed] [Google Scholar]
- 9. Bushati N., Cohen S. M. (2007) microRNA functions. Annu. Rev. Cell Dev. Biol. 23, 175–205 [DOI] [PubMed] [Google Scholar]
- 10. Gao P., Tchernyshyov I., Chang T. C., Lee Y. S., Kita K., Ochi T., Zeller K. I., De Marzo A. M., Van Eyk J. E., Mendell J. T., Dang C. V. (2009) c-Myc suppression of miR-23a/b enhances mitochondrial glutaminase expression and glutamine metabolism. Nature 458, 762–765 [DOI] [PMC free article] [PubMed] [Google Scholar]
- 11. Rayner K. J., Suárez Y., Dávalos A., Parathath S., Fitzgerald M. L., Tamehiro N., Fisher E. A., Moore K. J., Fernández-Hernando C. (2010) miR-33 contributes to the regulation of cholesterol homeostasis. Science 328, 1570–1573 [DOI] [PMC free article] [PubMed] [Google Scholar]
- 12. Guo H., Ingolia N. T., Weissman J. S., Bartel D. P. (2010) Mammalian microRNAs predominantly act to decrease target mRNA levels. Nature 466, 835–840 [DOI] [PMC free article] [PubMed] [Google Scholar]
- 13. Yu F., Yao H., Zhu P., Zhang X., Pan Q., Gong C., Huang Y., Hu X., Su F., Lieberman J., Song E. (2007) let-7 regulates self-renewal and tumorigenicity of breast cancer cells. Cell 131, 1109–1123 [DOI] [PubMed] [Google Scholar]
- 14. Calin G. A., Croce C. M. (2006) MicroRNA signatures in human cancers. Nat. Rev. Cancer 6, 857–866 [DOI] [PubMed] [Google Scholar]
- 15. Yanaihara N., Caplen N., Bowman E., Seike M., Kumamoto K., Yi M., Stephens R. M., Okamoto A., Yokota J., Tanaka T., Calin G. A., Liu C. G., Croce C. M., Harris C. C. (2006) Unique microRNA molecular profiles in lung cancer diagnosis and prognosis. Cancer Cell 9, 189–198 [DOI] [PubMed] [Google Scholar]
- 16. Fang Z., Tian W., Ji H. (2012) A network-based gene-weighting approach for pathway analysis. Cell Res. 22, 565–580 [DOI] [PMC free article] [PubMed] [Google Scholar]
- 17. Bolstad B. M., Irizarry R. A., Astrand M., Speed T. P. (2003) A comparison of normalization methods for high density oligonucleotide array data based on variance and bias. Bioinformatics 19, 185–193 [DOI] [PubMed] [Google Scholar]
- 18. Su L. J., Chang C. W., Wu Y. C., Chen K. C., Lin C. J., Liang S. C., Lin C. H., Whang-Peng J., Hsu S. L., Chen C. H., Huang C. Y. (2007) Selection of DDX5 as a novel internal control for Q-RT-PCR from microarray data using a block bootstrap resampling scheme. BMC Genomics 8, 140. [DOI] [PMC free article] [PubMed] [Google Scholar]
- 19. Landi M. T., Dracheva T., Rotunno M., Figueroa J. D., Liu H., Dasgupta A., Mann F. E., Fukuoka J., Hames M., Bergen A. W., Murphy S. E., Yang P., Pesatori A. C., Consonni D., Bertazzi P. A., Wacholder S., Shih J. H., Caporaso N. E., Jen J. (2008) Gene expression signature of cigarette smoking and its role in lung adenocarcinoma development and survival. PLoS ONE 3, e1651. [DOI] [PMC free article] [PubMed] [Google Scholar]
- 20. Dai M., Wang P., Boyd A. D., Kostov G., Athey B., Jones E. G., Bunney W. E., Myers R. M., Speed T. P., Akil H., Watson S. J., Meng F. (2005) Evolving gene/transcript definitions significantly alter the interpretation of GeneChip data. Nucleic Acids Res. 33, e175. [DOI] [PMC free article] [PubMed] [Google Scholar]
- 21. Irizarry R. A., Bolstad B. M., Collin F., Cope L. M., Hobbs B., Speed T. P. (2003) Summaries of Affymetrix GeneChip probe level data. Nucleic Acids Res. 31, e15. [DOI] [PMC free article] [PubMed] [Google Scholar]
- 22. Irizarry R. A., Hobbs B., Collin F., Beazer-Barclay Y. D., Antonellis K. J., Scherf U., Speed T. P. (2003) Exploration, normalization, and summaries of high density oligonucleotide array probe level data. Biostatistics 4, 249–264 [DOI] [PubMed] [Google Scholar]
- 23. Grimson A., Farh K. K., Johnston W. K., Garrett-Engele P., Lim L. P., Bartel D. P. (2007) MicroRNA targeting specificity in mammals: determinants beyond seed pairing. Mol. cell 27, 91–105 [DOI] [PMC free article] [PubMed] [Google Scholar]
- 24. Johnson L., Mercer K., Greenbaum D., Bronson R. T., Crowley D., Tuveson D. A., Jacks T. (2001) Somatic activation of the K-ras oncogene causes early onset lung cancer in mice. Nature 410, 1111–1116 [DOI] [PubMed] [Google Scholar]
- 25. Li D., Shimamura T., Ji H., Chen L., Haringsma H. J., McNamara K., Liang M. C., Perera S. A., Zaghlul S., Borgman C. L., Kubo S., Takahashi M., Sun Y., Chirieac L. R., Padera R. F., Lindeman N. I., Jänne P. A., Thomas R. K., Meyerson M. L., Eck M. J., Engelman J. A., Shapiro G. I., Wong K. K. (2007) Bronchial and peripheral murine lung carcinomas induced by T790M-L858R mutant EGFR respond to HKI-272 and rapamycin combination therapy. Cancer Cell 12, 81–93 [DOI] [PubMed] [Google Scholar]
- 26. Schmittgen T. D., Lee E. J., Jiang J., Sarkar A., Yang L., Elton T. S., Chen C. (2008) Real-time PCR quantification of precursor and mature microRNA. Methods 44, 31–38 [DOI] [PMC free article] [PubMed] [Google Scholar]
- 27. Djuranovic S., Nahvi A., Green R. (2011) A parsimonious model for gene regulation by miRNAs. Science 331, 550–553 [DOI] [PMC free article] [PubMed] [Google Scholar]
- 28. Sun Y., Ge Y., Drnevich J., Zhao Y., Band M., Chen J. (2010) Mammalian target of rapamycin regulates miRNA-1 and follistatin in skeletal myogenesis. J. Cell Biol. 189, 1157–1169 [DOI] [PMC free article] [PubMed] [Google Scholar]
- 29. Pillai R. S., Bhattacharyya S. N., Filipowicz W. (2007) Repression of protein synthesis by miRNAs: how many mechanisms? Trends Cell Biol. 17, 118–126 [DOI] [PubMed] [Google Scholar]
- 30. Selbach M., Schwanhäusser B., Thierfelder N., Fang Z., Khanin R., Rajewsky N. (2008) Widespread changes in protein synthesis induced by microRNAs. Nature 455, 58–63 [DOI] [PubMed] [Google Scholar]
- 31. Pedersen P. L. (2007) Warburg, me, and Hexokinase 2: multiple discoveries of key molecular events underlying one of cancers' most common phenotypes, the “Warburg Effect,” i.e., elevated glycolysis in the presence of oxygen. J. Bioenerg. Biomembr. 39, 211–222 [DOI] [PubMed] [Google Scholar]
- 32. Bjornsti M. A., Houghton P. J. (2004) The TOR pathway: a target for cancer therapy. Nat. Rev. Cancer 4, 335–348 [DOI] [PubMed] [Google Scholar]
- 33. Guertin D. A., Sabatini D. M. (2005) An expanding role for mTOR in cancer. Trends Mol. Med. 11, 353–361 [DOI] [PubMed] [Google Scholar]
- 34. Peschiaroli A., Giacobbe A., Formosa A., Markert E. K., Bongiorno-Borbone L., Levine A. J., Candi E., D'Alessandro A., Zolla L., Finazzi Agrò A., Melino G. (April 2, 2012) miR-143 regulates hexokinase 2 expression in cancer cells. Oncogene 10.1038/onc.2012.100 [DOI] [PubMed] [Google Scholar]
- 35. Jiang S., Zhang L. F., Zhang H. W., Hu S., Lu M. H., Liang S., Li B., Li Y., Li D., Wang E. D., Liu M. F. (2012) A novel miR-155/miR-143 cascade controls glycolysis by regulating hexokinase 2 in breast cancer cells. EMBO J. 31, 1985–1998 [DOI] [PMC free article] [PubMed] [Google Scholar]
Associated Data
This section collects any data citations, data availability statements, or supplementary materials included in this article.