

Abstract
Background
Formation of advanced glycation endproducts (AGEs), endothelial dysfunction, and low-grade inflammation are intermediate pathways of hyperglycemia-induced vascular complications. We investigated the effect of benfotiamine on markers of these pathways in patients with type 2 diabetes and nephropathy.
Methods
Patients with type 2 diabetes and urinary albumin excretion in the high-normal and microalbuminuric range (15–300 mg/24h) were randomized to receive benfotiamine (n = 39) or placebo (n = 43). Plasma and urinary AGEs (N ε-(carboxymethyl) lysine [CML], N ε-(Carboxyethyl) lysine [CEL], and 5-hydro-5-methylimidazolone [MG-H1]) and plasma markers of endothelial dysfunction (soluble vascular cell adhesion molecule-1 [sVCAM-1], soluble intercellular adhesion molecule-1 [sICAM-1], soluble E-selectin) and low-grade inflammation (high-sensitivity C-reactive protein [hs-CRP], serum amyloid-A [SAA], myeloperoxidase [MPO]) were measured at baseline and after 6 and 12 weeks.
Results
Compared to placebo, benfotiamine did not result in significant reductions in plasma or urinary AGEs or plasma markers of endothelial dysfunction and low-grade inflammation.
Conclusions
Benfotiamine for 12 weeks did not significantly affect intermediate pathways of hyperglycemia-induced vascular complications.
Trial Regristration
Introduction
Diabetic nephropathy (DN) is a serious complication of diabetes and a leading cause of end-stage renal disease [1]. Thiamine and benfotiamine, a lipophilic thiamine-derivative, have been suggested as novel therapies for diabetic complications, including DN [2]. These agents would not exert their beneficial effects by improvement of hyperglycemia itself, but rather by activation of transketolase [2], [3]. This leads to a decrease in triosephospates and methylglyoxal; i.e. the major precursors of advanced glycation endproducts (AGEs), and subsequently inhibition of endothelial dysfunction and chronic low-grade inflammation [4], [5]. However, in a recent 12-week double-blind placebo-controlled trial in patients with type 2 diabetes, we found no effect of benfotiamine on urinary albumin excretion (UAE) or renal tubular damage markers [6]. One possibility is that our choice for these primary endpoints is too late in the sequence of events, because even the reduction in AGEs that occurs after pancreas transplantation has been reported to take years to translate into an effect on urinary albumin excretion [7]. We now aimed to evaluate the effect of benfotiamine on AGEs and markers of endothelial dysfunction and chronic low-grade inflammation, and to find ground to set up a study of longer duration.
Methods
Patients and study design
A detailed description of the study has been published [6]. The protocol for this trial and supporting CONSORT checklist are available as supporting information; see Protocol S1 and Checklist S1. We included patients from the outpatients department in the Isala Clinics, Zwolle, the Netherlands, in the period from January 2008 till June 2009. Included subjects were patients with type 2 diabetes, aged 40 to 75 years, with UAE between 15–300 mg/24h despite treatment with ACE inhibitors (ACE-Is) and/or angiotensin receptor blockers (ARBs). Patients (n = 86) were randomized to receive either benfotiamine (Wörwag pharma, Böblingen, Germany) 300 mg t.i.d. (total daily dose 900 mg) or placebo during 12 weeks. On each visit (baseline, 6 weeks, and 12 weeks), patients delivered 24-h urine collection, and additional morning spot-urine and blood samples were taken. All patients signed informed consent. This trial was conducted in accordance with the Helsinki Declaration and approved by the Medical Ethics Committee of the Isala Clinics, Zwolle, the Netherlands.
Clinical laboratory investigations
For the current report, urine and plasma samples were stored frozen at −80°C until assessment. Detection of plasma AGEs N ε-(carboxymethyl) lysine (CML), N ε-(Carboxyethyl) lysine (CEL) and urine AGEs (CML, CEL and the methylglyoxal-arginine-adduct 5-hydro-5-methylimidazolone (MG-H1)) in 24-h urine samples was performed by means of a stable-isotope-dilution tandem mass spectrometry method [8], [9]. Soluble vascular cell adhesion molecule-1 (sVCAM-1), soluble intercellular adhesion molecule-1 (sICAM-1), high sensitivity C-reactive protein (hs-CRP) and serum amyloid-A (SAA) were assessed by multi-array detection system (SECTOR-Imager 2400, Mesoscale Discovery, Maryland). Soluble E-selectin and myeloperoxidase (MPO) were measured by commercially available multiplex assays (Millipore, Massachusetts). Other measurements were performed according to standard hospital procedures.
Statistical analysis
Variables with a normal distribution are presented as mean and standard deviation and variables with a skewed distribution are presented as median and interquartile range. Intention-to-treat analysis and per-protocol analysis were planned. After randomization, four patients from the benfotiamine group withdrew from consent. Therefore, these subjects were not available for follow-up visits and no samples could be obtained from these subjects. All remaining patients (39 patients in the benfotiamine group and 43 patients in the placebo group) were available for analyses. In per-protocol analyses, patients who deviated from the study protocol (non-compliance or change in concomitant medications, n = 1 in the benfotiamine group and n = 3 in the placebo group [6]) were excluded. In the previous report [6], analyses of the primary endpoints (UAE and KIM-1) were presented. In this report, we present predefined analyses of secondary endpoints: plasma and urinary AGEs and plasma levels of biomarkers of endothelial dysfunction and low-grade inflammation. Using ANOVA for repeated measures (Mixed Model Analysis), within-subjects factors (effect of time; disease modifying model), effects of the between-subjects factors (difference between groups; symptomatic relief), and interaction between time of visit (0, 6, and 12 weeks) and group (benfotiamine versus placebo) were evaluated. Q-Q plots were used to assess whether the residuals of the dependent variables in the model had normal distribution. Because of skewed distribution of the residuals, logarithmic transformation (natural logarithm) of the data was performed before analysis. The results are summarized in terms of estimated means with 95% confidence intervals (CI). Differences in mean change between benfotiamine and placebo at 6 weeks and 12 weeks are presented as mean difference with 95% CI. P-values for time, group, and time*group interaction are presented. A two-sided P-value <0.05 was considered statistically significant. Statistics were done with SPSS, version 16.0 (Chicago, IL).
Results
A flow diagram of the trial is shown in figure 1. Baseline characteristics are presented in table 1. At baseline, blood thiamine was correlated with urinary excretion of CML (r = 0.26, P = 0.02) and CEL (r = 0.25, P = 0.02). No significant correlations of thiamine status with other AGEs or biomarkers of endothelial dysfunction and low-grade inflammation were found. Baseline characteristics were not materially different between groups, except for a more frequent use of oral hypoglycaemic agents and a slightly higher plasma creatinine in the placebo group. As shown in table 2, benfotiamine treatment had neither a significant effect on plasma or urinary AGEs nor on markers of endothelial dysfunction or chronic low-grade inflammation. Adjustment for baseline differences gave similar results. Results of per-protocol analysis (not shown) were not different from presented intention-to-treat analyses. Subgroup analyses in patients with low range UAE (<100 mg/24u) and high range UAE (>100 mg/24h) did not reveal differences in response to benfotiamine compared to placebo.
Figure 1. CONSORT flow diagram of the study.
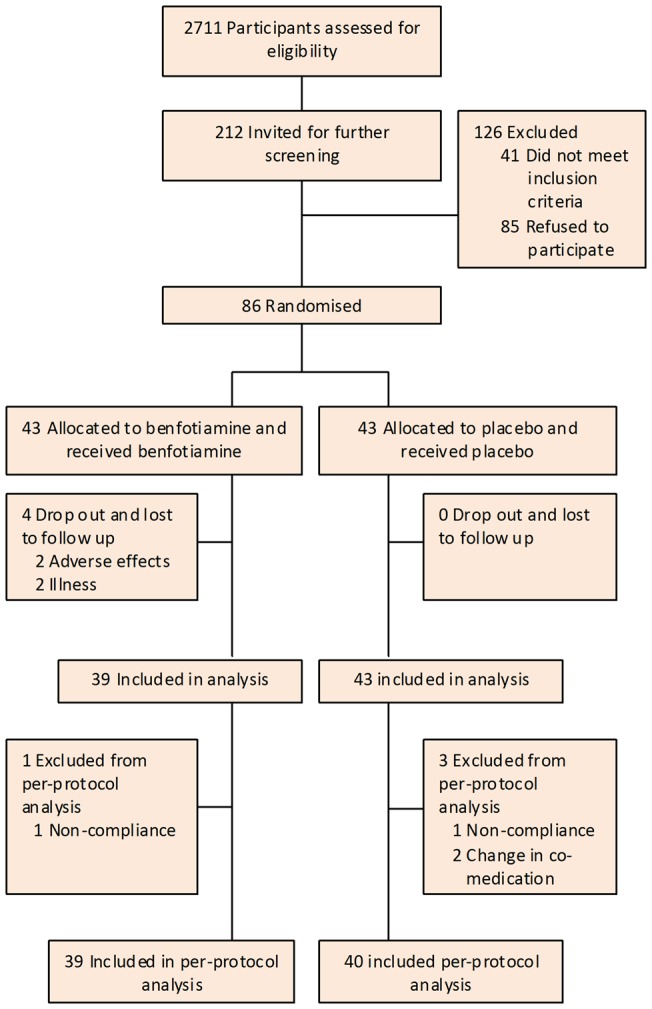
Table 1. Baseline characteristics of study population.
| Benfotiamine (n = 39) | Placebo (n = 43) | |
| Males (n (%)) | 30 (77%) | 33 (82%) |
| Age (years) | 65.3 ± 5.9 | 64.6 ± 6.1 |
| BMI (kg/m2) | 32.1 ± 5.1 | 31.9 ± 5.9 |
| Duration of diabetes (years) | 12 [9; 18] | 10 [7; 18] |
| SBP (mmHg) | 140 ± 16 | 137 ± 20 |
| DBP (mmHg) | 67 ± 8 | 76 ± 10 |
| A1c (%) | 7.3 ± 0.9 | 7.4 ± 0.9 |
| Plasma creatinine (μmol/l) | 84 ± 19 | 87 ± 23 |
| UAE (mg/24h) | 90 [38; 267] | 97 [48; 177] |
| Thiamine (nmol/l) | 126 ± 23 | 122 ± 23 |
| Plasma AGEs | ||
| CML (nmol/mmol lysine) | 64.48 [58.21; 69.69] | 62.51 [54.88; 71.20] |
| CEL (nmol/mmol lysine) | 51.14 [44.78; 59.25] | 56.99 [43.71; 62.10] |
| Urine AGEs | ||
| CML excretion (nmol/24h) | 7630 [6761; 10576] | 8879 [6476; 11769] |
| CML/creatinine (nmol/mmol) | 572 [416; 731] | 596 [483; 788] |
| CEL excretion (nmol/24h) | 12405 [9105; 15240] | 11204 [8922; 16384] |
| CEL/creatinine (nmol/mmol) | 763 [602; 1061] | 871 [648; 1034] |
| MG-H1 excretion (nmol/24h) | 479122 [34431; 69775] | 44930 [32095; 58614] |
| MG-H1/creatinine (nmol/mmol) | 3459 [2196; 4856] | 2999 [2260; 4563] |
| Endothelial dysfunction markers | ||
| s-ICAM (ng/ml) | 257.3 [222.0; 281.1] | 241.7 [213.2; 308.0] |
| s-VCAM (ng/ml) | 399.1 [362.7; 431.7] | 388.3 [335.8; 461.9] |
| s-E-Selectin (ng/ml) | 45.3 [29.8; 54.6] | 39.5 [26.8; 51.3] |
| Low-grade inflammation markers | ||
| Hs-CRP (ng/ml) | 1395 [754; 2891] | 1738 [824; 4097] |
| SAA (ng/ml) | 1356 [927; 2028] | 1162 [694; 2328] |
| MPO (ng/ml) | 20.4 [9.9; 28.3] | 20.4 [6.2; 27.2] |
Data are mean ± standard deviation or median [interquartile range].
BMI, body mass index; SBP, systolic blood pressure; DBP, diastolic blood pressure; A1c, Glycated haemoglobin; UAE, urinary albumin excretion; AGEs, advanced glycation endproducts; CML, N ε-(Carboxymethyl) lysine; CEL, N ε-(Carboxyethyl) lysine; MG-H1, 5-hydro-5-methylimidazolone; s-ICAM, serum inter-cellular adhesion molecule-1; s-VCAM, serum vascular cell adhesion molecule-1; Hs-CRP, high sensitive C-reactive protein; SAA, serum amyloid A; MPO, myeloperoxidase.
Table 2. Estimated means of the log-transformed data at each visit, changes within group compared to baseline, and mean differences of change between groups compared to baseline.
| Benfotiamine (n = 39) | Placebo (n = 43) | Difference of change between groups | P | |||
| Time | Group | Time x Group | ||||
| Plasma AGEs | ||||||
| CML (nmol/mmol lysine) | ||||||
| Baseline | 4.17 (4.11 to 4.23) | 4.15 (4.09 to 4.20) | ||||
| Week 6 | 4.15 (4.09 to 4.21) | 4.14 (4.09 to 4.20) | ||||
| Week 12 | 4.15 (4.09 to 4.21) | 4.12 (4.07 to 4.18) | ||||
| At 6 weeks | −0.02 (−0.12 to 0.08) | 0.00 (−0.10 to 0.09) | −0.01 (−0.13 to 0.10) | |||
| At 12 weeks | −0.02 (−0.12 to 0.08) | −0.02 (−0.12 to 0.07) | 0.01 (−0.11 to 0.12) | 0.77 | 0.50 | 0.95 |
| CEL (nmol/mmol lysine) | ||||||
| Baseline | 3.94 (3.86 to 4.02) | 3.97 (3.90 to 4.05) | ||||
| Week 6 | 3.88 (3.81 to 3.96) | 3.94 (3.87 to 4.01) | ||||
| Week 12 | 3.90 (3.83 to 3.97) | 3.98 (3.92 to 4.04) | ||||
| At 6 weeks | −0.06 (−0.18 to 0.07) | −0.03 (−0.16 to 0.09) | −0.02 (−0.17 to 0.12) | |||
| At 12 weeks | −0.04 (−0.17 to 0.08) | 0.01 (−0.11 to 0.13) | −0.05 (−0.19 to 0.09) | 0.45 | 0.06 | 0.78 |
| Urine AGEs | ||||||
| U-CML excretion (nmol/24h) | ||||||
| Baseline | 8.98 (8.83 to 9.13) | 9.08 (8.93 to 9.22) | ||||
| Week 6 | 8.99 (8.85 to 9.13) | 9.08 (8.94 to 9.21) | ||||
| Week 12 | 9.04 (8.91 to 9.17) | 9.02 (8.90 to 9.15) | ||||
| At 6 weeks | 0.01 (−0.23 to 0.26) | 0.00 (−0.23 to 0.24) | 0.01 (−0.27 to 0.29) | |||
| At 12 weeks | 0.06 (−0.18 to 0.30) | −0.05 (−0.27 to 0.17) | 0.11 (−0.16 to 0.38) | 0.99 | 0.31 | 0.67 |
| U-CML/creatinine (nmol/mmol) | ||||||
| Baseline | 6.29 (6.14 to 6.44) | 6.40 (6.26 to 6.55) | ||||
| Week 6 | 6.30 (6.16 to 6.45) | 6.31 (6.17 to 6.44) | ||||
| Week 12 | 6.30 (6.13 to 6.47) | 6.38 (6.22 to 6.54) | ||||
| At 6 weeks | 0.01 (−0.24 to 0.27) | −0.10 (−0.34 to 0.15) | 0.11 (−0.18 to 0.40) | |||
| At 12 weeks | 0.01 (−0.27 to 0.29) | −0.02 (−0.28 to 0.24) | 0.03 (−0.28 to 0.34) | 0.82 | 0.29 | 0.74 |
| U-CEL excretion (nmol/24h) | ||||||
| Baseline | 8.98 (8.83 to 9.13) | 9.08 (8.93 to 9.22) | ||||
| Week 6 | 8.99 (8.85 to 9.13) | 9.08 (8.94 to 9.21) | ||||
| Week 12 | 9.04 (8.91 to 9.17) | 9.02 (8.90 to 9.15) | ||||
| At 6 weeks | 0.01 (−0.23 to 0.26) | 0.00 (−0.23 to 0.24) | 0.01 (−0.27 to 0.29) | |||
| At 12 weeks | 0.06 (−0.18 to 0.30) | −0.05 (−0.28 to 0.18) | 0.11 (−0.16 to 0.38) | 0.99 | 0.31 | 0.67 |
| U-CEL/creatinine (nmol/mmol) | ||||||
| Baseline | 6.29 (6.14 to 6.44) | 6.40 (6.26 to 6.55) | ||||
| Week 6 | 6.30 (6.16 to 6.45) | 6.31 (6.17 to 6.44) | ||||
| Week 12 | 6.30 (6.13 to 6.47) | 6.38 (6.22 to 6.54) | ||||
| At 6 weeks | 0.01 (−0.24 to 0.27) | −0.10 (−0.34 to 0.15) | 0.11 (−0.18 to 0.40) | |||
| At 12 weeks | 0.01 (−0.27 to 0.29) | −0.02 (−0.28 to 0.24) | 0.03 (−0.28 to 0.35) | 0.82 | 0.29 | 0.74 |
| MG-H1 excretion (nmol/24h) | ||||||
| Baseline | 10.74 (10.56 to 10.91) | 10.72 (10.55 to 10.89) | ||||
| Week 6 | 10.63 (10.46 to 10.80) | 10.72 (10.55 to 10.88) | ||||
| Week 12 | 10.63 (10.46 to 10.81) | 10.58 (10.42 to 10.75) | ||||
| At 6 weeks | −0.10 (−0.40 to 0.19) | 0.00 (−0.28 to 0.28) | −0.10 (−0.44 to 0.24) | |||
| At 12 weeks | −0.10 (−0.40 to 0.20) | −0.14 (−0.42 to 0.15) | 0.04 (−0.30 to 0.38) | 0.38 | 0.94 | 0.69 |
| U-MG-H1/creatinine (nmol/mmol) | ||||||
| Baseline | 8.05 (7.85 to 8.24) | 8.05 (7.86 to 8.23) | ||||
| Week 6 | 7.94 (7.75 to 8.13) | 7.94 (7.78 to 8.14) | ||||
| Week 12 | 7.90 (7.72 to 8.08) | 7.90 (7.77 to 8.11) | ||||
| At 6 weeks | −0.10 (−0.44 to 0.23) | −0.08 (−0.40 to 0.23) | −0.02 (−0.40 to 0.36) | |||
| At 12 weeks | −0.15 (−0.47 to 0.17) | −0.11 (−0.41 to 0.20) | −0.04 (−0.41 to 0.33) | 0.36 | 0.80 | 0.98 |
| Endothelial dysfunction markers | ||||||
| s-ICAM (ng/ml) | ||||||
| Baseline | 5.53 (5.44 to 5.61) | 5.55 (5.47 to 5.63) | ||||
| Week 6 | 5.55 (5.47 to 5.64) | 5.53 (5.45 to 5.62) | ||||
| Week 12 | 5.56 (5.48 to 5.63) | 5.52 (5.44 to 5.59) | ||||
| At 6 weeks | 0.03 (−0.12 to 0.18) | −0.02 (−0.16 to 0.12) | 0.05 (−0.12 to 0.22) | |||
| At 12 weeks | 0.03 (−0.11 to 0.17) | −0.03 (−0.17 to 0.10) | 0.06 (−0.10 to 0.22) | 0.99 | 0.74 | 0.74 |
| s-VCAM (ng/ml) | ||||||
| Baseline | 5.98 (5.92 to 6.05) | 5.98 (5.92 to 6.04) | ||||
| Week 6 | 5.99 (5.93 to 6.05) | 5.96 (5.90 to 6.02) | ||||
| Week 12 | 6.02 (5.96 to 6.09) | 5.96 (5.89 to 6.02) | ||||
| At 6 weeks | 0.01 (−0.10 to 0.11) | −0.02 (−0.12 to 0.09) | 0.02 (−0.10 to 0.14) | |||
| At 12 weeks | 0.04 (−0.07 to 0.15) | −0.02 (−0.12 to 0.08) | 0.06 (−0.07 to 0.18) | 0.91 | 0.19 | 0.64 |
| s-E-selectin (ng/ml) | ||||||
| Baseline | 3.66 (3.46 to 3.85) | 3.57 (3.39 to 3.75) | ||||
| Week 6 | 3.84 (3.70 to 3.97) | 3.71 (3.59 to 3.84) | ||||
| Week 12 | 3.79 (3.64 to 3.95) | 3.69 (3.54 to 3.84) | ||||
| At 6 weeks | 0.18 (−0.10 to 0.46) | 0.14 (−0.13 to 0.41) | 0.04 (−0.28 to 0.37) | |||
| At 12 weeks | 0.14 (−0.16 to 0.44) | 0.12 (−0.17 to 0.40) | 0.02 (−0.32 to 0.36) | 0.14 | 0.10 | 0.96 |
| Low-grade inflammation markers | ||||||
| Hs-CRP (ng/ml) | ||||||
| Baseline | 7.49 (7.13 to 7.85) | 7.56 (7.21 to 7.91) | ||||
| Week 6 | 7.63 (7.28 to 7.98) | 7.41 (7.07 to 7.75) | ||||
| Week 12 | 7.54 (7.20 to 7.87) | 7.51 (7.19 to 7.83) | ||||
| At 6 weeks | 0.14 (−0.48 to 0.75) | −0.15 (−0.74 to 0.44) | 0.29 (−0.41 to 0.98) | |||
| At 12 weeks | 0.05 (−0.55 to 0.64) | −0.05 (−0.63 to 0.52) | 0.10 (−0.59 to 0.78) | 0.99 | 0.67 | 0.71 |
| SAA (ng/ml) | ||||||
| Baseline | 7.26 (6.95 to 7.58) | 7.22 (6.92 to 7.53) | ||||
| Week 6 | 7.29 (6.96 to7.61) | 7.07 (6.76 to 7.38) | ||||
| Week 12 | 7.14 (6.83 to 7.46) | 7.20 (6.90 to 7.50) | ||||
| At 6 weeks | 0.02 (−0.53 to 0.57) | −0.15 (−0.68 to 0.37) | 0.18 (−0.45 to 0.81) | |||
| At 12 weeks | −0.12 (−0.66 to 0.42) | −0.02 (−0.54 to 0.50) | −0.10 (−0.72 to 0.51) | 0.88 | 0.60 | 0.67 |
| MPO (ng/ml) | ||||||
| Baseline | 2.90 (2.61 to 3.20) | 2.80 (2.51 to 3.09) | ||||
| Week 6 | 2.89 (2.61 to 3.17) | 2.67 (2.40 to 2.94) | ||||
| Week 12 | 2.88 (2.61 to 3.16) | 2.72 (2.46 to 2.98) | ||||
| At 6 weeks | −0.02 (−0.52 to 0.48) | −0.13 (−0.61 to 0.35) | 0.11 (−0.45 to 0.68) | |||
| At 12 weeks | −0.02 (−0.51 to 0.47) | −0.08 (−0.56 to 0.39) | 0.06 (−0.50 to 0.63) | 0.87 | 0.15 | 0.92 |
Data are log-transformed and presented as mean (95% confidence interval) or mean difference (95% confidence interval for difference).
CML, N ε mn-(Carboxymethyl) lysine; CEL, N ε-(Carboxyethyl) lysine; MG-H1, 5-hydro-5-methylimidazolone; s-ICAM, serum inter-cellular adhesion molecule-1; s-VCAM, serum vascular cell adhesion molecule-1; Hs-CRP, high sensitive C-reactive protein; SAA, serum amyloid A; MPO, myeloperoxidase.
Discussion
We found that 12-week treatment with benfotiamine in patients with type 2 diabetes did not result in a decrease of plasma AGEs, urinary excretion of AGEs, plasma biomarkers of endothelial dysfunction or plasma biomarkers of chronic low-grade inflammation.
Benfotiamine is converted to thiamine pyrophosphate, a co-factor of transketolase. The activation of transketolase plays a crucial role in oxidative and non-oxidative pentosephosphate pathways that inhibit vascular complications of diabetes [3], [10]. In our trial, although we found that benfotiamine resulted in a significant improvement in thiamine status (a significant increase in thiamine levels and transketolase activity), there was no significant difference between the benfotiamine group and the placebo group regarding urinary albumin excretion, urinary excretion of tubular damage markers, or blood pressure [6].
Studies in diabetic animals have shown that benfotiamine inhibited protein kinase C, formation of AGEs and oxidative stress, indicating a protective effect against hyperglycemia-induced endothelial dysfunction and inflammation [2], [4].
To the best of our knowledge, our study is the first randomised controlled trial that has investigated the effect of benfotiamine on AGEs formation and markers of low-grade inflammation in humans. Results from previous studies on thiamine and benfotiamine on endothelial function in humans are conflicting. An earlier cross-sectional analysis in 74 patients with type 1 and type 2 diabetes found an inverse association of thiamine status with sVCAM-1 [11], suggesting an effect of thiamine status on markers of endothelial dysfunction. However, in a study in patients with type 2 diabetes [5], the same group found no effect of thiamine supplementation on sVCAM-1, We also did not find an effect of benfotiamine on markers of endothelial dysfunction, including sVCAM-1. Nevertheless, in a study in 13 patients with type 2 diabetes [12], beneficial effects of benfotiamine (1050 mg/day) on the endothelial damage and oxidative stress that occurs after consumption of an AGE-rich meal were suggested to be already present after three days of treatment. While on the basis of this experiment longer periods of treatment with benfotiamine (12 weeks in our study) might be anticipated to be sufficient to cause an effect on formation of AGEs and endothelial damage, the effects of benfotiamine could also be more directly meal-related rather than affecting steady-state concentrations.
Compared to previous studies in animals [2] and humans [5], [13], a daily dose of 900 mg is considered as a high dose. Due to its pharmacokinetics, benfotiamine is absorbed considerably better than thiamine. However, it is important to realize that intestinal and renal tubular transport of thiamine is tightly regulated to maintain homeostasis. Accordingly, expression of the transporters is up-regulated in presence of deficiency states and down-regulated in response to an excess supply of these nutrients, which may account for a rapid excretion of thiamine in the urine after consumption of a high dose of benfotiamine [14], [15]. Additionally, studies in experimental animals have shown that chronic kidney disease results in down-regulation of expression of key transporters and receptors for thiamine and folate, which can further limit the bioavailability of these micronutrients [16]. In our study, although higher blood thiamine levels and transketolase activity was achieved in the benfotiamine group, thiamine levels in renal cells might still be deficient even in case of high blood thiamine.
Our objectives were studied in a relevant study population, including patients with type 2 diabetes and UAE in the high-normal and microalbuminuric range treated with ACE-Is and/or ARBs. An important limitation of this study is that AGEs and biomarkers of endothelial dysfunction and inflammation were measured in urine and blood. Intracellular concentrations of these markers in target organs (e.g. glomeruli and tubuli) may give additional information on effects of benfotiamine on vascular complications. Therefore, assessment of intracellular AGEs in future studies would be necessary.
In conclusion, 12-week benfotiamine treatment did neither significantly affect plasma or urine AGEs nor plasma biomarkers of endothelial dysfunction or chronic low-grade inflammation in patients with type 2 diabetes and UAE in the high-normal and microalbuminuric range. Because small short-term effects can not be excluded and potential effects that take long to ensue can not be studied in a 12-week study, larger or longer term studies are necessary to elucidate whether benfotiamine reduces formation of AGEs or diminishes the risk of hyperglycemia-induced vascular complications.
Supporting Information
Trial protocol.
(DOC)
CONSORT checklist of the trial.
(DOC)
Acknowledgments
The efforts of Dr. G.S. Mijnhout, Dr. J. Lambert, Dr. J.E. Heeg (Isala clinics, Department of Internal Medicine, Zwolle, the Netherlands) and Dr. J. Jager (Diaconessenhuis Hospital, Department of Internal Medicine, Meppel, the Netherlands) in recruitment of participants are acknowledged. We thank Dr. L.D. Dikkeschei, M. van der Saag, and M. Slingschröder (Isala clinics, clinical chemical laboratory, Zwolle, the Netherlands), H. Breukelman (University Medical Center Groningen, Clinical laboratory, Groningen, the Netherlands), and M. Schipper (University Medical Center Groningen, Department of Pathology and Medical Biology, Groningen, the Netherlands) for their great collaboration.
Footnotes
Competing Interests: The authors have declared that no competing interests exist.
Funding: This trial was partly funded by a grant from the European Union to PREDICTIONS (Prevention of Diabetes Complication) network and by the medical research foundation in Zwolle. The funders had no role in study design, data collection and analysis, decision to publish, or preparation of the manuscript.
References
- 1.Ritz E, Rychlik I, Locatelli F, Halimi S. End-stage renal failure in type 2 diabetes: A medical catastrophe of worldwide dimensions. Am J Kidney Dis. 1999;34:795–808. doi: 10.1016/S0272-6386(99)70035-1. [DOI] [PubMed] [Google Scholar]
- 2.Babaei-Jadidi R, Karachalias N, Ahmed N, Battah S, Thornalley PJ. Prevention of incipient diabetic nephropathy by high-dose thiamine and benfotiamine. Diabetes. 2003;52:2110–2120. doi: 10.2337/diabetes.52.8.2110. [DOI] [PubMed] [Google Scholar]
- 3.Karachalias N, Babaei-Jadidi R, Rabbani N, Thornalley PJ. Increased protein damage in renal glomeruli, retina, nerve, plasma and urine and its prevention by thiamine and benfotiamine therapy in a rat model of diabetes. Diabetologia. 2010;53:1506–1516. doi: 10.1007/s00125-010-1722-z. [DOI] [PubMed] [Google Scholar]
- 4.Hammes HP, Du X, Edelstein D, Taguchi T, Matsumura T, et al. Benfotiamine blocks three major pathways of hyperglycemic damage and prevents experimental diabetic retinopathy. Nat Med. 2003;9:294–299. doi: 10.1038/nm834. [DOI] [PubMed] [Google Scholar]
- 5.Rabbani N, Alam SS, Riaz S, Larkin JR, Akhtar MW, et al. High-dose thiamine therapy for patients with type 2 diabetes and microalbuminuria: A randomised, double-blind placebo-controlled pilot study. Diabetologia. 2009;52:208–212. doi: 10.1007/s00125-008-1224-4. [DOI] [PubMed] [Google Scholar]
- 6.Alkhalaf A, Klooster A, van Oeveren W, Achenbach U, Kleefstra N, et al. A double-blind, randomized, placebo-controlled clinical trial on benfotiamine treatment in patients with diabetic nephropathy. Diabetes Care. 2010;33:1598–1601. doi: 10.2337/dc09-2241. [DOI] [PMC free article] [PubMed] [Google Scholar]
- 7.Steffes MW. Glomerular lesions of diabetes mellitus: Preventable and reversible. Nephrol Dial Transplant. 1999;14:19–21. doi: 10.1093/ndt/14.1.19. [DOI] [PubMed] [Google Scholar]
- 8.Teerlink T, Barto R, Ten Brink HJ, Schalkwijk CG. Measurement of nepsilon-(carboxymethyl) lysine and nepsilon-(carboxyethyl) lysine in human plasma protein by stable-isotope-dilution tandem mass spectrometry. Clin Chem. 2004;50:1222–1228. doi: 10.1373/clinchem.2004.031286. [DOI] [PubMed] [Google Scholar]
- 9.Scheijen JL, van de Waarenburg MP, Stehouwer CD, Schalkwijk CG. Measurement of pentosidine in human plasma protein by a single-column high-performance liquid chromatography method with fluorescence detection. J Chromatogr B Analyt Technol Biomed Life Sci. 2009;877:610–614. doi: 10.1016/j.jchromb.2009.01.022. [DOI] [PubMed] [Google Scholar]
- 10.Xue M, Qian Q, Adaikalakoteswari A, Rabbani N, Babaei-Jadidi R, et al. Activation of NF-E2-related factor-2 reverses biochemical dysfunction of endothelial cells induced by hyperglycemia linked to vascular disease. Diabetes. 2008;57:2809–2817. doi: 10.2337/db06-1003. [DOI] [PMC free article] [PubMed] [Google Scholar]
- 11.Thornalley PJ, Babaei-Jadidi R, Al AH, Rabbani N, Antonysunil A, et al. High prevalence of low plasma thiamine concentration in diabetes linked to a marker of vascular disease. Diabetologia. 2007;50:2164–2170. doi: 10.1007/s00125-007-0771-4. [DOI] [PMC free article] [PubMed] [Google Scholar]
- 12.Stirban A, Negrean M, Stratmann B, Gawlowski T, Horstmann T, et al. Benfotiamine prevents macro- and microvascular endothelial dysfunction and oxidative stress following a meal rich in advanced glycation end products in individuals with type 2 diabetes. Diabetes Care. 2006;29:2064–2071. doi: 10.2337/dc06-0531. [DOI] [PubMed] [Google Scholar]
- 13.Winkler G, Pal B, Nagybeganyi E, Ory I, Porochnavec M, et al. Effectiveness of different benfotiamine dosage regimens in the treatment of painful diabetic neuropathy. Arzneimittelforschung. 1999;49:220–224. doi: 10.1055/s-0031-1300405. [DOI] [PubMed] [Google Scholar]
- 14.Ashokkumar B, Vaziri ND, Said HM. Thiamin uptake by the human-derived renal epithelial (HEK-293) cells: Cellular and molecular mechanisms. Am J Physiol Renal Physiol. 2006;291:F796–805. doi: 10.1152/ajprenal.00078.2006. [DOI] [PubMed] [Google Scholar]
- 15.Reidling JC, Said HM. Adaptive regulation of intestinal thiamin uptake: Molecular mechanism using wild-type and transgenic mice carrying hTHTR-1 and -2 promoters. Am J Physiol Gastrointest Liver Physiol. 2005;288:G1127–34. doi: 10.1152/ajpgi.00539.2004. [DOI] [PubMed] [Google Scholar]
- 16.Bukhari FJ, Moradi H, Gollapudi P, Ju Kim H, Vaziri ND, et al. Effect of chronic kidney disease on the expression of thiamin and folic acid transporters. Nephrol Dial Transplant. 2011;26:2137–2144. doi: 10.1093/ndt/gfq675. [DOI] [PMC free article] [PubMed] [Google Scholar]
Associated Data
This section collects any data citations, data availability statements, or supplementary materials included in this article.
Supplementary Materials
Trial protocol.
(DOC)
CONSORT checklist of the trial.
(DOC)