

Abstract
We investigated the possible mechanisms of inhibition of colorectal carcinogenesis by green tea (GT) in azoxymethane-treated (AOM) ApcMin/+ mice. Mice received water or a 0.6% (w/v) solution of GT as the only source of beverage. GT treatment commenced at the 8th week of age and lasted for 8 wk. The treatment caused a statistically significant reduction in the number of newly formed tumors (28%, P <0.05). Immunohistochemical analysis showed that GT decreased the levels of β-catenin and its downstream target cyclin D1. To probe a mechanism, we further investigated the expression of retinoic X receptor alpha (RXRα) in AOM/ApcMin/+ tumors. Our results show that RXRα is selectively downregulated in AOM/ApcMin/+ mouse intestinal tumors. In contrast, other retinoic receptors including retinoic acid receptor alpha (RARα), RARβ, RXRβ, and RXRγ were all expressed in ApcMin/+ adenomas. Furthermore, our results show that RXRα downregulation is an early event in colorectal carcinogenesis and is independent of β-catenin expression. GT significantly increased the protein levels of RXRα. In addition, RT-PCR analysis showed that GT induced a similar increase in the levels of RXRα mRNA. Genomic bisulfite treatment of colonic DNA followed by pyrosequencing of 24 CpG sites in the promoter region of RXRα gene showed a significant decrease in CpG methylation with GT treatment. The results suggest that a low concentration of GT is sufficient to desilence RXRα and inhibit intestinal tumorigenesis in the ApcMin/+ mouse.
Keywords: green tea, colon cancer, azoxymethane (AOM), ApcMin/+ mouse model, β-catenin, cyclin D1, RXRα, methylation
INTRODUCTION
Colon cancer is the most common gastrointestinal cancer and the second leading cause of cancer deaths in the United States [1]. The high incidence rate worldwide cannot be explained solely by genetic predisposition. Indeed, factors such as lifestyle, diet, epigenetic variations, and exposure to chemical or biological carcinogens have been all suggested to be involved in the onset of the disease. The variation in risk factors has compromised the development of a single protocol to treat colon cancer. Therefore, a considerable research effort has been shifted to establishing simple, yet reliable early preventive procedures and to the search for natural or pharmacological chemopreventive agents that are safe and effective. A major class of such potential chemopreventive agents is found in green tea (GT).
GT is one of the most common beverages worldwide. The active ingredients in GT are believed to be a group of flavan-3-ol polyphenols known as catechins. The major tea catechins are (−)-epigallocatechin gallate (EGCG), (−)-epigallocatechin (EGC), (−)-epicatechin gallate (ECG), and (−)-epicatechin (EC) with EGCG comprising more than 60% of the total catechins [2]. Tea catechins, particularly EGCG, have been shown to posses a variety of pharmacological effects. These include antioxidant, anticarcinogenic, anti-inflammatory, antimicrobial, antiangiogenic, and hypocholesterolemic effects [3–5]. In addition, a wealth of epidemiological data has suggested an inverse correlation between tea consumption and the risk of several types of cancer [6]. Colon carcinogenesis is a promising target for dietary intervention since the bioavailability of polyphenols such as tea catechins can reach concentrations in the digestive tract that exceed their concentrations in other organs of the body (plasma, blood, or urine). The cancer chemopreventive activity of GT has been attributed mostly to its EGCG component. Several mechanisms of action for EGCG have been reported in a variety of in vivo and in vitro studies [7–9]. The overwhelming majority of these studies, however, used EGCG concentrations that were several fold higher than could be achieved physiologically, even in organs that retain higher levels of catechins such as the colon and small intestine [10]. In addition, the contribution of the other tea catechins to the biological activities of GT and the exact molecular mechanisms by which they inhibit colon carcinogenesis are still poorly understood.
Retinoids are the natural and synthetic derivatives of vitamin A. They display a broad spectrum of biological activities and have been shown to be involved in embryogenic development, growth and cellular proliferation and differentiation [11,12]. The biological activities of retinoids are primarily mediated via two classes of nuclear receptors: retinoic acid receptor (RAR) and retinoic X receptor (RXR) [13]. Each class consists of three receptor subtypes designated α, β, and γ [14]. The two retinoid receptor classes differ in their ligand affinities; the natural ligand for RARs is all-trans-retinoic acid (atRA) while the natural ligand for RXRs is 9-cis-retinoic acid (9-cRA). Retinoic receptors exist as homodimers or heterodimers and activate or inhibit the expression of their target genes upon ligand binding [15]. The target genes for RARs and RXRs usually contain sequences of the DNA known as retinoic acid responsive elements (RAREs) and retinoic X responsive elements (RXREs), respectively [14]. RAR and RXR subtypes are differentially expressed during embryogenesis and in human tissues [12]. The differential expression might be achieved by gene silencing of one or more subtypes of the retinoic receptors via hypermethylation [16,17]. Interestingly, the different expression patterns for each receptor subtype may determine the sensitivity of the tissue to retinoid treatment. This might explain the contradictory results of a wealth of in vivo and in vitro studies testing the potential use of retinoids as chemopreventive agents in models for several types of cancer [14,18,19].
In colon carcinogenesis, two main pathways have been reported to regulate the levels of cytoplasmic β-catenin [20,21]. The two pathways, glycogen synthase kinase-3β (GSK-3β) mediated and p53/Siah mediated, require functional APC. In addition, an APC-independent pathway has also been reported [22]. In this pathway, the degradation of β-catenin was mediated via RXRα despite the mutations in either APC or β-catenin. The degradation of cytoplasmic β-catenin was specifically induced by RXRα, but not RARα [23]. In contrast, an earlier study reported an inhibition of β-catenin/T-cell factor 4 (TCF-4) pathway that was mediated by RARα, but not RXRα. In the latter study, however, RARα was shown to inhibit the nuclear localization of β-catenin without significantly affecting its total levels. Both studies were conducted in cell cultures and their significance in vivo, however, has not yet been investigated.
RXRα has unique characteristics that distinguish it from the other RAR and RXR subtypes [15,24,25]. It is the most abundant of the RXR subtypes, it mediates the heterodimerization of RARs with other members in the thyroid hormone nuclear transcription receptor family, it is essential for the functional activation of RARs by their ligands, and it has the ability to form homodimers with itself or heterodimers with other nucleic receptors such as PPARγ and VitD. In addition, RXRα has been suggested to be a key player in the carcinogenesis of several types of cancer, including prostate, ovarian, skin, and leukemia [26–28]. The role of RXRα in colon carcinogenesis, however, is still poorly understood. The current study shows that RXRα is downregulated in a mouse model for colon cancer by GT constituents. The downregulation appeared to be an early event and was observed in all of the adenomas in the ApcMin/+ mouse model. In addition, the downregulation seemed to be specific to RXRα among all of the RAR and RXR subtypes.
MATERIALS AND METHODS
Animals and Treatments
One hundred sixty-two mice were used in the study; 120 male and female C57BL/6J-ApcMin/+ (ApcMin/+) mice and 42 wild-type C57BL/6J (B6) evenly divided by gender. The mice were housed in an animal research facility accredited by the AAA-LAC at the University of South Carolina. Treatment protocol was approved by the Institutional Animal Care and Use Committee (IACUC) at the University of South Carolina. The mice were kept on a light/dark (12/12 h) cycle, 20–24°C and 50% humidity. Mice were weaned at 3 wk of age and fed AIN76A diet ad libitum thereafter. The mice were split into four groups based on the type of analysis conducted on each group (Figure 1A). The B6 mice injected with azoxymethane (AOM) served as a control group for AOM-induced tumorigenesis. The groups were further divided into five equal subgroups based on the GT or AOM treatments (Figure 1A). AOM (purchased from Ash Stevens, Detroit, MI) was diluted to a final concentration of 8 mg/kg body weight with 0.9% saline solution on the day of injection and administered to the mice intraperitoneally (i.p.) once a week for 3 wk (Figure 1B). GT was a generous gift from Dr. C.S. Yang (Rutgers University, NJ). The GT stock was received as a GT powder and was HPLC analyzed (Table 1) to determine its composition. The same stock was used throughout the experiment to avoid any variations in the GT content. A fresh solution of 0.6% (w/v) was prepared every other day [5]. All the mice were sacrificed at 16 wk of age by cervical dislocation except for the group dedicated to the immunohistochemical analysis (IHC). The mice in the latter group were sacrificed after 12 wk (4 wk of GT treatment) in order to study the effects of GT on earlier neoplastic tumors. The mice were closely monitored and weighed weekly. Any mouse that lost more than 10% of its original body weight was excluded from the experiment.
Figure 1.

Experimental design of the study. (A) Male and female mice were categorized into four groups based on the type of analysis intended for each group as indicated by the schematic. Mice (C57BL/6J-ApcMin/+ (ApcMin/+ Min) and C57BL/6J (B6)) were randomized into the appropriate subgroups groups as shown in the table. IHC, immunohistochemical analysis. (B) Treatment protocol. Mice in Groups I–III were treated with AOM or 0.9% saline followed by 0.6% (w/v) green tea or water as indicated in the schematic.
Table 1.
HPLC Analysis of Green Tea Polyphenols
| Compound | Weight percent in stock | Amount in 200 mL of 0.6% GT solution (mg) |
|---|---|---|
| Epicatechin (EC) | 3.8 | 46 |
| Epigallocatechin (EGC) | 8.7 | 104 |
| Epicatechin gallate (ECG) | 4.3 | 52 |
| Epigallocatechin gallate (EGCG) | 15.1 | 180 |
| Gallic acid (GA) | 0.2 | 2.4 |
| Caffeine | 5.4 | 65 |
Tumor Count and Size Comparison
Colons and small intestines were removed, flushed with ice-cold phosphate-buffered saline (PBS), slit open along the longitudinal median and fixed flat in 10% buffered formalin for 24 h. The fixed tissues were stained with 0.2% methylene blue (Sigma-Aldrich, St. Louis, MO) dissolved in PBS. Tumors were scored at 30× magnification using a Nikon dissecting microscope with a fiber optic light source to illuminate the tissues and a calibration scale to determine the tumor size. Tumors with diameters ≤1 mm (1–5 crypts) were classified as small tumors, whereas tumors that exceeded 1 mm (>6 crypts) in diameter were classified as large tumors. All the tumors were scored by the same investigator who was blind to the treatment groups. No tumors were found in any of the B6 mice.
Immunohistochemical Analysis
The colons and small intestines were fixed as described above, but Swiss-rolled before fixation. Fixed tissues were paraffin embedded, cut into 5 μm sections, mounted on slides, and processed for immunoblotting as described previously [29]. Sections were incubated for 45 min with one of the following primary antibodies. Mouse monoclonal anti-β-catenin antibody (BD Transduction Laboratories, Lexington, KY) diluted 1:300. Rabbit monoclonal anti-TCF-4 and anti-cyclin D1 (SP4) antibodies (Lab Vision/Neomarkers, Fremont, CA) diluted 1:100. Rabbit polyclonal anti- RXRα, RXRγ, or RARα antibodies and rabbit polyclonal anti-APC antibody specific to the C-terminus (Santa Cruz Biotechnology, Santa Cruz, CA) each diluted 1:200. Rabbit polyclonal anti-RXRβ or RARβ antibodies (Chemicon International, Temecula, CA) each diluted 1:200. Mouse polyclonal anti-COX-2 antibody (Caymen Chemical, Ann Arbor, MI) diluted 1:400. Mouse monoclonal anti-DNMT1 antibody (Abcam, Inc., Cambridge, MA) diluted 1:200. Blocking of the sections and detection of the anti-β-catenin, cyclin D1, RXRβ, RARβ, and DNMT1 antibodies was by ACUITY polymer detection kit, which consisted of a special polymer for pre- and post-primary antibody incubation (Signet Laboratories, Dedham, MA) according to the manufacturer’s instructions. Detection of the other antibodies was by CSA II Biotin-Free Catalyzed Signal Amplification System (DakoCytomation, Carpinteria, CA) according to the manufacturer’s instructions. Nonspecific binding was blocked by incubating the sections with normal goat serum (BioGenex, San Ramon, CA) for 20 min at room temperature. Evaluation of the staining was carried out by dividing the tumors with abnormal staining into three types based on their size. Small lesions consisted of 1–5 crypts. Medium lesions consisted of 6–10 crypts. Large lesions consisted of more than 10 crypts. The evaluation of the COX-2 staining was carried out by counting number of lesions expressing COX-2 without further classification. All the tumors were scored at 100× magnification by the same investigator who was blind to the treatment groups. The entire small intestine and colon were scored for tumors in each mouse and the average number of each type of tumors per animal was determined. Human samples of normal colon and colon carcinoma were collected from patients after surgery at Palmetto Richland Hospital (Columbia, SC). They were immediately fixed in buffered formalin for 24 h then processed and paraffin embedded. A total of four normal colon samples and eight colon adenocarcinomas were collected from different patients. The human samples served as controls to confirm the relevance of the immunohistochemical findings in ApcMin/+polyps to human tumors.
RNA Isolation and Real-Time PCR
Mucosal layers were scraped and flash frozen in liquid nitrogen then kept at −80°C until the day of isolation. Total RNA was isolated using the TRI Reagent® total RNA isolation method (Molecular Research Center, Cincinnati, OH) according to the manufacturer’s instructions. The quality and quantity of the isolated RNA were determined by the Agilent-2100 Bioanalyzer system (Agilent Technologies, Santa Clara, CA) according to the manufacturer’s instructions. RT-PCR reactions were carried out in an iCycler Thermal cycler with MyiQ Real-Time PCR Detection System (Bio-Rad, Hercules, CA). One hundred nanograms of the isolated total RNA per reaction was reverse transcribed followed by amplification of specific mRNAs using the iScript One-Step RT-PCR kit with SYBR Green (Bio-Rad) according to the manufacturer’s protocol at an annealing temperature of 60°C. Primers for mouse RXRα and glyceraldehyde-3-phosphate dehydrogenase (GAPDH) as an intrinsic control have been described previously [30]. The following primer sequences were used. RXRα forward: 5′-CTTTGACA-GGGTGCTAACAGAGC-3′, reverse: 5′-ACGCTTCTAGTGACGCATACACC-3′. GAPDH, forward: 5′-GGGTGGAGCCAAACGGGTC-3′, reverse: 5′-GGAGTTGCTGTTGAAGTCGCA-3′. Total RNAs from at least three mice per treatment group were evaluated. Quantitation of the RT-PCR data was performed using MyiQ software (Bio-Rad). The data are the average of at least three experiments adjusted to the intrinsic control and represents the levels of RXRα mRNA in the treatment groups relative to the B6 mice. Error bars represent SEM.
DNA Isolation, Bisulfite Treatment, and Pyrosequencing
Genomic DNA was isolated from mucosal scrapings using the TRI Reagent® total RNA isolation method (Molecular Research Center), which allows the isolation of both RNA and DNA from the same samples, according to the manufacturer’s instructions. The DNA was then diluted with tris-buffered saline (TBS), which consisted of 50 mM Tris–HCl, 150 mM NaCl, and 0.1 mM EDTA, pH 7.6. Concentrations of the isolated genomic DNA were determined using a SmartSpec Plus Spectrophotometer (Bio-Rad) according to the manufacturer’s instructions. Five hundred nanograms of the isolated DNA per sample was bisulfite treated using the EZ DNA Methylation Kit™ (Zymo Research, Orange, CA) following the manufacturer’s instructions. The sequence of the mouse RXRα gene(Rxra) [Entrez Gene ID 20181; Ensemble Gene ENSMUSG00000015846] and its 5′ upstream region was analyzed for the presence of CpG islands using MethPrimer software (Urology Research Center, University of California, CA) as described previously [31]. Analysis of the DNA sequence of the first exon and a 1000 bp 5′-upstream of RXRα (a total of 1197 bp) revealed that two CpG islands existed (a size of 114 bp, 5′–3′ 148–261 and a size of 698 bp, 5′–3′ 445–1142, respectively). Ten nanograms of the bisulfite-treated DNA per sample was PCR amplified (covering a sequence of 320 bp in the larger CpG island) then pyrosequenced to determine the percent methylation of selected CpG sites as described previously [32,33]. Primer sequences were as follows: Forward primer: 5′-TTGGGAATTTTTGGTAGATGTAA-3′ (position 689–711), reverse biotinylated primer (position 1008–984): 5′-biotin-CCCAACAATATAAACTACTTATACC-3′, sequencing primer 1 (position 711–729): 5′-AATTTGTAAGTTTGTAGGG-3′, sequencing primer 2 (position 815–833): 5′-GGTTGYGGGYGGGGYGAGT-3′, and sequencing primer 3 (position 907–925): 5′-GTTGTAGGTYGGGTYGGAG-3′. Pyrosequencing and methylation analysis were performed by an independent lab (Biotage, Foxboro, MA) that was blind to the treatment groups.
Samples from at least two mice per group were analyzed. A total of 24 CpG sites per sample were analyzed and the average percent methylation per site was calculated. The presented data are relative to percent methylation in the B6 subgroup. Error bars represent SEM.
Statistical Analysis
All data were analyzed using Sigmastat V3.0 (SPSS, Chicago, IL) and SAS V8.2e (SAS Institute, Cary, NC) softwares. Descriptive statistics were used to identify the distribution of the data. A two-way ANOVA test was used to compare the treatment groups in the presence or absence of AOM or GT. For data that failed the normality test, generalized linear models were used to compare the groups. In this case, the data were modeled after a Poisson distribution when appropriate. Alternatively, a negative binomial distribution model was followed when the data exhibited an overdispersion. The analyses included testing for the main effects of AOM or GT in the treatment groups and for interactions between the treatments. The data were considered very significant if P <0.005, significant if P <0.05, marginally significant if 0.05 ≤P <0.1, and insignificant if P ≥0.1
RESULTS
Green Tea Inhibits the Formation of ApcMin/+ Tumors
Mice treated with GT (10 per treatment group) had a 50% reduction in the colonic tumors (1.8–0.9 tumors per mouse, P <0.05) compared to water-treated mice and about 18% reduction in the number of ApcMin/+ tumors developed in the small intestine (40–33 tumors per mouse, P <0.1) (Figure 2A). The reduction in colon and small intestinal tumors with GT treatment was mainly due to a reduction in the number of newly developed “small” tumors (diameter ≤1.0 mm) with no significant effects on large tumors (diameter ≥1.0 mm; 1–5 crypts). (28% reduction in small tumors; 17.3–12.5 tumors per mouse, P <0.05 and 11% reduction in large tumors; 23.4–20.8, P >0.1) (Figure 2B).
Figure 2.

(A) Green tea caused a statistically significant reduction in colon tumors. 0.6% solution of green tea was effective at inhibiting AOM-induced colon and small intestinal tumors in the ApcMin/+ mice. Error bars represent SEM. *P <0.05, ●P <0.1. (B) The inhibitory effect of green tea was primarily due to reduction in the number of newly developed tumors (≤1 mm in diameter, 1–5 crypts). Large tumors (>10 crypts) were not significantly affected by the tea treatment.
Green Tea Selectively Affects Early Changes in Intestinal Carcinogenesis
Quantitative analysis of immunohistochemical staining of β-catenin, cyclin D1, RXRα, and COX-2 showed a selective inhibition of expression in small tumors by GT. The aim of the IHC was to confirm whether or not the inhibitory effects of GT on ApcMin/+ tumors could be explained by any modulation of biomarkers involved in intestinal carcinogenesis. Tumors were scored as described in the Materials and Methods Section (Figure 3). The GT intervention caused a statistically significant reduction in the number of small tumors overexpressing β-catenin, but no inhibition of large or medium tumors (32% reduction in average small tumors per mouse, P <0.05 and 10% reduction in large tumors, P >1.0) compared to water-treated mice. All the tumors were scored at a 100× magnification. In correlation with β-catenin overexpression, only the number of small tumors overexpressing cyclin D1 was significantly reduced by the GT treatment compared to water (38% reduction in small tumors, P <0.05 and 12% reduction in large tumors, P >1.0) (Figure 4). GT also caused a statistically significant reduction in the number of small tumors in which RXRα was downregulated with slight inhibition of large tumors (48% reduction in small adenomas per mouse, P <0.05 and 13% reduction in large adenomas, P >1.0) compared to water-treated mice. The downregulation of RXRα seems to be a very early event in ApcMin/+ carcinogenesis and was observed even in single crypts (Figure 3B). GT at a 0.6% (w/v) concentration was not significantly effective in reducing the number of tumors expressing COX-2 (11% reduction in the average number of tumors per mouse) (Figure 4D).
Figure 3.
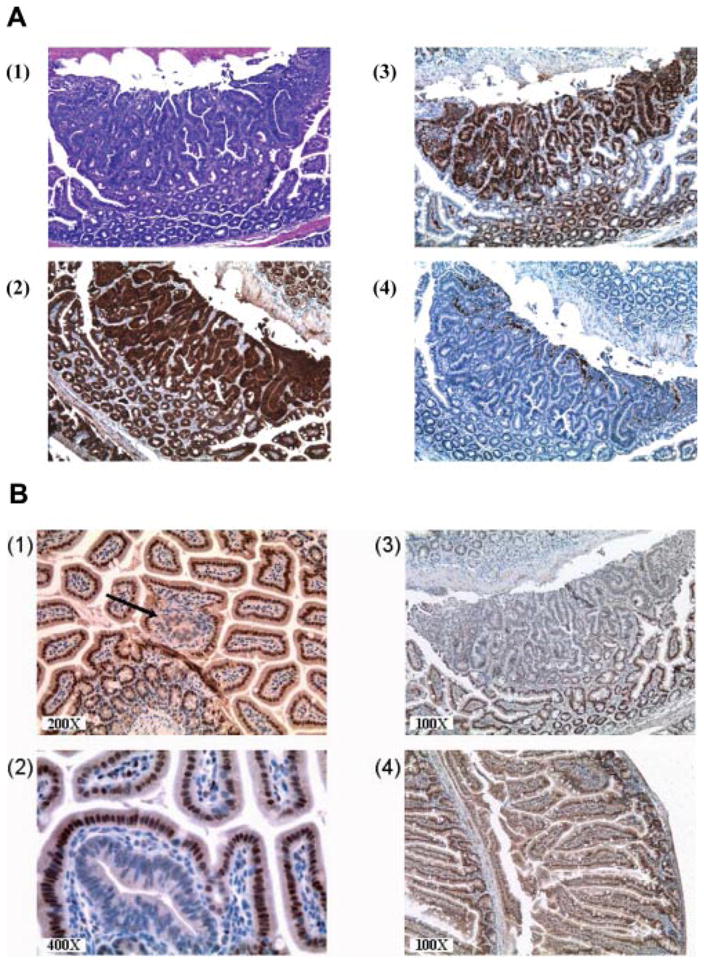
(A) Immunohistochemical staining of a large lesion with >10 crypts. (1) H&E staining. (2) Staining for β-catenin. (3) Cyclin D1. (4) COX-2. All the pictures shown are at 100× magnification. (B) Immunohistochemical staining of tumors in which RXRα is downregulated in ApcMin/+ mice. The downregulation of RXRα is an early event in ApcMin/+ intestinal carcinogenesis and is observed in single crypts in (1, black arrow) and (2) and in large tumors (3). Normal appearing mucosa in ApcMin/+ mice and all B6 normal intestinal epithelia express RXRα with mostly nuclear and also cytoplasmic staining (4).
Figure 4.

Expression of biomarkers in lesion in early tumors from ApcMin/+ mice treated with water or green tea. All of the mice were sacrificed after 12 wk of age. Early tumors, having 1–5 crypts per lesion, were scored at a 100× magnification. Error bars represent SEM. (A) Quantitative analysis of β-catenin and cyclin D1. (B) Quantitative analysis of RXRα and COX-2.
Full-length APC was not detected in any of the ApcMin/+ adenomas and we did not observe any difference with the GT treatment (Figure 5A). On the other hand, TCF-4 was expressed in all ApcMin/+ adenomas (Figure 5B). DNMT1 was overexpressed in all of the ApcMin/+ adenomas and the observed expression was directly proportional to the size of the adenoma (Figure 5C).
Figure 5.

(A) Immunohistochemical staining of polyps in ApcMin/+ mice for APC. Full-length APC was lost in all ApcMin/+ adenomas as determined by immunohistochemical staining with an anti-APC antibody specific to the C-terminus. (1) ApcMin/+ polyp adjacent to normal looking epithelia showing the loss of full-length APC (black arrow). (2) Normal epithelia from a wt B6 mouse stained for APC. (B) Immunohistochemical staining of polyps in ApcMin/+ mice for TCF-4. TCF-4 was expressed in all ApcMin/+ tumors and normal epithelia. (1) ApcMin/+ polyp expressing TCF-4 (black arrow) adjacent to normal looking colon. (2) Wt B6 colon expressing TCF-4. (C) Immunohistochemical staining for polyps (1) and (2) in ApcMin/+ mice for DNMT1 (black arrows). DNMT1 was overexpressed in all of the ApcMin/+ adenomas. The expression correlated with the size of the polyps and the degree of dysplasia.
RXRα Is Selectively Downregulated in ApcMin/+ Tumors
In order to ask whether or not other retinoic receptors were also downregulated in the ApcMin/+ tumors, we stained for the following retinoic receptors: RARα, RXRβ, RARβ, and RXRγ (Figure 6A). None of these retinoic receptors were downregulated even in the large tumors. The downregulation of RXRα was also seen in B6 mice injected with AOM (Figure 6B). These mice were much more resistant to AOM-induced tumorigenesis compared to the ApcMin/+ mice. We did notice, however, few areas of hyperplasia in the small intestine, but not the colon, of some of these ApcMin/+ mice. The hyperplastic epithelia appeared to exhibit normal APC expression and slightly increased β-catenin expression, but without nuclear localization (Figure 6C). In order to confirm the relevance of RXRα downregulation in the ApcMin/+ tumors to the human colon carcinogenesis, several samples of normal human colon and adenocarcinomas were stained for RXRα and RARβ (Figure 7). Similar to the ApcMin/+ adenomas, human adenocarcinomas showed a reduction in the expression of RXRα, but not RARβ; further emphasizing the role that RXRα might play in modulating colon carcinogenesis. While staining for RXRα was evident in all four normal colons, RXRα was persistently lost or weakly expressed in the eight specimens of human adenocarcinomas.
Figure 6.

RXRα is selectively downregulated in ApcMin/+ adenomas. (A) ApcMin/+ adenomas were stained for the following retinoic receptors: (1) RARα, (2) RARβ, (3) RXRβ, and (4) RXRγ. None of these retinoic receptors is downregulated in ApcMin/+ Min/+ adenomas as shown in the figures (black arrows). (B) RXRα is downregulated in hyperplastic epithelia of B6 mice treated with AOM. The down-regulation of RXRα (black arrow) compared to normal looking crypts at the top of the hyperplastic region (2) or normal looking epithelia (1). (C) Hyperplastic regions in small intestine of B6 mice injected with AOM. These regions show slightly increased expression, but normal localization of β-catenin (1), increased cyclin D1 expression (2), no COX-2 expression (3), and normal APC expression (4).
Figure 7.

RXRα was downregulated in human colon adenocarcinomas. Picture (1) shows a normal human colon tissue stained for RARβ. (2) shows a human adenocarcinoma stained for RARβ. RAR β is extensively expressed in the adenocarcinoma. (3) RXRα staining in normal human colon tissue. (4) RXRα staining in a human adenocarcinoma.
The Downregulation of RXRα Correlates With Loss of Its mRNA
Quantitative RT-PCR analysis was conducted to determine the levels of RXRα mRNA in ApcMin/+ mice in the treatment groups. As expected, the greatest loss was in the AOM plus water group (Figure 8). The presented data are relative to the B6 mice (wt control) that lacked tumors, therefore exhibited the highest levels of RXRα mRNA. Overall, the RT-PCR analysis showed a 2.1-fold greater loss of RXRα mRNA in the absence of tea treatment (21% and 10% loss relative to B6 mRNA, in water vs. GT-treated mice, respectively).
Figure 8.

(A) RT-PCR analysis of RXRα mRNA levels in ApcMin/+ mice. Each lane contained 100 ng of total RNA and data were adjusted to GAPDH expression (loading controls). The data are presented relative to RXRα mRNA in the wt (B6). (B) Overall percent loss of RXRα mRNA in ApcMin/+ mice relative to B6 mice. The loss in RXRα mRNA was 2.1-fold greater in the absence of green tea treatment (21% and 10% in water vs. green tea-treated mice, respectively). *P <0.05.
Green Tea Inhibits the Methylation of RXRα Gene
Analysis of the DNA sequence of the first exon and a 1000 bp 5′-upstream of the RXRα gene showed that two CpG islands existed (Figure 9A). Primers were designed to amplify a region of 320 bp in the larger CpG island, after bisulfite treatment of the genomic DNA. The region spans the 5′-upstream area immediately adjacent to the first exon and part of the exon. We selected a total of 24 CpG sites to be analyzed by pyrosequencing, out of a total of 55 CpG sites present in the amplified PCR product. Three sequencing primers were designed to analyze the selected CpG sites. The CpG sites displayed variations in their percent of methylation and some seemed to be more prone to methylation than others. CpG site number 3 (third underlined site from the 5′ end in Figure 9A) exhibited the highest percent of methylation among the 24 selected CpG sites. The average percent of methylation per CpG site was calculated as an indication of the overall methylation of the promoter region of the RXRα gene. In correlation with the protein and RNA data, a statistically significant increase in the average methylation of the CpG sites was observed in ApcMin/+ mice injected with AOM and received water compared to the mice that received GT. Overall, there was more than a twofold relative increase in CpG methylation in the ApcMin/+ mice that received water compared to the mice that received GT (56% and 27% greater average methylation than the wt control, respectively, P = 0.09).
Figure 9.

(A) Analysis of the DNA sequence of the first exon and 1000 bp 5′-upstream of the RXRα gene. Two CpG islands exist in this sequence and they are marked in the figure by gray background shading. Three sets of primers were used to amplify a region of 320 bp in the larger CpG island (marked by grey background and separated by black background) after bisulfite treatment of the genomic DNA. A total of 24 CpG sites (underlined in the figure) were pyrosequenced and analyzed for methylation. (B) Methylation analysis of the CpG sites in the promoter region of RXRα. Methylation of the CpG sites in AOM plus water group was significantly increased as compared to AOM plus green tea (P <0.05). The values represent the average methylation of the 24 CpG sites relative to the wt B6 RXRα gene. Error bars represent the SEM. *P <0.05.
DISCUSSION
We investigated the possible cancer protective mechanisms of GT in the ApcMin/+ mouse model. We have optimized a protocol to increase the number of colon tumors by injecting the ApcMin/+ mice with the colon selective carcinogen, AOM. Our protocol provides a reliable and convenient approach to increase the yield of colon tumors and circumvents a general liability of the standard ApcMin/+ mouse model. We used this improved protocol to study if and how physiological concentrations of GT might inhibit colon carcinogenesis. We chose a concentration of 0.6% of GT, since it provides similar concentrations of tea catechins in a typical GT beverage [5]. The number of “small” tumors was significantly reduced in colon and small intestines of GT-treated ApcMin/+ mice with only slight reduction in the number of larger tumors. The data suggest that GT, at a 0.6% (w/v) concentration, selectively targets the development of early tumors in the AOM-ApcMin/+ mouse model without affecting the established, larger tumors. Early adenomas are most likely the consequence of AOM treatment on ApcMin/+ compromised mucosa. Our results indicate that the time of administration of GT is pivotal to its maximizing its ability to inhibit colon carcinogenesis; physiological levels of GT are not likely to inhibit the progress of any large adenomas or adenocarcinomas existing prior to the tea administration. This is consonant with epidemiology of GT drinking and results from phase 1 trials [6,34].
To explain the ability of GT to inhibit the formation of new adenomas, we examined the possible modulation of several biomarkers known to be involved in colon carcinogenesis. These included β-catenin, cyclin D1, and COX-2. In accordance with the tumor data, GT inhibited the formation of small (1–5 crypts) tumors overexpressing β-catenin and its downstream target cyclin D1. Surprisingly, we did not observe any significant inhibitory effects of GT on COX-2 expression indicating that the inhibition of COX-2 expression by tea catechins is only likely to be achieved at concentrations far exceeding their concentrations provided by a typical tea beverage.
Interactions between retinoic receptors and the Wnt pathway have been reported previously [22,35,36]. The current study is the first to report that RXRα is downregulated in ApcMin/+ tumors. The decrease seems to be an early event in ApcMin/+ intestinal tumorigenesis and was observed even in single crypts and in the mucosa of AOM-treated B6 mice. These crypts had normal localization of β-catenin, but loss of RXRα (Figure 6). In addition, unlike β-catenin and cyclin D1 the increased expression of RXRα with GT treatment was observed even in the absence of AOM treatment (Western blotting, data not shown). Therefore, the loss of RXRα seems to be a separate event that does not necessarily correlate with β-catenin overexpression and nuclear localization. RXRα has been shown to induce the degradation of β-catenin in vitro [22]. Our results support a novel role for RXRα in an in vivo animal model for colon carcinogenesis. We observed the downregulation of RXRα in all of the AOM/ApcMin/+ neoplastic lesions regardless of their size. In addition, the downregulation was specific to RXRα of all the other retinoic receptors (Figure 6) and PPARγ (data not shown); it was also observed in human colon carcinomas. In fact, RXRα has been reported in some types of cancer to be a predictive of prognosis [37] and it may play a similar role in colon carcinogenesis.
We have shown in this study that GT reduced the loss of RXRα mRNA and inhibited the methylation of its gene. Silencing of retinoic receptors by hypermethylation has been reported in several types of cancer with particular emphasis on the role RARβ as a tumor suppressor [38]. Three methyltransferases have been linked to genomic methylation. DNA methyltransferases 3a and 3b (DNMT3a and DNMT3b) are involved in de novo methylation patterns. The predominant nuclear DNA methyl-transferase, however, is DNMT1, which is involved in both genomic methylation and the maintenance of the methylation patterns. The inhibition of DNA methyltransferases, particularly DNMT1, has been shown to reverse the hypermethylation and restore the expression of silenced genes [39,40]. Interestingly, EGCG has been documented to dose-dependently inhibit DNMT1 activity, showing competitive inhibition with a Ki of 6.89 μM. Consequently, the same study showed that EGCG caused a time- and concentration-dependent reversal of hypermethylation of a variety of genes involved in growth control and cellular differentiation. In another study, EGCG was found to be the most potent of the tea catechins and was able to significantly inhibit DNMT1 at a concentration of less than 1 μM [40].
The loss of RXRα could be the result of either mutation or silencing of the gene encoding for it. The ability of GT to increase the levels of RXRα in ApcMin/+ mucosa, however, suggests a reversible downregulation, that is, desilencing a promiscuous nuclear receptor that affects multiple signaling pathways. The current study shows that the reduction in the RXRα protein levels correlated with a reduction in the mRNA levels and an increase in the methylation status of the promoter region of the RXRα gene. GT treatment resulted in inhibition of the methylation of the RXRα gene, increase in its mRNA levels, and consequent increase in the protein levels in ApcMin/+ intestinal mucosa. Further research is required to fully investigate the role of RXRα in colon carcinogenesis. RXRα could potentially become a key target for the prevention and therapy of colon cancer and possibly other types of cancer, since its levels can be restored, as shown in this study, by bioactive phytochemicals in GT.
Acknowledgments
The authors wish to thank Hannah Lane and Dina Brown for critical reading of this manuscript and Dr. Jay Morris for his assistance in preparation of the manuscript. This work was supported by grant from the National Institutes of Health (NIH Grant CA 96994).
Abbreviations
- GT
green tea
- EGCG
(−)-epigallocatechin gallate
- RAR
retinoic acid receptor
- RXR
retinoic X receptor
- TCF-4
T-cell factor 4
- AOM
azoxymethane
References
- 1.Jemal A, Siegel R, Ward E, Murray T, Xu J, Thun MJ. Cancer statistics, 2007. CA Cancer J Clin. 2007;57:43–66. doi: 10.3322/canjclin.57.1.43. [DOI] [PubMed] [Google Scholar]
- 2.Koo MW, Cho CH. Pharmacological effects of green tea on the gastrointestinal system. Eur J Pharmacol. 2004:177–185. doi: 10.1016/j.ejphar.2004.07.023. [DOI] [PubMed] [Google Scholar]
- 3.Jung YD, Kim MS, Shin BA, et al. EGCG, a major component of green tea, inhibits tumour growth by inhibiting VEGF induction in human colon carcinoma cells. Br J Cancer. 2001:844–850. doi: 10.1054/bjoc.2000.1691. [DOI] [PMC free article] [PubMed] [Google Scholar]
- 4.Raederstorff DG, Schlachter MF, Elste V, Weber P. Effect of EGCG on lipid absorption and plasma lipid levels in rats. J Nutr Biochem. 2003:326–332. doi: 10.1016/s0955-2863(03)00054-8. [DOI] [PubMed] [Google Scholar]
- 5.Yang CS. Inhibition of carcinogenesis by tea. Nature. 1997:134–135. doi: 10.1038/38154. [DOI] [PubMed] [Google Scholar]
- 6.Arab L, Il’yasova D. The epidemiology of tea consumption and colorectal cancer incidence. J Nutr. 2003:3310S–3318S. doi: 10.1093/jn/133.10.3310S. [DOI] [PubMed] [Google Scholar]
- 7.Tedeschi E, Suzuki H, Menegazzi M. Antiinflammatory action of EGCG, the main component of green tea, through STAT-1 inhibition. Ann N Y Acad Sci. 2002:435–437. doi: 10.1111/j.1749-6632.2002.tb04678.x. [DOI] [PubMed] [Google Scholar]
- 8.Chung JY, Park JO, Phyu H, Dong Z, Yang CS. Mechanisms of inhibition of the Ras-MAP kinase signaling pathway in 30.7b Ras 12 cells by tea polyphenols (−)-epigallocatechin-3-gallate and theaflavin-3,3′-digallate. FASEB J. 2001:2022–2024. doi: 10.1096/fj.01-0031fje. [DOI] [PubMed] [Google Scholar]
- 9.Park AM, Dong Z. Signal transduction pathways: Targets for green and black tea polyphenols. J Biochem Mol Biol. 2003:66–77. [PubMed] [Google Scholar]
- 10.Yang CS, Maliakal P, Meng X. Inhibition of carcinogenesis by tea. Annu Rev Pharmacol Toxicol. 2002:25–54. doi: 10.1146/annurev.pharmtox.42.082101.154309. [DOI] [PubMed] [Google Scholar]
- 11.Lotan R. Retinoids and their receptors in modulation of differentiation, development, and prevention of head and neck cancers. Anticancer Res. 1996:2415–2419. [PubMed] [Google Scholar]
- 12.Morriss-Kay GM, Ward SJ. Retinoids and mammalian development. Int Rev Cytol. 1999:73–131. doi: 10.1016/s0074-7696(08)61566-1. [DOI] [PubMed] [Google Scholar]
- 13.De Luca LM. Retinoids and their receptors in differentiation, embryogenesis, and neoplasia. FASEB J. 1991:2924–2933. [PubMed] [Google Scholar]
- 14.Okuno M, Kojima S, Matsushima-Nishiwaki R, et al. Retinoids in cancer chemoprevention. Curr Cancer Drug Targets. 2004:285–298. doi: 10.2174/1568009043333023. [DOI] [PubMed] [Google Scholar]
- 15.Berrodin TJ, Marks MS, Ozato K, Linney E, Lazar MA. Heterodimerization among thyroid hormone receptor, retinoic acid receptor, retinoid X receptor, chicken ovalbumin upstream promoter transcription factor, and an endogenous liver protein. Mol Endocrinol. 1992:1468–1478. doi: 10.1210/mend.6.9.1331778. [DOI] [PubMed] [Google Scholar]
- 16.Farias EF, Arapshian A, Bleiweiss IJ, Waxman S, Zelent A, Mira YL. Retinoic acid receptor alpha2 is a growth suppressor epigenetically silenced in MCF-7 human breast cancer cells. Cell Growth Differ. 2002:335–341. [PubMed] [Google Scholar]
- 17.Wang Y, Fang MZ, Liao J, et al. Hypermethylation-associated inactivation of retinoic acid receptor beta in human esophageal squamous cell carcinoma. Clin Cancer Res. 2003:5257–5263. [PubMed] [Google Scholar]
- 18.Li LC, Dahiya R. MethPrimer: Designing primers for methylation PCRs. Bioinformatics. 2002:1427–1431. doi: 10.1093/bioinformatics/18.11.1427. [DOI] [PubMed] [Google Scholar]
- 19.Tanaka T, Dancheck BL, Trifiletti LC, et al. Altered localization of retinoid X receptor alpha coincides with loss of retinoid responsiveness in human breast cancer MDA-MB-231 cells. Mol Cell Biol. 2004:3972–3982. doi: 10.1128/MCB.24.9.3972-3982.2004. [DOI] [PMC free article] [PubMed] [Google Scholar]
- 20.Giles RH, van Es JH, Clevers H. Caught up in a Wnt storm: Wnt signaling in cancer. Biochim Biophys Acta. 2003:1–24. doi: 10.1016/s0304-419x(03)00005-2. [DOI] [PubMed] [Google Scholar]
- 21.Kikuchi A, Kishida S, Yamamoto H. Regulation of Wnt signaling by protein-protein interaction and post-translational modifications. Exp Mol Med. 2006:1–10. doi: 10.1038/emm.2006.1. [DOI] [PubMed] [Google Scholar]
- 22.Xiao JH, Ghosn C, Hinchman C, et al. Adenomatous polyposis coli (APC)-independent regulation of beta-catenin degradation via a retinoid X receptor-mediated pathway. J Biol Chem. 2003:29954–29962. doi: 10.1074/jbc.M304761200. [DOI] [PubMed] [Google Scholar]
- 23.Easwaran V, Pishvaian M, Salimuddin, Byers S. Cross-regulation of beta-catenin-LEF/TCF and retinoid signaling pathways. Curr Biol. 1999:1415–1418. doi: 10.1016/s0960-9822(00)80088-3. [DOI] [PubMed] [Google Scholar]
- 24.Bugge TH, Pohl J, Lonnoy O, Stunnenberg HG. RXR alpha, a promiscuous partner of retinoic acid and thyroid hormone receptors. EMBO J. 1992:1409–1418. doi: 10.1002/j.1460-2075.1992.tb05186.x. [DOI] [PMC free article] [PubMed] [Google Scholar]
- 25.Froeschle A, Carnac G, Alric S, et al. RXR alpha is essential for mediating the all-trans retinoic acid-induced growth arrest of C2 myogenic cells. Oncogene. 1996:411–421. [PubMed] [Google Scholar]
- 26.Dahiya R, Park HD, Cusick J, Vessella RL, Fournier G, Narayan P. Inhibition of tumorigenic potential and prostate-specific antigen expression in LNCaP human prostate cancer cell line by 13-cis-retinoic acid. Int J Cancer. 1994:126–132. doi: 10.1002/ijc.2910590122. [DOI] [PubMed] [Google Scholar]
- 27.Wu S, Zhang D, Zhang ZP, Soprano DR, Soprano KJ. Critical role of both retinoid nuclear receptors and retinoid-X-receptors in mediating growth inhibition of ovarian cancer cells by all-trans retinoic acid. Oncogene. 1998:2839–2849. doi: 10.1038/sj.onc.1202208. [DOI] [PubMed] [Google Scholar]
- 28.Agarwal C, Chandraratna RA, Teng M, Nagpal S, Rorke EA, Eckert RL. Differential regulation of human ectocervical epithelial cell line proliferation and differentiation by retinoid X receptor- and retinoic acid receptor-specific retinoids. Cell Growth Differ. 1996:521–530. [PubMed] [Google Scholar]
- 29.Shao Z, Shen Z, Fontana JA. Expression of the retinoic acid nuclear receptors and retinoid X receptor gene in human breast cancer. Zhonghua Zhong Liu Za Zhi. 1995:425–428. [PubMed] [Google Scholar]
- 30.Nishizawa H, Manabe N, Morita M, Sugimoto M, Imanishi S, Miyamoto H. Effects of in utero exposure to bisphenol A on expression of RARalpha and RXRalpha mRNAs in murine embryos. J Reprod Dev. 2003:539–545. doi: 10.1262/jrd.49.539. [DOI] [PubMed] [Google Scholar]
- 31.Colella S, Shen L, Baggerly KA, Issa JP, Krahe R. Sensitive and quantitative universal pyrosequencing methylation analysis of CpG sites. Biotechniques. 2003:146–150. doi: 10.2144/03351md01. [DOI] [PubMed] [Google Scholar]
- 32.Dupont JM, Tost J, Jammes H, Gut IG. De novo quantitative bisulfite sequencing using the pyrosequencing technology. Anal Biochem. 2004:119–127. doi: 10.1016/j.ab.2004.05.007. [DOI] [PubMed] [Google Scholar]
- 33.Tost J, Dunker J, Gut IG. Analysis and quantification of multiple methylation variable positions in CpG islands by pyrosequencing. Biotechniques. 2003:152–156. doi: 10.2144/03351md02. [DOI] [PubMed] [Google Scholar]
- 34.Yang CS, Prabhu S, Landau J. Prevention of carcinogenesis by tea polyphenols. Drug Metab Rev. 2001:237–253. doi: 10.1081/dmr-120000651. [DOI] [PubMed] [Google Scholar]
- 35.Byers S, Pishvaian M, Crockett C, et al. Retinoids increase cell-cell adhesion strength, beta-catenin protein stability, and localization to the cell membrane in a breast cancer cell line: A role for serine kinase activity. Endocrinology. 1996:3265–3273. doi: 10.1210/endo.137.8.8754749. [DOI] [PubMed] [Google Scholar]
- 36.Schmitt-Graff A, Ertelt V, Allgaier HP, et al. Cellular retinol-binding protein-1 in hepatocellular carcinoma correlates with beta-catenin, Ki-67 index, and patient survival. Hepatology. 2003:470–480. doi: 10.1053/jhep.2003.50321. [DOI] [PubMed] [Google Scholar]
- 37.Buentig N, Stoerkel S, Richter E, Dallmann I, Reitz M, Atzpodien J. Predictive impact of retinoid X receptor-alpha-expression in renal-cell carcinoma. Cancer Biother Radiopharm. 2004:331–342. doi: 10.1089/1084978041425007. [DOI] [PubMed] [Google Scholar]
- 38.Li R, Saito T, Tanaka R, et al. Hypermethylation in promoter region of retinoic acid receptor-beta gene and immunohistochemical findings on retinoic acid receptors in carcinogenesis of endometrium. Cancer Lett. 2005:33–40. doi: 10.1016/j.canlet.2004.06.044. [DOI] [PubMed] [Google Scholar]
- 39.Fang MZ, Wang Y, Ai N, et al. Tea polyphenol (−)-epigallocatechin-3-gallate inhibits DNA methyltransferase and reactivates methylation-silenced genes in cancer cell lines. Cancer Res. 2003:7563–7570. [PubMed] [Google Scholar]
- 40.Lee WJ, Shim JY, Zhu BT. Mechanisms for the inhibition of DNA methyltransferases by tea catechins and bioflavonoids. Mol Pharmacol. 2005:1018–1030. doi: 10.1124/mol.104.008367. [DOI] [PubMed] [Google Scholar]