Abstract
Menisci play a crucial role in weight distribution, load bearing, shock absorption, lubrication, and nutrition of articular cartilage within the knee joint. Damage to the meniscus typically does not heal spontaneously due to its partial avascular nature. Partial or complete meniscectomy is a common clinical treatment of the defective meniscus. However, this procedure ultimately leads to osteoarthritis due to increased mechanical stress to the articular cartilage. Meniscus tissue engineering offers a promising solution for partial or complete meniscus deficiency. Mesenchymal stem cells (MSC) have the potential to differentiate into meniscal fibrochondrocyte as well as deliver trophic effects to the differentiated cells. This study tested the feasibility of using MSC co-cultured with mature meniscal cells (MC) for meniscus tissue engineering. Structured cell pellets were created using MC and MSC at varying ratios (100:0, 75:25, 50:50, 25:75, and 0:100) and cultured with or without transforming growth factor-beta 3 supplemented chondrogenic media for 21 days. The meniscal and hypertrophic gene expression, gross appearance and structure of the pellets, meniscus extracellular matrix (ECM), histology and immunohistochemistry of proteoglycan and collagen were evaluated. Co-culture of MC with MSC at 75:25 demonstrated highest levels of collagen type I and glycosaminoglycans (GAG) production, as well as the lowest levels of hypertrophic genes, such as COL10A1 and MMP13. All co-culture conditions showed better meniscus ECM production and hypertrophic inhibition as compared to MSC culture alone. The collagen fiber bundles observed in the co-cultures are important to produce heterogenic ECM structure of meniscus. In conclusion, co-culturing MC and MSC is a feasible and efficient approach to engineer meniscus tissue with enhanced ECM production without hypertrophy.
KEYWARDS: meniscus tissue engineering, mesenchymal stem cells, fibrochondrocyte, extracellular matrix, hypertrophy
Introduction
The knee meniscus plays a crucial role in weight distribution, load bearing, shock absorption, congruency, stability, lubrication, and nutrition of articular cartilage (Cameron and Macnab, 1972; Newman et al., 1989; Proctor et al., 1989; Tissakht et al., 1996; Zhu et al., 1994). Meniscus tissue is fully vascularized from prenatal development until shortly after birth. However, vascularization and innervation is limited to the peripheral 10–25% of the tissue at maturity (Clark and Ogden, 1983). Thus, the meniscus tissue is usually divided into the outer one third, the vascular/neural zone, and the inner two third, the completely avascular/aneural zone. The predominant meniscus extracellular matrix (ECM) component is collagen (> 75% of the dry weight), of which > 90% is collagen type I, followed by glycosaminoglycans (GAG) (17% of the dry weight), DNA (2% of the dry weight), adhesion glycoproteins (< 1% of the dry weight), and elastin (< 1%) (McDevitt and Webber, 1990; Proctor et al., 1989). The collagen at peripheral two thirds of meniscus is almost solely type I collagen forming radially and circumferentially orientated fibers (Cheung, 1987), providing highly anisotropic material properties that are greatest in the fiber direction (Bullough et al., 1970). The inner part of the meniscus contains both type I and II collagen at a 2:3 ratio (Sweigart and Athanasiou, 2001). The GAG is concentrated in the inner and middle part of the meniscus, maintaining the compressive stiffness, tissue hydration, and optimal viscoelastic behavior (Collier and Ghosh, 1995). Mature menisci contain heterogeneous cell populations. Meniscal cells (MC) located at outer vascular zone are oval and fusiform shaped with numerous projections that communicate with neighboring cells (Hellio Le Graverand et al., 2001a). They may be described as fibroblast-like cells (Makris et al., 2011). In contrast, MC in the inner avascular zone appear more rounded and well separated from one another by surrounding ECM with relative abundance of collagen type II and GAG. Therefore, they are described as fibrochondrocytes or chondrocyte-like cells (Hellio Le Graverand et al., 2001a). MC at the meniscus superficial zone are flattened spindle-shaped without cell extensions (Hellio Le Graverand et al., 2001a). They are suggested to be specific progenitor cells with therapeutic and regenerative capabilities.
Damage to the meniscus is the most common intra-articular knee injury and thus the most frequent cause for orthopedic surgical procedures in the United States (Morgan et al., 1991). Most meniscus lesions are observed in the inner region and these lesions do not heal due to lack of vasculature and low cell density (Koski et al., 2000; Rodkey, 2000). Partial meniscectomy is typically used to address these lesions (Rath and Richmond, 2000). However, this procedure has been shown to increase mechanical stress to the articular cartilage by more than 350% (Rath and Richmond, 2000; Seedhom, 1976). This eventually leads to cartilage degeneration, joint space narrowing and the clinical diagnosis of OA (Petrosini and Sherman, 1996; Rath and Richmond, 2000). Tissue engineering approaches of replacing the entire meniscus or repairing the meniscus lesion with autologous MC are promising but have several limitations. Two surgical procedures are usually required, first a biopsy to obtain cells and another procedure for implantation. Moreover, only a limited number of cells can be isolated from small biopsy, requiring monolayer cell expansion to obtain sufficient numbers of cells for implantation. However, MC cultured in monolayer gradually lose their phenotype with significantly down-regulated ECM gene expression after only a few passages (Gunja and Athanasiou, 2007). Therefore, alternative cell sources are desired for meniscus tissue engineering.
One potential cell source for meniscus tissue engineering is mesenchymal stem cells (MSC). MSC are able to differentiate along the chondrogenic, osteogenic, and other mesenchymal pathways under appropriate culture conditions (Caplan, 1994; Friedenstein et al., 1987; Mackay et al., 1998). Moreover, MSC possess trophic effects by secreting a variety of cytokines and growth factors to inhibit apoptosis, stimulate cell differentiation by both paracrine and autocrine mechanisms, and suppress the local immune system (Caplan and Dennis, 2006). This allows allogeneic MSC to be as effective in meniscal regeneration as autologous MSC. However, previous studies showed MSC cannot produce equivalent amount of ECM compared to donor-matched somatic cells after differentiation (Mauck et al., 2006). Furthermore, chondrogenic differentiation of MSC leads to hypertrophic phenotype (Pelttari et al., 2006). Nevertheless, previous studies reported enhanced ECM production and reduced hypertrophy in hydrogel co-cultures of MSC with chondrocytes (Bian et al., 2011). Therefore, co-culture of MSC with mature MC is an attractive strategy for meniscus tissue engineering but this has not previously been tested. In this study, we demonstrate feasibility of a pellet co-culture system of human MC with bone marrow derived human MSC for meniscus tissue engineering.
Materials and Methods
Materials
Dulbecco’s modified Eagle’s medium (DMEM) was obtained from Mediatech (Manassas, VA). LIVE/DEAD® Viability/Cytotoxicity kit was purchased from Invitrogen (Carlsbad, CA). TGF-β3 was purchased from PeproTech Inc. (Rocky Hill, NJ). Primers were from Applied Biosystems (Carlsbad, CA). All other chemicals were obtained from Sigma-Aldrich (St. Louis, MO) unless otherwise noted.
Human meniscal cell isolation
Human meniscus was supplied by the South Texas Tissue Center (San Antonio, TX) from adult donors (mean± SD age 24.8± 5.0) having no history of joint disease. Human tissues were obtained under approval by the Scripps Human Subjects Committee. Menisci were harvested and isolated from cadavers within 22 to 72 h after death. Once meniscus was rinsed with sterilized phosphate buffered saline (PBS), all synovial tissue was carefully trimmed by using a sterile scalpel. The meniscus tissue was minced into 1 mm3 pieces and then digested with 2 mg/mL type IV clostridial collagenase in DMEM with 5% fetal calf serum for 4 to 6 h at 37°C.
The released cells were washed three times with penicillin-streptomycin-glutamine (PSG; Invitrogen) supplemented DMEM and cell viability was determined (average viability was 95%). Isolated MC were seeded into T175 tissue culture flasks at 5 million cells per flask for expansion in monolayer and cultured in DMEM supplemented with 10% calf serum and PSG. Cells were incubated at 37°C with humidified air containing 5% CO2. Culture medium was changed every 4 days. Cells were used when 80 to 90% confluence was reached (1 to 2 weeks in primary culture). All cells used for this study were from the first passage to minimize variations and dedifferentiation during passaging and extended monolayer culture.
Human mesenchymal stem cell culture
Human MSC were obtained from the Texas A&M Health Science Center (7078, 8001R, Temple, TX). Cells were expanded in mesenchymal stem cell growth medium (PT-3001, Lonza, Walkersville, MD) at 37°C with humidified air containing 5% CO2. Culture medium was changed three times a week. Fourth passage (P4) MSCs were used.
Cell pellet formation
In addition to pellets of single cell type (MC or MSC), bilaminar cell pellets (BCP) with MC and MSC were prepared as previously reported for enhanced inductions between stem cells and differentiated cells (Cooke et al., 2011). Each pellet consisted of 5×10⁵ cells: (1) 100% MC; (2) 75% MC and 25% MSC; (3) 50% MC and 50% MSC; (4) 25% MC and 75% MSC; (5) 100% MSC. To assess the cell pellet conformation, MC were labeled with CellTrace Green CFSE fluorescent probe (Invitrogen) and MSC were labeled with CellTracker Orange CMTMR fluorescent probe (Invitrogen) following the protocols provided by the manufacturer. Briefly, cells were suspended in 10 μM staining solutions and incubated for 15 min at 37°C. After centrifugation, cell pellets were suspended with pre-warmed DMEM medium and incubated for another 30 min to complete the labeling.
Single cell type pellets were prepared with 5×10⁵ cells and centrifuged in 15 mL-sized conical tubes at 300 g for 5 min. To create BCP, the cells forming the core were centrifuged at 300 g for 5 min. Subsequently, the cells forming the surrounding layer were gently added into the same tube and centrifuged again at 300 g for 5 min. MSC were always encapsulated by MC using this centrifugation procedure possibly due to their higher cellular mass density and increased adhesiveness. Therefore all BCP constructed in this study a core of MSC that is surrounded by MC. Following centrifugation, pellets were cultured for 2 to 3 days in conical tubes until spherical pellets were formed and detached from the bottom. Pellets were then transferred using sterile disposable transfer pipettes to ultra-low attachment 24 well plates (Corning, Lowell, MA) and cultured for 21 days before testing. Culture medium (PT-3003, Lonza) supplemented with or without 10 ng/mL TGF-β3 was changed three times per week. TGF-β3 has been previously reported to promote MC fibrocartilaginous ECM deposition and enhanced chondrogenesis of MSC in pellet culture (Mauck et al., 2007).
Confocal microscopy of cell pellets
The spherical cell pellets were carefully sliced using a scalpel. A Zeiss LSM 510 laser scanning microscope (Carl Zeiss, Minneapolis, MN) was used to determine the pellet configuration with appropriate fluorescent channels.
Biochemical assays
Cell pellets were digested using papain or pepsin to assess the ECM composition and DNA content. Soluble type I and type II collagen were extracted by digesting each sample with 0.5 mL pepsin solution (100 μg/mL pepsin in 0.05 M acetic acid) for 6 days at 4°C to avoid denaturation. Total GAG content was extracted by treating each sample with 0.5 mL papain solution (125 μg/mL papain type III (Worthington Biochemical, Lakewood, NJ), 10 mM L-cysteine, 100 mM phosphate buffer, 10 mM EDTA, pH 6.4) for 16 h at 60°C.
Solubilized type I and type II collagen was measured by ELISA (Chondrex, Redmond, WA) following the protocols provided by the manufacturer. Total GAG content was determined with dimethymethylene blue dye assay (Farndale et al., 1986). DNA content in each sample was measured using CyQUANT Cell Proliferation Assay (Invitrogen) using a Safire 2 microplate reader (TECAN, Mannedorf, Switzerland). GAG, type I, and type II collagen contents were normalized to respective DNA content to assess biosynthetic activity of the cell pellets. Each experimental condition was tested in three replicates and the total number of independent experiments (n > 3) is indicated for each data set.
Histology and immunohistochemistry
Cell pellets were fixed overnight in 10% formaldehyde and transferred to 70% ethanol until embedded in paraffin following standard histological protocol. After embedding pellets in paraffin, 5 μm cross sections were cut on a microtome (Microm HM 325, GMI Inc., Ramsey, MN). Representative sections of each construct were stained with Masson’s trichrome and Safranin-O/fast green to visualize the deposited collagen and proteoglycans.
Immunohistochemistry (IHC) was performed to visualize type I and type II collagen. Paraffin-fixed samples were first deparaffinized in xylene substitute Pro-Par Clearant (Anatech, Battle Creek, MI) and rehydrated in graded ethanol and water. For antigen retrieval, sections were incubated in trypsin and kept at 37°C for 30 minutes. Following a wash with PBS, sections were blocked with 10% normal goat serum for 30 min at room temperature. Antibodies to collagen type I at 1 μg/mL (ab292, Abcam, Cambridge, MA) and collagen type II at 3 μg/mL (II-II6B3, Hybridoma Bank, Iowa City, IA) were applied and incubated overnight at 4°C. After washing with PBS, sections were incubated with biotinylated goat anti-rabbit secondary antibody or biotinylated goat anti-mouse secondary antibody for 30 minutes at room temperature, and then incubated using Vectastain ABC-AP alkaline phosphatase (Vector Laboratories, Burlingame, CA) for 30 minutes. Slides were washed, and sections were incubated with alkaline phosphatase substrate for 10–20 minutes.
RNA isolation and gene expression using quantitative real-time PCR (RT-PCR)
Cell pellets were harvested and analyzed for gene expression (n = 3). Pellets were transferred into a tube containing 350 μL RNA lysis buffer provided by RNeasy Mini Kit (QIAGEN, Valencia, CA) and incubated at room temperature for 15 min. Lysis solution was transferred into shredder tubes (QIAGEN) and centrifuged at 12,000 g for 2 min. The homogenized solution was then transferred to spin columns for RNA purification following the protocol provided with the kit. RNA content and purity was determined using the Nanodrop ND-1000 (Thermo Scientific, Wilmington, DE). Isolated total RNA was reverse transcribed to cDNA using a High Capacity cDNA Reverse Transcription Kit (Applied Biosystems). Quantitative RT-PCR (LightCycler 480II Real-Time PCR System, Roche, Basel, Switzerland) was performed using TaqMan Gene Expression Assay probes (Applied Biosystems) to determine the gene expression of human collagen type I (COL1A1; Hs00164004_m1), collagen type II (COL2A1; Hs01064869_m1), aggrecan (ACAN; Hs00153936_m1), cartilage oligomeric matrix protein (COMP; Hs00164359_m1), collagen type X (COL10A1; Hs00166657_m1), and matrix metalloproteinase 13 (MMP13; Hs00233992_m1) relative to the expression of glyceraldehyde-3-phosphate dehydrogenase (GAPDH; Hs99999905_m1). GAPDH was used as housekeeping gene for normalization.
Statistical analysis
All data are reported as mean with standard deviation. Statistical analysis was performed with the GraphPad Prism software (Version 5; GraphPad Software Inc., La Jolla, CA). Statistical significance was determined using a one-way ANOVA followed by Tukey’s post hoc test with a confidence level of 0.05.
Results
Pellet conformation and gross morphology
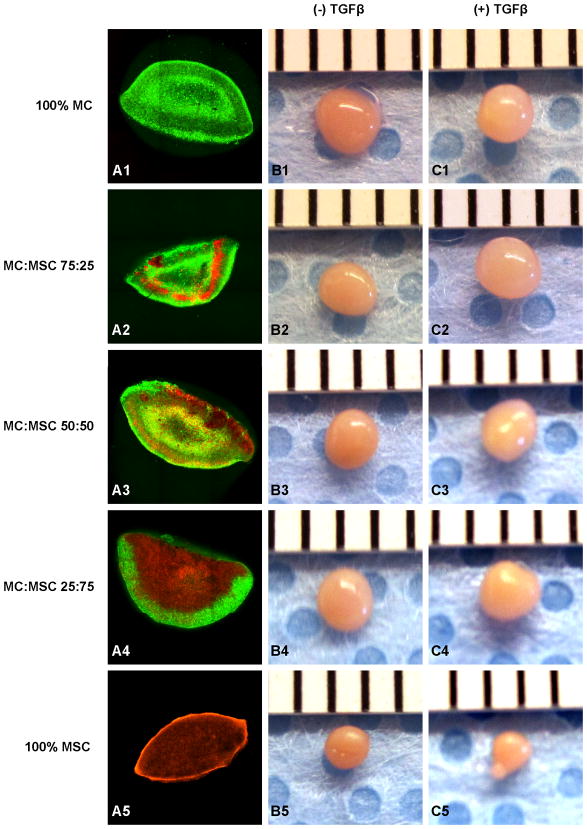
Cell pellet conformation was assessed using confocal microscopy (Fig. 1A). MSC were encapsulated by MC in all BCP. At t = 21 days, all pellets showed production of ECM. Without TGFβ, the 100% MC group had a diameter of 1.83± 0.04 mm and a volume of 3.23± 0.20 mm3, which was the largest among all constructs (Table I, Fig. 1B1). With TGFβ, the 75% MC/25% MSC group had the largest size of 1.92± 0.05 mm in diameter and 3.73± 0.30 mm3 in volume (Table I, Fig. 1C2), which were 17.1% and 60.1% increases in diameter and volume respectively when compared to the same group without TGFβ treatment. 100% MSC group had the smallest pellet size among all constructs in both conditions (Fig. 1B5 & C5).
Figure 1.
Cell pellet construct formulation and gross morphology. A: Confocal images of constructed cell pellet with MC (green fluorescence) and MSC (orange fluorescence). B: Cell pellet gross morphology without TGFβ after 21 days in culture. C: Cell pellet gross morphology with TGFβ after 21 days in culture.
Table I.
Pellet diameter, volume, and DNA content normalized to pellet weight at 21 days (n = 3).
| MC:MSC | Diameter (mm) | Volume (mm3) | DNA/Weight (μg/mg) | |||
|---|---|---|---|---|---|---|
| (−) TGFβ | (+) TGFβ | (−) TGFβ | (+) TGFβ | (−) TGFβ | (+) TGFβ | |
| 100:0 | 1.83 ± 0.04 | 1.66 ± 0.04 | 3.23 ± 0.20 | 2.39 ± 0.17 | 1.10 ± 0.11 | 0.43 ± 0.07 |
| 75:25 | 1.64 ± 0.10 | 1.92 ± 0.05 | 2.33 ± 0.43 | 3.73 ± 0.30 | 1.06 ± 0.25 | 0.52 ± 0.07 |
| 50:50 | 1.75 ± 0.12 | 1.82 ± 0.11 | 2.84 ± 0.57 | 3.20 ± 0.55 | 1.39 ± 0.50 | 0.83 ± 0.09 |
| 25:75 | 1.76 ± 0.11 | 1.78 ± 0.03 | 2.87 ± 0.55 | 2.93 ± 0.12 | 1.37 ± 0.37 | 0.82 ± 0.22 |
| 0:100 | 1.31 ± 0.01 | 1.16 ± 0.08 | 1.17 ± 0.04 | 0.83 ± 0.18 | 1.41 ± 0.12 | 1.33 ± 0.22 |
Biochemical analysis of cell pellet constructs
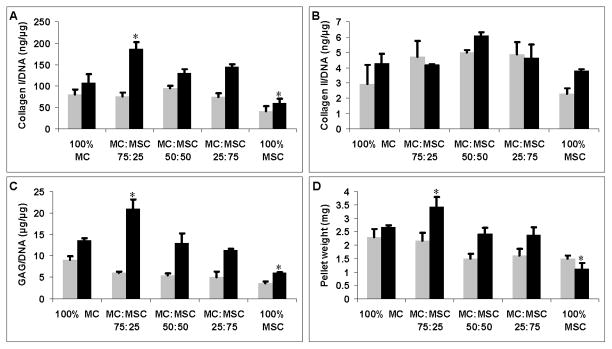
Cell pellet ECM production was evaluated by measuring the amounts of Collagen type I, collagen type II, and GAG, normalized to the DNA content of each sample (Fig. 2). There was no significant difference in collagen type I/DNA (Fig. 2A) and weight in cell pellets (Fig. 2D) without TGFβ treatment. No significant difference in collagen type II/DNA content was observed in all groups with or without TGFβ (Fig. 2B). 100% MC without TGFβ treatment had higher GAG/DNA production (Fig. 2C) but this was not statisticaly significant (p = 0.11). The 75% MC/25% MSC group produced significantly more collagen type I (Fig. 2A), GAG (Fig. 2C), and had the highest weight (Fig. 2D) compared to all other groups when treated with TGFβ (p < 0.05). The 100% MSC group had significantly lower collagen type I/DNA (Fig. 2A) and GAG/DNA (Fig. 2C) production, and the lowest weight (Fig. 2D) compared to all other groups when treated with TGFβ (p < 0.05). Collagen type I production was significantly higher than collagen type II production in all groups treated with or without TGFβ. DNA content in 100% MC group decreased significantly when treated with TGFβ (p < 0.05) (Table 1). DNA content in co-cultured pellets also decreased with TGFβ treatment but this was not statistically significant. There was no significant difference in DNA content in 100% MC group treated with or without TGFβ (Table I).
Figure 2.
ECM production normalized to DNA content and pellet weights of each group treated with (black bars) or without TGFβ (grey bars). A: Soluble collagen type I production normalized to DNA content (ng/μg). B: Soluble collagen type II production normalized to DNA content (ng/μg). C: GAG production normalized to DNA content (μg/μg). D: Cell pellet weight (mg). Asterisks indicate statistical significance of assigned groups (* p < 0.05) (n = 3).
Histology and IHC
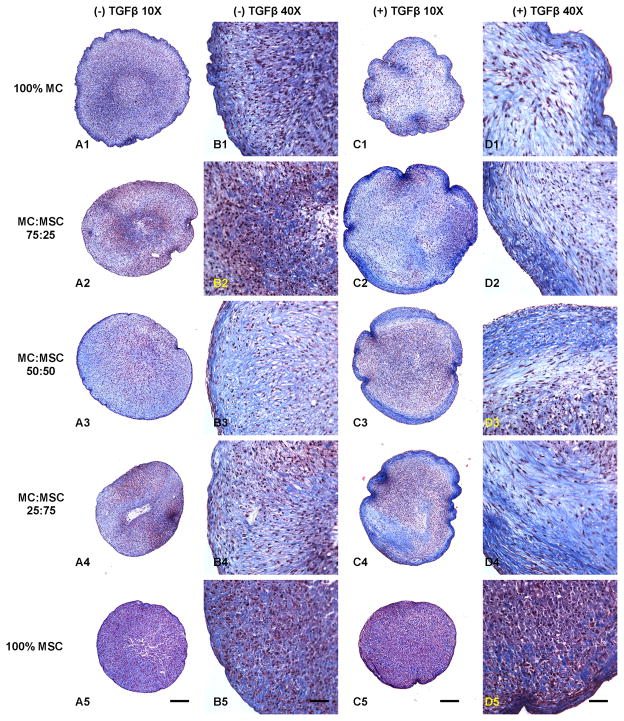
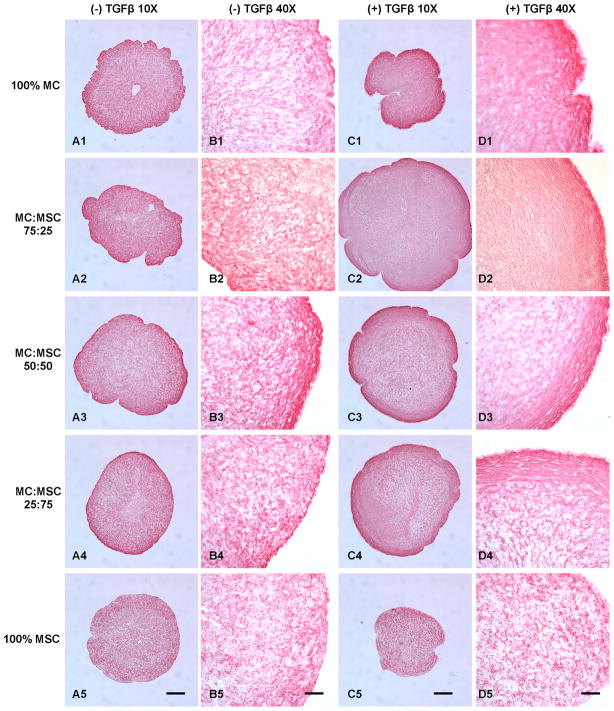
Masson’s trichrome showed overall higher collagen deposition in pellets containing MC treated with TGFβ (Fig. 3). Collagen fibrous bundles were observed at the outer layer of the pellets, especially in the co-culture groups (Fig. 3D2, D3, & D4). The 75% MC/25% MSC group treated with TGFβ demonstrated the highest collagen production that was distributed evenly in the cell pellet (Fig. 3C2). The 50% MC/50% MSC group showed the most evenly distributed collagen fibers among TGFβ free groups (Fig. 3A3 & B3). The cell density was lower in TGFβ treated groups containing MC, especially in the 100% MC group. The 100% MSC groups showed lowest collagen deposition with no collagen fibrous structures and there was no significant difference between TGFβ and TGFβ free conditions.
Figure 3.
Masson’s trichrome collagen staining of cell pellets treated with and without TGFβ. A: Cell pellets treated without TGFβ (10X). B: Cell pellets treated without TGFβ (40X). C: Cell pellets treated with TGFβ (10X). D: Cell pellets treated with TGFβ (40X). Scale bars: A, C = 200 μm; B, D = 50 μm.
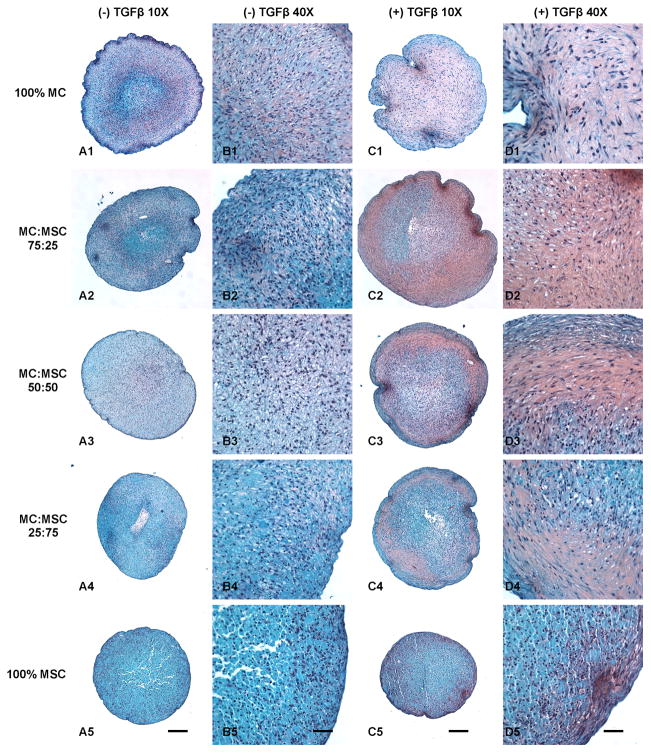
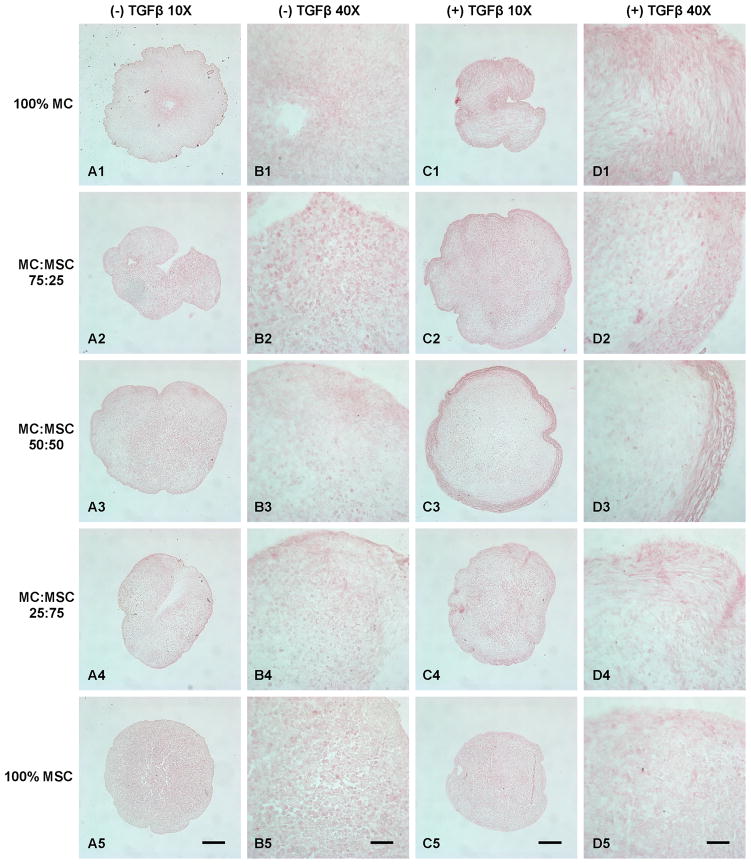
Safranin-O staining revealed higher GAG deposition in all groups treated with TGFβ (Fig. 4). The 75% MC/25% MSC group treated with TGFβ showed the highest GAG production among all groups (Fig. 4C2 & D2). Furthermore, the GAG deposition in this group (Fig. 4C2) overlapped the area where had collagen fibrous bundles deposition (Fig. 3C2). However, the GAG deposition in 100% MC group (Fig. 4C1) as well as other co-cultured groups (Fig. 4C3 & C4) did not overlap the area with collagen fiber deposition (Fig. 3C1, C3, & C4). The 100% MSC group had the lowest GAG deposition at both conditions (Fig. 4A5 & C5). The GAG production increased with the increase of MC ratio in the groups without TGFβ treatment (Fig. 4A).
Figure 4.
Safranin-O proteoglycan staining of cell pellets treated with and without TGFβ. A: Cell pellets treated without TGFβ (10X). B: Cell pellets treated without TGFβ (40X). C: Cell pellets treated with TGFβ (10X). D: Cell pellets treated with TGFβ (40X). Scale bars: A, C = 200 μm; B, D = 50 μm.
IHC showed that the most abundant collagen was type I and it was stained much more intensely than collagen type II in all groups (Fig. 5 & 6). The 75% MC/25% MSC group treated with TGFβ showed the most dense collagen type I that was evenly distributed in the pellet compared to other groups (Fig. 5C2 & D2).
Figure 5.
Collagen type I immunohistochemistry staining of cell pellets treated with and without TGFβ. A: Cell pellets treated without TGFβ (10X). B: Cell pellets treated without TGFβ (40X). C: Cell pellets treated with TGFβ (10X). D: Cell pellets treated with TGFβ (40X). Scale bars: A, C = 200 μm; B, D = 50 μm.
Figure 6.
Collagen type II immunohistochemistry staining of cell pellets treated with and without TGFβ. A: Cell pellets treated without TGFβ (10X). B: Cell pellets treated without TGFβ (40X). C: Cell pellets treated with TGFβ (10X). D: Cell pellets treated with TGFβ (40X). Scale bars: A, C = 200 μm; B, D = 50 μm.
Meniscal and hypertrophic gene expression
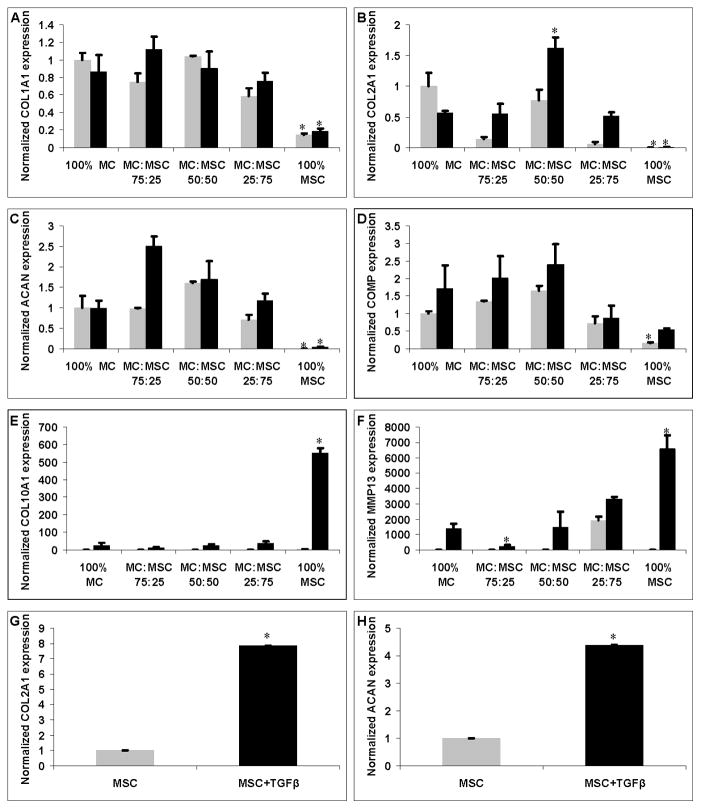
Gene expression of human COL1A1, COL2A1, ACAN, COMP, COL10A1, and MMP13 were measured using quantitative PCR, normalizing to the GAPDH housekeeping gene. To determine the effect of co-culture system with different treatments, relative gene expression of target gene was further normalized to the expression in 100% MC group cultured without TGFβ. The 100% MC and all co-cultured groups had significant higher collagen type I, type II and aggrecan gene expression compared to 100% MSC group with or without TGFβ treatment (p < 0.05) (Fig. 7A, B, & C). The 100% MSC group showed significant lower COMP gene expression without TGFβ treatment compared to all other groups (p < 0.05) (Fig. 7D). There was no significant difference in collagen type I gene expression in the groups with MC. The 50% MC/50% MSC group had significant higher collagen type II gene expression when treated with TGFβ. Aggrecan gene expression of the 75% MC/25% MSC group was highest than any other group when treated with TGFβ (p < 0.05) except the 50% MC/50% MSC group (p > 0.05) (Fig. 7C). TGFβ treated groups had overall higher COMP, collagen type X, and MMP13 gene expression compared to the TGFβ free condition (Fig. 7D, E, & F). The 100% MSC group treated with TGFβ had significantly greater collagen type X (55 fold, p < 0.001) and MMP13 (28 fold, p < 0.001) hypertrophic gene expression compared to the co-culture group that had the lowest collagen X and MMP13 gene expression (Fig. 7E & F). The 75% MC/25% MSC group had the lowest MMP13 gene expression than other groups treated with TGFβ (p < 0.05) (Fig. 7F). The 100% MSC group had significantly greater collagen type II and aggrecan gene expression when treated with TGFβ (p < 0.01) (Fig. 7G & H).
Figure 7.
Gene expressions of cell pellets treated with (black bars) and without TGFβ (grey bars). A: Collagen type I (COL1A1) expression. B: Collagen type II (COL2A1) expression. C: Aggrecan (ACAN) expression. D: Cartilage oligomeric matrix protein (COMP) expression. E: Collagen type X (COL10A1) expression. F: MMP13 expression. G & H: COL2A1 and ACAN expression of 100% MSC groups treated with (black bars) and without TGFβ (grey bars). Asterisks indicate statistical significance between assigned groups (* p < 0.05) (n = 3).
Discussion
Adult MSC are a promising cell source for meniscus tissue engineering and regeneration. The chondrogenic differentiation potential of MSC has been well evaluated in many scaffold-free and scaffold-based cell culture systems (Barry et al., 2001; Ichinose et al., 2005; Li et al., 2005; Lisignoli et al., 2005). Additionally, MSC are packed to achieve high cell density to mimic mesenchymal condensation during developmental chondrogenesis in the widely used pellet culture system (Yoo et al., 1998). MSC chondrogenesis requires high cell density and cell-cell contact in a defined serum-free chondrogenic medium with TGFβ and dexamethasone (Tuli et al., 2003). Interestingly, hypertrophic genes, such as collagen type X and MMP13 (Mwale et al., 2006a; Mwale et al., 2006b) are observed during MSC chondrogenic differentiation. This suggests that MSC chondrogenic differentiation may lead to the chondrocyte hypertrophy stage, a typical process of endochondral ossification during skeletal development. Moreover, these hypertrophic genes are not only specific for terminal chondrocyte differentiation but can also be observed in pathological conditions. For example, collagen type X is a hypertrophic marker for osteoarthritic (OA) cartilage (Girkontaite et al., 1996; von der et al., 1992) as well as OA meniscus (Hellio Le Graverand et al., 2001b). MMP13 regulates hypertrophic chondrocyte differentiation during endochondral ossification by extensively reorganizing the ECM (Alvarez et al., 2000). This poses an obstacle for the clinical application of MSC in cartilage and meniscus repair. The hypertrophy of neocartilage or neomeniscus would ultimately lead to apoptosis and ossification, as observed in the cartilage growth plate.
Our results demonstrate that co-culturing MC and MSC promotes meniscal phenotype with respect to the enhanced meniscus ECM production, as well as greatly reduced hypertrophy of MSC during chondrogenic differentiation. Culturing MSC with conditioned medium was unable to replicate this effect as observed in co-culture with differentiated cells (Aung et al., 2011). Therefore, the direct exchange of soluble factors between MC and MSC, as well as the possible spatial gradient of these factors in the cell pellet construct are required for the enhanced meniscal cell differentiation. Qualitative and quantitative evaluations revealed clear differences between the ECM production and gene expression of the constructs in each group. Specifically, with TGFβ treatment, all co-cultured constructs had enhanced meniscus ECM with higher levels of collagen type I and GAG production than single cell constructs (MC or MSC). All groups treated with TGFβ had higher collagen I and GAG production compared to the constructs cultured without TGFβ. COMP as a pentameric glycoprotein that influences collagen fibril formation is identified in the meniscus (Muller et al., 1998). Samples treated with TGFβ had higher COMP gene expression compared to TGFβ free condition, this suggests potential of TGFβ in COMP induction. Constructs with higher MSC ratio showed lower COMP gene expression. However, the 50% MC/50% MSC and 75% MC/25% MSC showed higher or equal expression in COMP compared to 100% MC with or without TGFβ. In addition, TGFβ induced expression of hypertrophic genes in all groups with respect to collagen type X and MMP13, especially in 100% MSC group. The 75% MC/25% MSC group showed the lowest hypertrophic gene expression, even including the 100% MC groups. This demonstrated the equal or larger portion of differentiated cells effectively inhibited MSC hypertrophy. The significantly increased hypertrophy and reduced DNA content in groups containing MC treated with TGFβ suggests TGFβ induces hypertrophy of both MSC and the differentiated cells. The hypertrophic phenotype of cells eventually leads to cell apoptosis, especially to differentiated cells. The 100% MC group reduced 60% DNA content with TGFβ treatment after 21 days. Therefore, TGFβ may not be the optimal growth factor for meniscus tissue engineering although it is commonly used in cartilage and meniscus tissue engineering, as well as chondrogenic differentiation of MSC. Co-culturing MSC with MC in TGFβ supplemented culture condition to induce the meniscal phenotype differentiation without hypertrophy is even more attractive to solve this critical issue. Overall, the 75% MC/25% MSC demonstrated the optimal meniscus ECM production with consistent results of gross appearance, biochemical analysis, histology and IHC, as well as gene expression. This group also showed the lowest hypertrophic gene expression. The 25% MSC in this group probably delivered trophic factors to the MC cells thus the cells were more meniscogenic. The soluble signal communications between the two cell populations provided the optimal environment for meniscal ECM production and cell differentiation.
TGFβ treated groups showed significantly more collagen fibrous bundles in the outer layer of the constructs, indicating feasibility to construct the collagen fibrous structure at meniscus vascular zone (Makris et al., 2011). Although the 75% MC/25% MSC group had the most abundant collagen production with TGFβ treatment according to histology, the 50% MC/50% MSC and 75% MC/25% MSC groups showed the orientated collagen fiber formation even without TGFβ. This demonstrated an alternative possibility to engineer functional meniscus tissue without TGFβ treatment where the cells will not undergo hypertrophic pathway due to TGFβ. The significantly higher amount of collagen type I than collagen type II in this study showed the feasibility for meniscus tissue engineering because more than 90% collagen in meniscus is collagen type I, with the remaining 1–2% consisting of collagen types II, III, V, and VI (McDevitt and Webber, 1990). Interestingly, the overlapping of collagen fibrous bundles and proteoglycan was only observed in the 75% MC/25% MSC group. This demonstrated the cells in this co-culture system either produced excess amount of proteoglycans or these cells were stimulated by the trophic mediators (MSC) therefore they were able to produce meniscus ECM with all spectrum to regenerate meniscus tissue.
In conclusion, this study indicates that the 75% MC/25% MSC co-culture system promotes a robust meniscal phenotype; with respect to fibrous collagen production and meniscal gene expression. Importantly, this co-culture system addresses two critical limitations in meniscus tissue engineering: a limited MC supply from a small biopsy specimen, which may itself be diseased; and the generation of MC from MSC without hypertrophy. MSC are more plentiful than MC; therefore this co-culture system may be used to expand the limited supply of MC for meniscus tissue engineering. Furthermore, this co-culture system has the potential of not requiring exogenous growth factors nor does it exhibit a hypertrophic phenotype. Consequently, this system may provide significant advantages as a therapeutic approach for meniscus regeneration.
Acknowledgments
The authors would like to acknowledge Sujata Sovani for harvesting human meniscal cells, Margaret Chadwell, and Lilo Creighton for helping with histology. This work was funded by the NIH (AG007996), CIRM (TR1-01216), STSI (UL1 RR025774).
Footnotes
The authors certify that there is no conflict of interest related to the work presented in this article.
References
- Alvarez J, Balbin M, Santos F, Fernandez M, Ferrando S, Lopez JM. Different bone growth rates are associated with changes in the expression pattern of types II and X collagens and collagenase 3 in proximal growth plates of the rat tibia. J Bone Miner Res. 2000;15:82–94. doi: 10.1359/jbmr.2000.15.1.82. [DOI] [PubMed] [Google Scholar]
- Aung A, Gupta G, Majid G, Varghese S. Osteoarthritic chondrocyte-secreted morphogens induce chondrogenic differentiation of human mesenchymal stem cells. Arthritis Rheum. 2011;63:148–158. doi: 10.1002/art.30086. [DOI] [PMC free article] [PubMed] [Google Scholar]
- Barry F, Boynton RE, Liu B, Murphy JM. Chondrogenic differentiation of mesenchymal stem cells from bone marrow: differentiation-dependent gene expression of matrix components. Exp Cell Res. 2001;268:189–200. doi: 10.1006/excr.2001.5278. [DOI] [PubMed] [Google Scholar]
- Bian L, Zhai DY, Mauck RL, Burdick JA. Coculture of human mesenchymal stem cells and articular chondrocytes reduces hypertrophy and enhances functional properties of engineered cartilage. Tissue Eng Part A. 2011;17:1137–1145. doi: 10.1089/ten.tea.2010.0531. [DOI] [PMC free article] [PubMed] [Google Scholar]
- Bullough PG, Munuera L, Murphy J, Weinstein AM. The strength of the menisci of the knee as it relates to their fine structure. J Bone Joint Surg Br. 1970;52:564–567. [PubMed] [Google Scholar]
- Cameron HU, Macnab I. The structure of the meniscus of the human knee joint. Clin Orthop Relat Res. 1972;89:215–219. [PubMed] [Google Scholar]
- Caplan AI. The mesengenic process. Clin Plast Surg. 1994;21:429–435. [PubMed] [Google Scholar]
- Caplan AI, Dennis JE. Mesenchymal stem cells as trophic mediators. J Cell Biochem. 2006;98:1076–1084. doi: 10.1002/jcb.20886. [DOI] [PubMed] [Google Scholar]
- Cheung HS. Distribution of type I, II, III and V in the pepsin solubilized collagens in bovine menisci. Connect Tissue Res. 1987;16:343–356. doi: 10.3109/03008208709005619. [DOI] [PubMed] [Google Scholar]
- Clark CR, Ogden JA. Development of the menisci of the human knee joint. Morphological changes and their potential role in childhood meniscal injury. J Bone Joint Surg Am. 1983;65:538–547. [PubMed] [Google Scholar]
- Collier S, Ghosh P. Effects of transforming growth factor beta on proteoglycan synthesis by cell and explant cultures derived from the knee joint meniscus. Osteoarthritis Cartilage. 1995;3:127–138. doi: 10.1016/s1063-4584(05)80045-7. [DOI] [PubMed] [Google Scholar]
- Cooke ME, Allon AA, Cheng T, Kuo AC, Kim HT, Vail TP, Marcucio RS, Schneider RA, Lotz JC, Alliston T. Structured three-dimensional co-culture of mesenchymal stem cells with chondrocytes promotes chondrogenic differentiation without hypertrophy. Osteoarthritis Cartilage. 2011;19:1210–1218. doi: 10.1016/j.joca.2011.07.005. [DOI] [PMC free article] [PubMed] [Google Scholar]
- Farndale RW, Buttle DJ, Barrett AJ. Improved Quantitation and Discrimination of Sulfated Glycosaminoglycans by Use of Dimethylmethylene Blue. Biochim Biophys Acta. 1986;883:173–177. doi: 10.1016/0304-4165(86)90306-5. [DOI] [PubMed] [Google Scholar]
- Friedenstein AJ, Chailakhyan RK, Gerasimov UV. Bone marrow osteogenic stem cells: in vitro cultivation and transplantation in diffusion chambers. Cell Tissue Kinet. 1987;20:263–272. doi: 10.1111/j.1365-2184.1987.tb01309.x. [DOI] [PubMed] [Google Scholar]
- Girkontaite I, Frischholz S, Lammi P, Wagner K, Swoboda B, Aigner T, von der MK. Immunolocalization of type X collagen in normal fetal and adult osteoarthritic cartilage with monoclonal antibodies. Matrix Biol. 1996;15:231–238. doi: 10.1016/s0945-053x(96)90114-6. [DOI] [PubMed] [Google Scholar]
- Gunja NJ, Athanasiou KA. Passage and reversal effects on gene expression of bovine meniscal fibrochondrocytes. Arthritis Res Ther. 2007;9:R93. doi: 10.1186/ar2293. [DOI] [PMC free article] [PubMed] [Google Scholar]
- Hellio Le Graverand MP, Ou Y, Schield-Yee T, Barclay L, Hart D, Natsume T, Rattner JB. The cells of the rabbit meniscus: their arrangement, interrelationship, morphological variations and cytoarchitecture. J Anat. 2001a;198:525–535. doi: 10.1046/j.1469-7580.2000.19850525.x. [DOI] [PMC free article] [PubMed] [Google Scholar]
- Hellio Le Graverand MP, Sciore P, Eggerer J, Rattner JP, Vignon E, Barclay L, Hart DA, Rattner JB. Formation and phenotype of cell clusters in osteoarthritic meniscus. Arthritis Rheum. 2001b;44:1808–1818. doi: 10.1002/1529-0131(200108)44:8<1808::AID-ART318>3.0.CO;2-B. [DOI] [PubMed] [Google Scholar]
- Ichinose S, Tagami M, Muneta T, Sekiya I. Morphological examination during in vitro cartilage formation by human mesenchymal stem cells. Cell Tissue Res. 2005;322:217–226. doi: 10.1007/s00441-005-1140-6. [DOI] [PubMed] [Google Scholar]
- Koski JA, Ibarra C, Rodeo SA, Warren RF. Meniscal injury and repair: clinical status. Orthop Clin North Am. 2000;31:419–436. doi: 10.1016/s0030-5898(05)70161-9. [DOI] [PubMed] [Google Scholar]
- Li WJ, Tuli R, Okafor C, Derfoul A, Danielson KG, Hall DJ, Tuan RS. A three-dimensional nanofibrous scaffold for cartilage tissue engineering using human mesenchymal stem cells. Biomaterials. 2005;26:599–609. doi: 10.1016/j.biomaterials.2004.03.005. [DOI] [PubMed] [Google Scholar]
- Lisignoli G, Cristino S, Piacentini A, Toneguzzi S, Grassi F, Cavallo C, Zini N, Solimando L, Mario MN, Facchini A. Cellular and molecular events during chondrogenesis of human mesenchymal stromal cells grown in a three-dimensional hyaluronan based scaffold. Biomaterials. 2005;26:5677–5686. doi: 10.1016/j.biomaterials.2005.02.031. [DOI] [PubMed] [Google Scholar]
- Mackay AM, Beck SC, Murphy JM, Barry FP, Chichester CO, Pittenger MF. Chondrogenic differentiation of cultured human mesenchymal stem cells from marrow. Tissue Eng. 1998;4:415–428. doi: 10.1089/ten.1998.4.415. [DOI] [PubMed] [Google Scholar]
- Makris EA, Hadidi P, Athanasiou KA. The knee meniscus: structure-function, pathophysiology, current repair techniques, and prospects for regeneration. Biomaterials. 2011;32:7411–7431. doi: 10.1016/j.biomaterials.2011.06.037. [DOI] [PMC free article] [PubMed] [Google Scholar]
- Mauck RL, Martinez-Diaz GJ, Yuan X, Tuan RS. Regional multilineage differentiation potential of meniscal fibrochondrocytes: implications for meniscus repair. Anat Rec (Hoboken ) 2007;290:48–58. doi: 10.1002/ar.20419. [DOI] [PubMed] [Google Scholar]
- Mauck RL, Yuan X, Tuan RS. Chondrogenic differentiation and functional maturation of bovine mesenchymal stem cells in long-term agarose culture. Osteoarthritis Cartilage. 2006;14:179–189. doi: 10.1016/j.joca.2005.09.002. [DOI] [PubMed] [Google Scholar]
- McDevitt CA, Webber RJ. The ultrastructure and biochemistry of meniscal cartilage. Clin Orthop Relat Res. 1990;252:8–18. [PubMed] [Google Scholar]
- Morgan CD, Wojtys EM, Casscells CD, Casscells SW. Arthroscopic meniscal repair evaluated by second-look arthroscopy. Am J Sports Med. 1991;19:632–637. doi: 10.1177/036354659101900614. [DOI] [PubMed] [Google Scholar]
- Muller G, Michel A, Altenburg E. COMP (cartilage oligomeric matrix protein) is synthesized in ligament, tendon, meniscus, and articular cartilage. Connect Tissue Res. 1998;39:233–244. doi: 10.3109/03008209809021499. [DOI] [PubMed] [Google Scholar]
- Mwale F, Girard-Lauriault PL, Wang HT, Lerouge S, Antoniou J, Wertheimer MR. Suppression of genes related to hypertrophy and osteogenesis in committed human mesenchymal stem cells cultured on novel nitrogen-rich plasma polymer coatings. Tissue Eng. 2006a;12:2639–2647. doi: 10.1089/ten.2006.12.2639. [DOI] [PubMed] [Google Scholar]
- Mwale F, Stachura D, Roughley P, Antoniou J. Limitations of using aggrecan and type X collagen as markers of chondrogenesis in mesenchymal stem cell differentiation. J Orthop Res. 2006b;24:1791–1798. doi: 10.1002/jor.20200. [DOI] [PubMed] [Google Scholar]
- Newman AP, Anderson DR, Daniels AU, Dales MC. Mechanics of the healed meniscus in a canine model. Am J Sports Med. 1989;17:164–175. doi: 10.1177/036354658901700205. [DOI] [PubMed] [Google Scholar]
- Pelttari K, Winter A, Steck E, Goetzke K, Hennig T, Ochs BG, Aigner T, Richter W. Premature induction of hypertrophy during in vitro chondrogenesis of human mesenchymal stem cells correlates with calcification and vascular invasion after ectopic transplantation in SCID mice. Arthritis Rheum. 2006;54:3254–3266. doi: 10.1002/art.22136. [DOI] [PubMed] [Google Scholar]
- Petrosini AV, Sherman OH. A historical perspective on meniscal repair. Clin Sports Med. 1996;15:445–453. [PubMed] [Google Scholar]
- Proctor CS, Schmidt MB, Whipple RR, Kelly MA, Mow VC. Material properties of the normal medial bovine meniscus. J Orthop Res. 1989;7:771–782. doi: 10.1002/jor.1100070602. [DOI] [PubMed] [Google Scholar]
- Rath E, Richmond JC. The menisci: basic science and advances in treatment. Br J Sports Med. 2000;34:252–257. doi: 10.1136/bjsm.34.4.252. [DOI] [PMC free article] [PubMed] [Google Scholar]
- Rodkey WG. Basic biology of the meniscus and response to injury. Instr Course Lect. 2000;49:189–193. [PubMed] [Google Scholar]
- Seedhom BB. Loadbearing function of the menisci. Physiotherapy. 1976;62:223. [PubMed] [Google Scholar]
- Sweigart MA, Athanasiou KA. Toward tissue engineering of the knee meniscus. Tissue Eng. 2001;7:111–129. doi: 10.1089/107632701300062697. [DOI] [PubMed] [Google Scholar]
- Tissakht M, Ahmed AM, Chan KC. Calculated stress-shielding in the distal femur after total knee replacement corresponds to the reported location of bone loss. J Orthop Res. 1996;14:778–785. doi: 10.1002/jor.1100140515. [DOI] [PubMed] [Google Scholar]
- Tuli R, Tuli S, Nandi S, Huang X, Manner PA, Hozack WJ, Danielson KG, Hall DJ, Tuan RS. Transforming growth factor-beta-mediated chondrogenesis of human mesenchymal progenitor cells involves N-cadherin and mitogen-activated protein kinase and Wnt signaling cross-talk. J Biol Chem. 2003;278:41227–41236. doi: 10.1074/jbc.M305312200. [DOI] [PubMed] [Google Scholar]
- von der MK, Kirsch T, Nerlich A, Kuss A, Weseloh G, Gluckert K, Stoss H. Type X collagen synthesis in human osteoarthritic cartilage. Indication of chondrocyte hypertrophy. Arthritis Rheum. 1992;35:806–811. doi: 10.1002/art.1780350715. [DOI] [PubMed] [Google Scholar]
- Yoo JU, Barthel TS, Nishimura K, Solchaga L, Caplan AI, Goldberg VM, Johnstone B. The chondrogenic potential of human bone-marrow-derived mesenchymal progenitor cells. J Bone Joint Surg Am. 1998;80:1745–1757. doi: 10.2106/00004623-199812000-00004. [DOI] [PubMed] [Google Scholar]
- Zhu W, Chern KY, Mow VC. Anisotropic viscoelastic shear properties of bovine meniscus. Clin Orthop Relat Res. 1994;306:34–45. [PubMed] [Google Scholar]


