

Abstract
The measurement of hippocampal volumes using MRI is a useful in-vivo biomarker for detection and monitoring of early Alzheimer’s Disease (AD), including during the amnestic Mild Cognitive Impairment (a-MCI) stage. The pathology underlying AD has regionally selective effects within the hippocampus. As such, we predict that hippocampal subfields are more sensitive in discriminating prodromal AD (i.e., a-MCI) from cognitively normal controls than whole hippocampal volumes, and attempt to demonstrate this using a semi-automatic method that can accurately segment hippocampal subfields. High-resolution coronal-oblique T2-weighted images of the hippocampal formation were acquired in 45 subjects (28 controls and 17 a-MCI (mean age: 69.5 ± 9.2; 70.2 ± 7.6)). CA1, CA2, CA3, and CA4/DG subfields, along with head and tail regions, were segmented using an automatic algorithm. CA1 and CA4/DG segmentations were manually edited. Whole hippocampal volumes were obtained from the subjects’ T1-weighted anatomical images. Automatic segmentation produced significant group differences in the following subfields: CA1 (left: p=0.001, right: p=0.038), CA4/DG (left: p=0.002, right: p=0.043), head (left: p=0.018, right: p=0.002), and tail (left: p=0.019). After manual correction, differences were increased in CA1 (left: p<0.001, right: p=0.002), and reduced in CA4/DG (left: p=0.029, right: p=0.221). Whole hippocampal volumes significantly differed bilaterally (left: p=0.028, right: p=0.009). This pattern of atrophy in a-MCI is consistent with the topography of AD pathology observed in postmortem studies, and corrected left CA1 provided stronger discrimination than whole hippocampal volume (p=0.03). These results suggest that semi-automatic segmentation of hippocampal subfields is efficient and may provide additional sensitivity beyond whole hippocampal volumes.
Keywords: hippocampal subfields, automatic segmentation, CA1, MCI, MRI
Introduction
Alzheimer’s Disease (AD) currently affects over 5 million people in the United States and has become a major public health crisis given the aging demography. It is generally accepted that potential disease modifying interventions are most likely to be effective early in the disease course, prior to the development of clinical dementia. As such, biomarkers of the earliest neurodegenerative changes associated with the AD process are highly desirable. Such markers would potentially allow for earlier detection and more sensitive disease monitoring in clinical intervention trials.
Mild cognitive impairment (MCI) is often conceptualized as an intermediate stage between normal aging and dementia [1, 2, 3]. It frequently represents the earliest symptomatic stages of an incipient neurodegenerative process, as reflected by a higher rate of conversion to clinical Alzheimer’s Disease and other dementias than in the normal elderly population [2, 4]. The amnestic subtype of MCI (a-MCI) has been studied the most extensively given consideration of memory impairment being the most common early feature of AD, a reflection of early neurofibrillary tangle (NFT) pathology in the medial temporal lobes in the AD pathological process.
The measurement of hippocampal volume with structural MRI is probably the most developed AD biomarker and has been frequently applied to a-MCI cohorts. Shi et al. [5] provides a comprehensive review and meta-analysis of recent studies examining hippocampal atrophy in the presence of MCI, though the study of hippocampal volumetry in AD and MCI precedes even the earliest work in that analysis [6, 7, 8]. Most studies report significant bilateral atrophy, frequently with greater volume loss in the left hippocampus [4, 9, 10, 11, 12, 13], though see [14, 15] for observations of greater atrophy in the right hippocampus. Other work has reported less robust a-MCI versus cognitively normal control differences [16]. Further, considerable research has supported the predictive value of smaller hippocampal volumes both for conversion to AD and in association with other AD biomarkers [17, 18, 19].
While the hippocampus is often modeled as a single structure, it is in fact a complex, heterogeneous structure composed of several histologically distinct regions [20, 21], including the hippocampus proper (consisting of the cornu ammonis subfields, CA1, CA2, CA3), dentate gyrus (CA4/DG), and subiculum1. These different subfields make unique contributions to memory processes and appear to be differentially vulnerable to various neurodegenerative diseases [20, 21]; in particular, the NFT pathology of AD tends to most prominently involve the CA1 subfield of the hippocampus proper [22, 23, 24, 25, 26]. Thus, studies focused on whole hippocampal volume may have reduced sensitivity due to dilution from inclusion of less affected subfields and reduced specificity due to a lack of distinction of the topography of hippocampal involvement. Such issues may particularly contribute to reported variance of hippocampal volume findings in early AD populations, including those with a-MCI.
To address this issue, several groups have developed methods to measure subfields at the macroscopic level, such as dividing the hippocampus into anterior and posterior regions [11, 12, 13], or attempted to visualize subfields by using a template-based approach [9, 11, 27, 28, 29, 30]. However, the T1-weighted sequences of these approaches appear to lack the contrast and resolution necessary to reliably visualize subfields at traditional magnet strengths (1.5–3 Tesla) and sequence length used in clinical research. Generally, T1-weighted images of this resolution (typically 1.0–1.5 mm isotropic) do not have sufficient gray matter contrast to visualize the dark band composed of stratum moleculare and stratum lacunosem which serves as a key landmark for defining the boundary between the CA4/DG region and the other CA subfields and the subiculum [20, 31]. Thus, the regional differences derived from T1-weighted MRI of clinical quality are likely approximate. To address this limitation, Van Leemput et al. [32] proposed to use ultra-high resolution T1-weighted MRI for automatic subfield segmentation. However, with an acquisition time of 35 minutes it is impractical for routine clinical use.
To facilitate subfield delineation in the clinical setting, several studies have exploited specifically tailored oblique coronal T2-weighted MRI sequences [33, 34, 35, 36, 37, 38, 39, 40, 41]. In these images, the dark band exhibits stronger contrast with the surrounding gray matter and serves as an anatomical landmark for separating subfields (see Figure 1). While studies utilizing this imaging sequence have revealed regional disease effects generally consistent with histological evidence (particularly greater involvement of CA1/CA2 atrophy in a-MCI [38]), to date these studies relied on manual annotation of hippocampal subfields, which is very time and labor intensive. Reliable segmentation of a single subject in one hemisphere usually requires 2–4 hours, while training a new rater and validating their work can take weeks. This makes manual segmentation particularly impractical for large clinical studies [42]. Although there have been great gains made in reliable methods of automatically segmenting the whole hippocampus [43, 44, 45, 46, 47, 48], the research in automatic subfield segmentation has been quite limited and focused on T1-weighted MRI.
Figure 1.

Coronal slice of the hippocampal body in a T1 scan (left; 1×1 mm in-plane resolution) and a T2 scan (right; 0.2×0.2 mm in-plane resolution) obtained from a 3T scanner. Both images were collected from the same subject in one session. The dark band that is necessary to separate CA from DG is completely indiscernible in the T1 image, while it is clear in the T2 image.
We recently published the first automatic subfield segmentation technique for T2-weighted MRI of the hippocampus2 with excellent accuracy relative to manual segmentation [49]. In that work, a segmentation was created by matching the subject to a series of atlases, generating a consensus segmentation using a regionally varying label fusion strategy, and further improving this segmentation using a learning-based error correction method [47]. The motivation of this paper is to evaluate this method on patients with a-MCI, a cohort expected to have hippocampal atrophy due predominantly to early AD, and to show its ability to detect subfield-specific atrophy that agrees with prior knowledge of patterns of AD-related hippocampal neurodegeneration [22, 23, 24, 26]. We present two hypotheses: first, that measures of CA1 volume would best discriminate a-MCI patients from healthy controls (HC) relative to other subfields and measures of whole hippocampal volume; second, that manual editing of automatic results further improves the discriminant ability of CA1 at a fraction of the cost of fully manual segmentation. The paper also demonstrates the ability of this method to transcend scanner and even field strength, as atlases derived from 4T MRI data are used to segment subjects scanned at 3T.
2. Methods
2.1 Subject Population
Forty-nine subjects (30 controls, 19 a-MCI) were recruited from the Penn Memory Center/Alzheimer’s Disease Center (PMC/ADC). Patients with a-MCI were diagnosed following the criteria described in [2]. All patients underwent extensive evaluation by a neurologist, psychiatrist, or gerontologist including physical and neurological exam, history from both patient and informant, and psychometric testing as described by the National Alzheimer’s Coordinating Center (NACC) Uniform Dataset (UDS) [50]. Diagnoses were determined by a consensus conference whose members included experienced clinicians at the PMC/ADC. MR data was not used in the clinical assessment. Controls and patients were matched for gender (p=0.743, by χ2) and age (p=0.749, by t-test), but patients had significantly more years of education than controls (p=0.022, by t-test). The atlases used in creating the segmentations were generated in a different study [49], and came from a separate dataset consisting of 32 subjects classified as control, mild cognitive impairment (MCI) of the AD type, or “cognitively impaired, non-demented (CIND).” See [35] for more detail on the demographics and classification of the subjects in the atlas dataset.
2.2 Image Acquisition
All subject images were acquired on a 3T Siemens Trio™ scanner at the Hospital of the University of Pennsylvania, using an 8-channel array coil. The following sequences were acquired: For the measurement of hippocampal subfields, a high resolution T2 weighted fast spin echo sequence (TR/TE: 5310/68 ms, echo train length 15, 18.3 ms echo spacing, 150° flip angle, 0% phase oversampling, 0.4 × 0.4 mm in plane resolution, 2 mm slice thickness, 30 interleaved slices with 0.6mm gap, acquisition time 7:12 min), angulated perpendicular to the long axis of the hippocampal formation, was obtained (adapted from [35, 51, 52]). For additional measurement of anatomical data, a T1-weighted gradient echo MRI (MPRAGE) TR/TE/TI=1600/3.87/950 ms, 15° flip angle, 1.0 × 1.0 × 1.0 mm3 resolution, acquisition time 5:13 min. Images used to create the atlases were collected on a Bruker MedSpec 4T system using a similar sequence [35].
2.3 Preprocessing
Raw DICOM data was loaded onto a Unix cluster and converted to NIFTI format using the dcm2nii DICOM converter [53]. Bilateral hippocampal formations were manually inspected in each T2-weighted image. Both manual and automatic segmentation rely on identifying the dark band consisting of stratum moleculare and stratum lacunosum [31], as this serves to separate CA4/DG from CA. Two subjects (1 a-MCI, 1 HC) were excluded because the dark band was not distinguishable due to anatomical variation, scanner noise, or motion artifact. Benign cysts, that often form from vestiges of the hippocampal sulcus during normal development, commonly appear in the hippocampus between CA and CA4/DG [39], and are especially conspicuous in T2 images (see Figure 2). These typically do not greatly deviate from the intensity of the surrounding tissue, and thus the automatic method splits the cyst between CA1 and CA4/DG (see Figure 3). However in two subjects (1 a-MCI, 1 HC), large cysts were so prominent that they induced a great deal of error in the registration process and their images were unable to be registered to any atlas. These subjects were also excluded from the analysis, leaving a total of 28 controls and 17 a-MCI subjects.
Figure 2.

Slice showing a section of the hippocampal body with a cyst between CA1 (red) and DG (blue).
Figure 3.
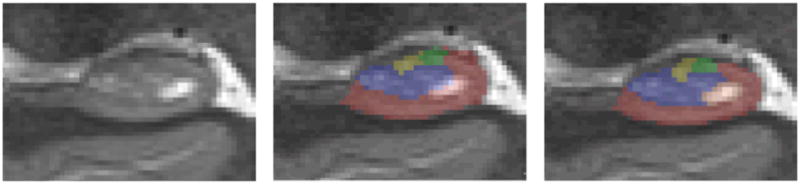
Coronal section of the hippocampal body with automatic segmentation (center) and manually corrected segmentation (right). The two methods differ mainly in selecting the dark band boundary. Also included in this slice is a hippocampal cyst, which the automatic method incorrectly includes in CA1 and DG labels, while manual segmentation excludes it altogether.
Intracranial volume (ICV) was computed from the T1 image by performing a high-dimensional diffeomorphic registration of each subject to a custom elderly adult brain image template (constructed for a different study, but using images obtained with the same sequence and from the same scanner) in which a binary mask of the intracranial region was defined. The inverse of the subject to template mapping was used to transform this mask to the space of the subject. ICV was then calculated as the volume of each subject specific mask. Registration and segmentation were performed using the ANTS software package [54].
2.4 Automatic Segmentation of Hippocampal Subfields
Segmentations of the hippocampal formation were generated using the Automatic Segmentation of Hippocampal Subfields (ASHS) method described in [49], which uses a combination of multi-atlas segmentation, similarity-weighted voting, and a learning-based bias correction technique to segment hippocampal subfields3. In that work, an automatic segmentation is generated using a combination of multi-atlas segmentation with label fusion [55, 56, 57, 58, 59] and voxel-wise error correction by a machine learning algorithm [47]. Specifically, the subject’s T2-weighted image is registered to a set of atlases (T2-weighted images of other subjects with manual segmentations), and the candidate segmentations provided by the different registered atlases are combined into a single consensus segmentation based on a voting scheme that is weighted locally by the image intensity similarity. Finally, the segmentation of each voxel is corrected by a classifier trained to recognize systematic errors made by the above approach. Subfield definitions were based on the method described in [35] but are expanded to cover the whole hippocampus, similar to [33, 60], with the following subfields defined: CA1, CA2, CA3, CA4/DG, subiculum, head, tail, and entorhinal cortex. Head and tail are macroscopic definitions of those hippocampal regions and are a combination of several subfields. Full details of the subfield manual segmentation protocol in T2-weighted MRI are available as supplementary material to [49]. To compare the ability of the automatic method to detect group differences at the level of the whole hippocampus, whole hippocampus masks were automatically generated in T1-weighted images a multi-atlas automatic segmentation method described in [47]. This method is nearly identical to the approach used for T2 segmentation, but slightly simpler, because it only involves single-modality registration (T1 to T1) between atlases and the target image. Like the method used for T2 data, the T1 segmentation method uses a machine learning post-processing step to correct systematic errors made by multi-atlas label fusion. Details of the method are provided in [47].
We hypothesize that despite its previous good performance, the automatic algorithm would be slightly inferior to trained manual operator in the ability to define subfield boundaries and subsequently detect subfield-specific differences between the populations. To assess the additional impact of manual tracings compared to the automatic process, a manual rater (JP) used ITK-SNAP to modify and correct the segmentations produced by the automatic method. The rater was blind to control or a-MCI diagnosis. Since these were only modifications to generated segmentations, each image took approximately 10 minutes, still greatly shortening the time for segmentation relative to a completely manual process. The CA2 and CA3 subfields, as well as the entorhinal cortex and subiculum were excluded from the analysis because the reliability of the manual segmentation using our protocol for these structures is low (Dice overlap below 80%) and thus atlas-based automatic segmentation is also unreliable [49]. Instead, the manual touchup and subsequent analyses focus on CA1 and CA4/DG subfields, for which inter-rater reliability of manual segmentation, as well as accuracy of automatic segmentation relative to manual segmentation, are in excess of 87% Dice overlap.
3. Data Analysis
3.1 Subfield Size Estimate
The low out-of-plane resolution of T2 images and the ensuing rule-based protocol for defining the anterior and posterior extents of the hippocampal body, in which subfields CA1-3 and CA4/DG are defined, require special consideration when deriving size measurements from segmentations, as there are many potential sources of variance. A standard metric is subfield volume, which is computed by adding up the number of voxels assigned to a particular subfield in the segmentation. However, for this type of data, volume is a poor estimate because it is proportional to the anterior-posterior extent of the hippocampal body, which itself is not reflective of the overall size of the hippocampus, but rather the extent of the region where the differentiation between subfields was deemed feasible and reliable. Furthermore, the position of the uncal apex (which determines the boundary between head and body slices) is not necessarily captured at a consistent point in each image (due to anatomical variability and low out-of-plane resolution). So two hippocampi could have comparable total volumes, but a large difference in measured subfield volumes due to differences in the number of body slices (see Figure 4). Another consideration is the slice angulation; though we attempt to align coronal slices to be orthogonal to the long axis of the hippocampus, there is some variability, which will have an effect on the apparent volume of a given slice. While the variance is not great enough to affect the number of slices, it can still impact volume measurements (see [61] for more detail).
Figure 4.

A single hippocampus from two control subjects, and a representative image of the slices captured by the T2 sequence. Head slices are in blue, body slices in red, and tail slices in purple. The shape of the hippocampus and heuristic rules for segmentation determine how slices are assigned to a particular region. The hippocampal volume and ICV in each subject are nearly identical, but the distribution of volume is not even between regions, resulting in fewer body slices in the left subject. Thus the absolute volume of CA1 would appear much lower in this subject, though in reality they are likely quite similar. To account for this, volume is normalized by the number of slices in a region.
To account for this variability, we normalize the total volume of each subfield by the number of slices spanned by the segmentation of that subfield. This method accounts for variability induced by slice angulation, and ensures that the variance in subfield volume is not dominated by the number of slices. Normalized volume, NVs, for subfield s is computed as:
where RVs is the raw volume of voxels assigned to that subfield, Ns is the number of slices spanned by it, and T is slice thickness.
In-plane volume is further normalized for the subject’s head size as:
where ICV is the intracranial volume, and is the mean intracranial volume of all subjects. ICV is taken to the two-thirds power, essentially scaling it to the in-plane estimate used for subfield volume. Since the effect of head size on hippocampal volume is most likely nonlinear [62], analysis was also repeated without ICV normalization, i.e., using NVs instead of in the analysis.
3.2 Statistical Analysis
Though there are some advantages to combining left and right hippocampal volumes, namely increased stability, we do not assume that rates of atrophy are uniform bilaterally in these populations. Thus left and right subfields were tested separately. The distribution of normalized volumes for each subfield was tested for normality using the Shapiro-Wilk test [63]. In virtually all cases, the result did not attain significance, implying that the areas were normally distributed. Thus, a standard multiple regression approach was used to model the influence of cohort and several covariates on average subfield area. For each subfield, was modeled as the dependent variable, while cohort, age and gender were included as independent variables. To evaluate the effects of manual segmentation correction, separate models were run with corrected and uncorrected CA1 and CA4/DG area as dependent variables. An identical analysis was also run on all subfields using normalized areas that were not corrected for ICV.
To compare the ability of the subfield measurements to discriminate groups with that of the whole hippocampus, similar linear regression models were constructed using the automatically generated T2 and T1 hippocampal volumes (derived from T2 and T1 sequences as described above) as the dependent variable. All of the same independent variables as from the subfield analysis were included. The low out of plane resolution and large slice gap in the T2 images means that whole hippocampal volume is almost certainly overestimated, and lacks the precision of the volume derived from the T1 image. We include analysis of the T2 whole hippocampal volumes only to compare its discriminant effects to individual subfields.
Receiver operating characteristic (ROC) curves were computed to compare discrimination of the different subfield volumes. ROC curves provide a graphical means to interpret diagnostic ability of a continuous variable; they are created by plotting sensitivity (true positives) versus 1 – specificity (false positives) for various thresholds. The discriminant value of some measure can be derived from the corresponding ROC curve by calculating the area under the curve (AUC). AUC values range from 0.5 (discrimination is no better than chance) to 1.0 (perfect discrimination). The hypothesis that the CA1 subfield is a better discriminant of the a-MCI condition was formally tested using the statistical test described in [64]. All statistical analysis was performed in R [65], and ROC curves were generated using the ROCR library [66].
4. Results
4.1 Statistical Results
Whole Hippocampal Volumes
Results from the T1 automatic segmentation were significant both in left (p=0.028, β=−82.43) and right (p=0.009, β=−92.94) hippocampus, with the a-MCI cohort being associated with smaller volumes. Whole hippocampal volumes as determined from the T2 images (the sum of subfields) did not reach significance at the p=0.05 level in the left (p=0.062, β=−73.94), but was significant in the right hippocampus (p=0.014, β=−99.52). In either side, whole hippocampal volume revealed a moderate discriminant ability (left, AUC=0.71; right, AUC=0.75). Without ICV correction, similar but somewhat weaker results were observed from the linear model and ROC curve analysis. Age also demonstrated a significant effect in these models.
Hippocampal Subfields
Results for CA1 and CA4/DG, with automatic segmentation and manual correction, are summarized in figures 5a and 5b. All of the results presented in this section are from data normalized for ICV; the results from the analysis without normalization found significance in all of the same regions and had similar p-values. Thus, for the sake of brevity, we include only the ICV normalized results. In the left hippocampus, group status (a-MCI, HC) significantly modulated the volume of the following subfields: CA1 (p=0.001, β=−3.35), CA4/DG (p=0.001, β=−2.55), head (p=0.018, β=−8.90), and tail (p=0.019, β=−4.60). In all cases, these subfields were smaller in the a-MCI group. Manual correction led to an even stronger group effect for the CA1 subfield (p<0.001, β=−4.27), but somewhat weaker for CA4/DG (p=0.021, β=−1.72). However, the latter model was no longer significant with the manually corrected DG (p=0.093).
Figure 5.


Figure 5a: Plots of normalized CA1 volume versus cohort. Volumes for the left hippocampus are in the left column of the figure. Automatically generated volumes are in the top row and manually corrected volumes in the bottom. In both cases, automatic segmentation detects statistically significant differences in volume by cohort, with manual correction displaying increased discrimination.
Figure 5b: Plots of normalized CA4/DG volume versus cohort. Automatic segmentation (top row) demonstrates significant results bilaterally, while manual correction reveals no significant difference in the right side and only a subtle effect of cohort on the left.
Results from the right hippocampus are analogous to the left except that there was generally more overlap between the two cohorts. An effect of cohort was observed for CA1 (p=0.029, β=−2.41), CA4/DG (p=0.028, β=−1.81), and head (p=0.002, β=−11.60), though not in tail (p>0.1). Again, manual correction led to a stronger group effect of CA1 (p=0.002, β=−3.53) and a non-significant effect of CA4/DG (p=0.174, β=−1.09).
The manually corrected CA1 subfield appeared to better discriminate the a-MCI group from the HC group based on the ROC analysis (Figure 6). However, only left manually corrected CA1 was statistically different from whole hippocampal volume in terms of discrimination (AUC: 0.84 vs 0.76, respectively; p=0.03). Consistent with the above findings, manual correction generally increased the discriminatory value of CA1 and reduced that of DG relative to the completely automatic segmentations.
Figure 6.

ROC curves and AUC values for left and right whole hippocampal volumes, CA1, and manually corrected CA1. Left manually corrected CA1 is a significantly better discriminant than whole hippocampal volume.
5. Discussion
The primary motivation for measuring subfields within the hippocampus in early AD is that the pathologic process exhibits topographic selectivity within this structure potentially limiting the sensitivity and specificity of whole hippocampal volumetric measures. The present results support the potential utility and practicality of such measurements in clinical practice. Semi-automatic T2 segmentation based on clinically feasible T2-weighted sequence (lasting approximately 7 minutes) was indeed able to detect subfield specific change in the hippocampus associated with the a-MCI condition and likely due to AD pathology. Furthermore, the large AUC of the CA1 subfield relative to whole hippocampal volume, even in a relatively small sample like the one studied here, suggests that this measure may indeed enhance prediction of group status and underlying AD pathology. That CA1 was the region most strongly associated with a-MCI status is consistent with the neuropathological literature, which describes NFT burden as being most robust in this region of the hippocampus early in the disease course [22, 23, 24, 25, 26]. Notably, significant differences were also detected in the left head and tail subfields, which is not surprising as they are largely composed of CA1.
While all of these differences were found using a fully automatic method, a brief manual correction of these segmentations resulted in further strengthening of the statistical power in the CA1 subfield. When error did occur with the automatic method, it generally involved demarcation of the dark band and assigning CA and CA4/DG labels accordingly (see Figure 3). It is not certain whether the segmentation error in the dark band is due primarily to the limitations of the atlas registration or to the inconsistency with which the dark band is divided between CA and CA4/DG subfields in the gold standard segmentations used in training the automatic method. The current protocol divides dark band evenly between CA and CA4/DG, and assigns dark band voxels to CA4/DG in the case that it is only one voxel thick. However, the dark band is narrow and subject to severe partial volume effects, which makes splitting it equally between subfields difficult. Inconsistencies in atlas manual segmentations would propagate and even be exacerbated by the automatic method. Overall, the errors in the automatic method involved overestimation of the CA1 volume and conversely, underestimation of the CA4/DG volume. Hippocampal cysts also pose a problem to automatic segmentation because their size, shape and location are highly irregular and are thus difficult to match to a template, even when using multi-atlas segmentation. Often, cysts do not differ greatly from the surrounding tissue in intensity, which results in them being erroneously included in the CA and CA4/DG labels. Despite these issues the overall degree of correction necessary is quite small; when comparing automatically generated segmentations to those that were manually corrected, both the CA1 and the CA4/DG subfields achieved an average Dice overlap coefficient of greater than 91%. Manual correction took approximately 10 minutes per subject and produced results comparable to fully manual segmentation at a fraction of the time.
Our results are largely consistent with [38], which used similar imaging and segmentation protocols (though all segmentations in their study were completed manually) to compare a-MCI subjects and healthy controls. Although the difference in CA1 volume between healthy controls and a-MCI subjects did not reach statistical significance in that study, the absolute difference in volume (an average of 325.7 vs. 296.9 mm3) indicate evidence of CA1 involvement. Furthermore, this group reported CA1 atrophy in AD patients relative to cognitively normal adults. Additionally, a CA1-2 region did reach statistical significance, and as found here, subfield effects were generally stronger than whole hippocampal measures. Whether the apparent difference between that study and the current work is due to issues of methodology or cohort characteristics is unclear, as our work segmented a larger region of the hippocampus and used a different metric to quantify atrophy. It is worth noting that at least one study that also utilized manual subfield segmentations did report bilateral CA3/DG atrophy in MCI patients relative to controls [30]. However, their segmentations were on T1-weighted images, in which the dark band is not visible, potentially limiting the reliability of subfield differentiation.
Most prior work on automatic hippocampal subfield segmentation [9, 27, 28, 29, 67] is based on the parcellation of the hippocampal surface into patches corresponding to different subfields. This surface-based approach does not adequately model the CA4/DG subfield, since it is largely internal to the hippocampal formation and shares only a small fraction of its surface area with the hippocampal surface. Thus it is not clear if perturbations in the surface of the hippocampus are due to degeneration in CA, DG, or both. However, surface-based analyses do have the advantage of being able to localize changes within specific areas in a particular subfield. In the future, both methods could potentially be combined to provide a more thorough analysis of subfield morphology, though this would require higher-resolution T2 data.
To date, only one study [68] has examined the effects of a-MCI on hippocampal subfields using an automatic segmentation approach that is volumetric, and thus able to distinguish between CA4/DG and other hippocampal subfields. However, this study reported surprising findings that run somewhat contrary to what is known about AD-related neurodegeneration. Specifically, [68] reported that hippocampal atrophy in a-MCI was most pronounced in the CA2-3 region. Significant differences were also found in the subiculum, and whole hippocampal volume trended towards significance. In contrast to the results presented here, no significant differences between a-MCI patients and controls were found in the CA1 region, and, in absolute terms, CA1 volumes were actually slightly larger in the a-MCI group, an unexpected finding. The differences in the findings may possibly be explained by methodological differences between the present approach and that of [68].
The data in [68] consist of T1-weighted images obtained at 1 mm3 isotropic resolution. It is hard, if not impossible, to distinguish the dark band visually in this modality (see Figure 1), which explains the lack of published protocols for manual segmentation of CA4/DG in 1 mm3 T1-weighted MRI. To segment these data, the authors apply the method described in [32], which has been trained and validated using ultra-high resolution T1 images, and, to our knowledge, has not been validated on lower resolution MRI data. Such a validation would, in fact, be challenging to perform, given the difficulty of manual segmentation at this resolution. Thus, it is not possible to estimate the accuracy of the subfield segmentation in [68], even relative to a weak gold standard such as manual segmentation. By contrast, our approach is based on high in-plane resolution oblique coronal T2-weighted MRI, where the dark band is more visible to the human eye, and where manual segmentation protocols have been published and validated [34, 35, 60]. Our method itself has been validated in data similar in resolution and contrast mechanism to the data studied in this paper.
The anatomical definitions of the subfields themselves are substantially different between the present paper and [68]. In that work, subfield labels are propagated from an ultra-high resolution template. The protocol used to label the template, described in [32], is based on heuristic rules defined by the anatomy of the hippocampus as a whole rather than the location of the dark band. Both in the template and in the subjects’ images shown in [68], the CA2-3 region appears as the largest subfield, while CA1 is the smallest subfield. This is contrary to published estimates of subfield size from histological samples [69], as well as manual segmentation protocols for T2-weighted MRI that are guided by histology [33, 35, 36, 37, 38, 60], which all describe CA1 and subiculum as the largest subfields, and CA2-3 much smaller by comparison. Our results are based on a protocol derived from [35] and the relative sizes of the subfields in our paper are consistent with histology.
Given these differences in modality and anatomical labeling between [68] and the present work, it is difficult to pinpoint the specific reason for different results. However, one plausible explanation is that both methods are seeing a-MCI effects in the same anatomical region, but are assigning it to different anatomical labels due to differences in protocol.
A major advantage of semi-automatic segmentation is that it is largely stable across raters, as there is only a small degree of manual correction, and it could be used to quickly generate data to compare results across studies. Even with manual correction, the overall time for segmentation is considerably less than would be the case for a completely manual approach. Nonetheless, continued refinement of the automatic technique will potentially obviate the need for this manual correction in the future. Importantly, this method is robust with regard to similar, but not identical, T2-weighted MR scans; although the atlases used for this paper were developed on data acquired at 4T, we still show satisfactory results with a separate dataset collected at 3T, implying that training data can be used from one source and applied to alternative acquisitions. The main implication is that there is no need to go through the time consuming process of manual creating an atlas set for each new dataset. This is particularly useful for data with higher out-of-plane resolution and many more coronal slices, such as [34, 70]. Finally, it is worth noting that while manual correction served to enhance the relative sensitivity to a-MCI status of CA1 compared to CA4/DG in both hemispheres, a result consistent with expected pathologic topography of early AD, the fully automatic measures of CA1 and CA4/DG in the left hemisphere still produced greater sensitivity to a-MCI than whole-hippocampal measures.
The current results provide further support for the potential enhanced sensitivity for detection and monitoring of early AD with a subfield approach versus traditional whole hippocampal measurements. Given the relatively short acquisition time of the T2-weighted sequence utilized and the automated segmentation methodology, such an approach could realistically be implemented into clinical trials and practice. Nonetheless, additional improvements to the protocol are needed. While our results demonstrate significant atrophy in the hippocampal head, our inability to segment this region into subfields limits interpretation and, perhaps, the sensitivity of this region. Additionally, extrahippocampal MTL structures may precede CA1 NFT deposition and thus contribute to even earlier detection of change [24]. Indeed, atrophy of both the entorhinal cortex [38, 71, 72] and the perirhinal cortex [72] appears present in MCI, and may be both an earlier and more sensitive biomarker of cognitive decline than the hippocampus [17, 73]. However, there is a great deal of variability in appearance and boundary definitions of these structures, and they are particularly susceptible to artifact induced by motion and the presence of arteries. The dark band is similarly susceptible to motion artifact and two subjects had to be excluded for this reason, though we note this could be mitigated by acquiring an additional T2 scan within one session. Another notable weakness of the T2 sequence utilized in this study is that the low out-of-plane resolution limits sensitivity to changes in the radial direction of the hippocampus, while being largely insensitive to changes along the anterior-posterior axis. Despite these issues, we still observed that subfields improved discrimination above whole hippocampal volumes, which motivates research into improving automatic segmentation for more structures, and studying subfield morphology at higher resolution.
For practical application to large clinical studies, hippocampal volumetry requires automated methods [42], thus this work represents an important step in establishing the practicality of automatic segmentation for subfield analyses. However, it is difficult to make meaningful comparisons across studies when the segmentation protocol is not the same (as is the case in [68]). An ongoing project funded by the Alzheimer’s Association (available at http://www.hippocampal-protocol.net) aims to create a harmonized segmentation protocol for the hippocampal formation in standard T1 images, and a similar standardized protocol is highly desirable for T2 images and hippocampal subfields in general. To this end, future work will focus on leveraging histology and ultra-high resolution MR data [34, 69, 70, 74, 75] to create atlases based on actual cell shape and density, rather than any heuristic rule, and in that way creating a true gold standard. Furthermore, these modalities allow sufficient detail to segment the complex inner structure of the hippocampal head, tail, and associated cortical structures. Additional work is currently being done using advanced registration methods to map histology segmentation to corresponding, ultra-high resolution MR data, and in this way bring the cell-defined regions into MR space. Atlases based on the underlying cellular composition of the hippocampus would provide an important step towards a unified subfield protocol.
Table 1.
Subject demographics and neuropsychological test results
| Control (N=28) | a-MCI (N=17) | |||
|---|---|---|---|---|
|
| ||||
| Mean (SD) | Range | Mean (SD) | Range | |
| Age | 69.46 (9.18) | 54–85 | 70.24 (7.75) | 58–80 |
| Education (Yrs) | 16.21 (2.94) | 12–20 | 17.94 (1.75)* | 14–20 |
| Gender (M/F) | 14/14 | 7/10 | ||
| MMSE | 29.50 (0.83) | 27–30 | 27.71 (1.58)*** | 25–30 |
| Trails A | 30.14 (10.84) | 18–68 | 37.82 (13.10) | 19–56 |
| Trails B | 73.93 (36.85) | 38–212 | 108.18 (59.97)* | 41–300 |
| Category (animals) | 23.78 (4.91) | 14–31 | 13.82 (7.94)*** | 1–23 |
| Digit Span Forwards | 6.93 (1.05) | 5–8 | 6.71 (0.85) | 5–8 |
| Digit Span Backwards | 5.25 (1.38) | 2–7 | 4.59 (0.80) | 3–6 |
| CERAD 10-Item Word List Immediate Recall (sum of Trials 1–3) | 23.81 (3.53) | 19–29 | 17.71 (3.16)*** | 11–23 |
| CERAD 10-Item Word List Delayed Recall | 8.46 (1.64) | 4–10 | 3.53 (1.77)*** | 0–6 |
Values are mean (SD)
Control significantly different from a-MCI, p<0.05.
Control significantly different from a-MCI, p<0.01.
Control significantly different from a-MCI, p<0.001.
Table 2.
Normalized Subfield Volume
| Control (n=28) | MCI (n=17) | Control (n=28) | MCI (n=17) | |
|---|---|---|---|---|
|
| ||||
| Left | Right | |||
| CA1 | 27.57 (3.35) | 24.05 (3.06)** | 26.49 (3.03) | 23.78 (4.20)* |
| CA1 (corrected) | 26.96 (3.41) | 22.47 (3.45)*** | 26.07 (3.13) | 22.60 (3.78)** |
| CA2 | 1.32 (0.40) | 1.31 (0.44) | 1.7 (0.47) | 1.51 (0.39) |
| CA3 | 1.31 (0.50) | 2.23 (0.69) | 2.89 (0.63) | 2.65 (0.64) |
| CA4/DG | 16.47 (2.16) | 13.86 (2.60)** | 15.82 (2.42) | 13.92 (2.86)* |
| CA4/DG (corrected) | 17.10 (2.11) | 15.33 (2.56) | 16.83 (2.42) | 15.85 (2.80) |
| Head | 85.8 (12.72) | 76.85 (10.24)* | 94.55 (9.55) | 83.25 (13.49)** |
| Tail | 40.18 (6.15) | 35.45 (6.08)* | 36.50 (7.67) | 33.74 (5.85) |
|
| ||||
| Total Volume (T1) | 812.523 (110.83) | 726.25 (130.28)* | 777.85 (106.85) | 686.42 (129.15)* |
| Total Volume (T2) | 975.88 (121.99) | 900.81 (137.79) | 1004.89 (116.23) | 910.20 (146.96)* |
Values are mean (SD)
Control significantly different from a-MCI, p<0.05.
Control significantly different from a-MCI, p<0.01.
Control significantly different from a-MCI, p<0.001.
Acknowledgments
The project described was supported by Grant Numbers K25-AG027785, K23-AG028018, P30AG010124, and R01 AG037376 from the National Institute on Aging. The content is solely the responsibility of the authors and does not necessarily represent the official views of the National Institute on Aging or National Institutes of Health. The imaging data used as atlases for automatic segmentation, as well as invaluable input for segmentation and analysis of this data, were provided by Prof. Michael D. Weiner, M.D., and Prof Susanne Mueller, M.D. at the Center for Imaging of Neuroimaging Diseases (CIND) at the San Francicso Veterans Affairs Medical Center and the University of California at San Francisco.
Footnotes
The names and anatomical definitions of hippocampal subfields vary among different authors. This paper adopts the nomenclature of [20, 21] in which the hippocampus proper, or cornu ammonis (CA), consists of the subfields CA1, CA2, and CA3, and the subfield referred to as CA4 by Duvernoy [21] and others is called the hilus of the dentate gyrus. Due to the relatively low resolution of MRI, we use “CA4/DG” to refer to the combination of the DG proper and the hilus of the DG
The ASHS software is available for download at http://www.nitrc.org/projects/ashs/ and full details of the segmentation protocol are available at http://picsl.upenn.edu/Resources
In our prior report, slices were manually tagged as belonging to head, tail, and body regions of the hippocampus in order to ensure a consistent and fair comparison with manual segmentation. Such manual tagging is not used in the current paper, because its goal is not to evaluate the reliability of manual segmentation. Instead of manual slice tagging, we enforce a heuristic that all voxels in a given slice belong to only one region: head, body, or tail. Thus, the ASHS method in the current paper is fully automatic
References
- 1.Jack CR, Petersen RC, Xu Y, O’Brien PC, Smith GE, Ivnik RJ, Boeve BF, Tangalos EG, Kokmen E. Rates of hippocampal atrophy correlate with change in clinical status in aging and AD. Neurology. 2000;55:484–489. doi: 10.1212/wnl.55.4.484. [DOI] [PMC free article] [PubMed] [Google Scholar]
- 2.Petersen RC. Mild cognitive impairment as a diagnostic entity. J Intern Med. 2004;256:183–194. doi: 10.1111/j.1365-2796.2004.01388.x. [DOI] [PubMed] [Google Scholar]
- 3.Winblad B, Palmer K, Jelic V, Fratiglioni L, Wahlund LO, Nordberg A, Backman L, Albert M, Almkvist O, Arai H, Basun H, Blennow K, de Leon M, DeCarli C, Erkinjuntti T, Glacobini E, Graff C, Hardy J, Jack C, Jorm A, Ritchie K, van Duijn C, Visser P, Petersen RC. Mild cognitive impairment – beyond controversies, towards a consensus: report of the International Working Group on Mild Cognitive Impairment. J Intern Med. 2004;256:240–246. doi: 10.1111/j.1365-2796.2004.01380.x. [DOI] [PubMed] [Google Scholar]
- 4.Pennanen C, Kivipelto M, Tuomainen S, Hartikainen P, Haninen T, Laakso M, Hallikainen M, Vanhanen M, Nissinen A, Helkala E, Vainioe P, Vanninene R, Partanene K, Soininen H. Hippocampus and entorhinal cortex in mild cognitive impairment and early AD. Neurobiol Aging. 2004;25:303–310. doi: 10.1016/S0197-4580(03)00084-8. [DOI] [PubMed] [Google Scholar]
- 5.Shi F, Liu B, Zhou Y, Chunshui Y, Jiang T. Hippocampal volume and asymmetry in mild cognitive impairment and Alzheimer’s disease: Meta-analyses of MRI studies. Hippocampus. 2009;19:1055–1064. doi: 10.1002/hipo.20573. [DOI] [PubMed] [Google Scholar]
- 6.Fox NC, Warrington EK, Stevens JM, Rossor MN. Atrophy of the hippocampal formation in early familial Alzheimer’s disease. A longitudinal MRI study of at-risk members of a family with an amyloid precursor protein 717Val-Gly mutation. Ann N Y Acad Sci. 1996;777:226–232. doi: 10.1111/j.1749-6632.1996.tb34423.x. [DOI] [PubMed] [Google Scholar]
- 7.Jack CR, Petersen RC, O’Brien PC, Tangalos EG. MR-based hippocampal volumetry in the diagnosis of Alzheimer’s disease. Neurology. 1992;42:183–188. doi: 10.1212/wnl.42.1.183. [DOI] [PubMed] [Google Scholar]
- 8.Jack CR, Petersen RC, Xu Y, O’Brien PC, Smith GE, Ivnik RJ, Boeve BF, Tangalos EG, Kokemon E. Rates of hippocampal atrophy correlate with change in clinical status in aging and AD. Neurology. 2000;55:484–489. doi: 10.1212/wnl.55.4.484. [DOI] [PMC free article] [PubMed] [Google Scholar]
- 9.Apostolova LG, Mosconi L, Thompson PM, Green AE, Hwang KS, Ramirez A, Mistur R, Tsui WH, de Leon MJ. Subregional hippocampal atrophy predicts Alzheimer’s dementia in the cognitively normal. Neurobiol Aging. 2010;31:1077–1088. doi: 10.1016/j.neurobiolaging.2008.08.008. [DOI] [PMC free article] [PubMed] [Google Scholar]
- 10.Morra JH, Zu T, Apostolova LG, Green AE, Avedissian C, Madsen SK, Parikshak N, Hua X, Toga AW, Jack CR, Schuff N, Weiner MW, Thompson PM. Automated 3D mapping of hippocampal atrophy and its clinical correlates in 400 subjects with Alzheimer’s disease, mild cognitive impairment, and elderly controls. Hum Brain Mapp. 2009;30:2766–2788. doi: 10.1002/hbm.20708. [DOI] [PMC free article] [PubMed] [Google Scholar]
- 11.Wang L, Swank JS, Glick IE, Gado MH, Miller MI, Morris JC, Csernansky JG. Changes in hippocampal volume and shape across time distinguish dementia of the Alzheimer type from healthy aging. Neuroimage. 2003;20:667–682. doi: 10.1016/S1053-8119(03)00361-6. [DOI] [PubMed] [Google Scholar]
- 12.Wolf H, Grunwald M, Kruggel F, Riedel-Heller SG, Angerhofer S, Hojjatoleslami A, Hensel A, Arendt T, Gertz H. Hippocampal volume discriminates between normal cognition; questionable ad mild dementia in the elderly. Neurobiol Aging. 2001;22:177–186. doi: 10.1016/s0197-4580(00)00238-4. [DOI] [PubMed] [Google Scholar]
- 13.Wolf H, Hensel A, Kruggel F, Riedel-Heller SG, Arendt T, Wahlund LO, Gertz HJ. Structural correlates of mild cognitive impairment. Neurobiol Aging. 2004;25:913–924. doi: 10.1016/j.neurobiolaging.2003.08.006. [DOI] [PubMed] [Google Scholar]
- 14.Hsu YY, Schuff N, Du AT, Mark K, Zhu X, Hardin D, Weiner MW. Comparison of automated and manual MRI volumetry of hippocampus in normal aging and dementia. J Magn Reson Imaging. 2002;16:305–310. doi: 10.1002/jmri.10163. [DOI] [PMC free article] [PubMed] [Google Scholar]
- 15.Shen L, Saykin A, McHugh T, West J, Rabin L, Wishart H, Chung M, Makedon F. Morphometric MRI study of hippocampal shape in MCI using spherical harmonics. Alzheimer’s and dementia. 2005;1(1 Supplement):S47. [Google Scholar]
- 16.Jessen F, Feyen L, Freymann K, Tepest R, Maier W, Heun R, Schild HH, Scheef L. Volume reduction of the entorhinal cortex in subjective memory impairment. Neurobiol Aging. 2006;27:1751–1756. doi: 10.1016/j.neurobiolaging.2005.10.010. [DOI] [PubMed] [Google Scholar]
- 17.De Leon MJ, DeSanti S, Zinkowski R, Mehta PD, Pratico D, Segal S, Rusinek H, Li J, Tsui W, Saint Louis LA, Clark CM, Li Y, Lair L, Javier E, Rich K, Lesbre P, Mosconi L, Reisberg B, Sadowski M, DeBernadis JF, Kerkman DJ, Hampel H, Wahlund LO, Davies P. Longitudinal CSF and MRI biomarkers improve the diagnosis of mild cognitive impairment. Neurobiol Aging. 2006;27:394–401. doi: 10.1016/j.neurobiolaging.2005.07.003. [DOI] [PubMed] [Google Scholar]
- 18.Petersen RC, Roberts R, Knopman D, Boeve B, Geda Y, Ivnik R, Smith G, Jack C. Mild cognitive impairment: ten years later. Arch Neurol. 2009;66:1447–1455. doi: 10.1001/archneurol.2009.266. [DOI] [PMC free article] [PubMed] [Google Scholar]
- 19.Wolk DA, Price JC, Saxton JA, Snitz BE, James JA, Lopez OL, Aizenstein HJ, Cohen AD, Weissfeld LA, Mathis CA, Klunk WE, DeKosky ST. Amyloid imaging in mild cognitive impairment subtypes. Ann Neurol. 2009;65:557–568. doi: 10.1002/ana.21598. [DOI] [PMC free article] [PubMed] [Google Scholar]
- 20.Amaral D, Lavenex P. Hippocampal neuroanatomy. In: Andersen P, Morris R, Amaral D, Bliss T, O’Keefe J, editors. The hippocampus book. Oxford University Press; New York: 2007. pp. 37–129. [Google Scholar]
- 21.Duvernoy H. Functional anatomy, vascularization, and serial sections with MRI. 3. Springer-Verlag; New York: 2005. The human hippocampus; p. 232. [Google Scholar]
- 22.Bobinski M, Wegiel J, Tarnawski M, Bobinski M, Reisberg B, de Leon MJ, Miller DC, Wisniewsk HM. Relationships between regional neuronal loss and neurofibrillary changes in the hippocampal formation and duration and severity of Alzheimer disease. J Neuropathol Exp Neurol. 1997;56:414–420. doi: 10.1097/00005072-199704000-00010. [DOI] [PubMed] [Google Scholar]
- 23.Bobinksi M, de Leon MJ, Tarnawski M, Wegiel J, Bobinski M, Reisberg B, Miller DC, Wisniewski HM. Neuronal and volume loss in CA1 of the hippocampal formation uniquely predicts duration and severity of Alzheimer disease. Brain Research. 1998;805:267–269. doi: 10.1016/s0006-8993(98)00759-8. [DOI] [PubMed] [Google Scholar]
- 24.Braak H, Braak E. Neuropathological staging of Alzheimer-related changes. Acta Neuropathol. 1991;82:239–259. doi: 10.1007/BF00308809. [DOI] [PubMed] [Google Scholar]
- 25.Mattson MP, Guthrie PB, Kater SB. Intrinsic factors in the selective vulnerability of hippocampal pyramidal neurons. Prog Clin Biol Res. 1989;317:333–351. [PubMed] [Google Scholar]
- 26.West MJ, Coleman PD, Flood DG, Troncoso JC. Differences in the pattern of hippocampal neuronal loss in normal ageing and Alzheimer’s disease. Lancet. 1994;344:769–772. doi: 10.1016/s0140-6736(94)92338-8. [DOI] [PubMed] [Google Scholar]
- 27.Apostolova LG, Dinov ID, Dutton RA, Hayashi KM, Toga AW, Cummings JL, Thompson PM. 3D comparison of hippocampal atrophy in amnestic mild cognitive impairment and Alzheimer’s disease. Brain. 2006;129:2867–2873. doi: 10.1093/brain/awl274. [DOI] [PubMed] [Google Scholar]
- 28.Apostolova LG, Dutton RA, Dinov ID, Hayashi KM, Toga AW, Cummings JL, Thompson PM. Conversion of mild cognitive impairment to Alzheimer disease predicted by hippocampal atrophy maps. Arch Neurol. 2006;63:693–699. doi: 10.1001/archneur.63.5.693. [DOI] [PubMed] [Google Scholar]
- 29.Apostolova LG, Thompson PM, Green AE, Hwang KS, Zoumalan C, Jack CR, Harvey DJ, Petersen RC, Thal LJ, Aisen PS, Toga AW, Cummings JL, DeCarli CS. 3D comparison of low, intermediate, and advanced hippocampal atrophy in MCI. Hum Brain Mapp. 2010;31:786–797. doi: 10.1002/hbm.20905. [DOI] [PMC free article] [PubMed] [Google Scholar]
- 30.Yassa MA, Stark SM, Bakker A, Albert MS, Gallagher M, Stark CE. High-resolution structural and functional MRI of hippocampal CA3 and dentate gyrus in patients with amnestic Mild Cognitive Impairment. Neuroimage. 2010;51:1242–1252. doi: 10.1016/j.neuroimage.2010.03.040. [DOI] [PMC free article] [PubMed] [Google Scholar]
- 31.Eriksson SH, Thom M, Bartlett PA, Symms MR, McEvoy AW, Sisodiya SM, Duncan JS. Propeller MRI visualizes detailed pathology of hippocampal scelrosis. Epilepsia. 2008;49:33–39. doi: 10.1111/j.1528-1167.2007.01277.x. [DOI] [PMC free article] [PubMed] [Google Scholar]
- 32.Van Leemput K, Bakkour A, Benner T, Wiggins G, Wald LL, Augustinack J, Dickerson BC, Golland P, Fischl B. Automated segmentation of hippocamal subfields from ultra-high resolution in vivo MRI. Hippocampus. 2009;19:549–557. doi: 10.1002/hipo.20615. [DOI] [PMC free article] [PubMed] [Google Scholar]
- 33.La Joie R, Fouquet M, Mezenge F, Landeau B, Villain N, Mevel K, Pelerin A, Eustache F, Desgranges B, Chetelat G. Differential effect of age on hippocampal subfields assessed using a new high-resolution 3T MR sequence. Neurimage. 2010;53:506–514. doi: 10.1016/j.neuroimage.2010.06.024. [DOI] [PubMed] [Google Scholar]
- 34.Malykhin NV, Lebel RM, Coupland NJ, Wilman AH, Carter R. In vivo quantification of hippocampal subfields using 4.7 T fast spin echo imaging. Neuroimage. 2010;49:1224–1230. doi: 10.1016/j.neuroimage.2009.09.042. [DOI] [PubMed] [Google Scholar]
- 35.Mueller SG, Stables L, Du AT, Schuff N, Truran D, Cashdollar N, Weiner MW. Measurement of hippocampal subfields and age-related changes with high resolution MRI at 4T. Neruobiol Aging. 2007;28:719–726. doi: 10.1016/j.neurobiolaging.2006.03.007. [DOI] [PMC free article] [PubMed] [Google Scholar]
- 36.Mueller SG, Schuff N, Raptentsetsang S, Elman J, Weiner MW. Selective effect of Apo e4 on CA3 and dentate in normal aging and Alzheimer’s disease using high resolution MRI at 4T. Neuroimage. 2008;42:42–48. doi: 10.1016/j.neuroimage.2008.04.174. [DOI] [PMC free article] [PubMed] [Google Scholar]
- 37.Mueller SG, Weiner MW. Selective effect of age, apo e4, and Alzheimer’s disease on hippocampal subfields. Hippocampus. 2009;19:558–564. doi: 10.1002/hipo.20614. [DOI] [PMC free article] [PubMed] [Google Scholar]
- 38.Mueller SG, Schuff N, Yaffe K, Madison C, Miller B, Weiner MW. Hippocampal atrophy patterns in mild cognitive impairment and Alzheimer’s disease. Hum Brain Mapp. 2010;31:1339–1347. doi: 10.1002/hbm.20934. [DOI] [PMC free article] [PubMed] [Google Scholar]
- 39.Thammaroj J, Santosh C, Bhattacharya J. The hippocampus: modern imaging of its anatomy and pathology. Prac Neurol. 2005;5:150–159. [Google Scholar]
- 40.Zeineh MM, Engel SA, Bookheimer SY. Application of cortical unfolding techniques to functional MRI of the human hippocampal region. Neuroimage. 2000;11:668–683. doi: 10.1006/nimg.2000.0561. [DOI] [PubMed] [Google Scholar]
- 41.Zeineh MM, Engel SA, Thompson PM, Bookheimer SY. Dynamics of the hippocampus during encoding and retrieval of face-name pairs. Science. 2003;299:577–580. doi: 10.1126/science.1077775. [DOI] [PubMed] [Google Scholar]
- 42.Jack CR, Barkhof F, Bernstein MA, Cantillon M, Cole PE, DeCarli C, Dubois B, Duchesne S, Fox NC, Frisoni GB, Hampel H, Hill DL, Johnson K, Mangin JF, Scheltens P, Schwarz AZ, Sperling R, Suhy J, Thompson PM, Weiner M, Foster NL. Steps to standardization and validation of hippocampal volumetry as a biomarker in clinical trails and diagnostic criterion for Alzheimer’s disease. Alzheimers Dement. 2011;7:474–485. doi: 10.1016/j.jalz.2011.04.007. [DOI] [PMC free article] [PubMed] [Google Scholar]
- 43.Collins DL, Pruessner JC. Towards accurate, automatic segmentation of the hippocampus and amygdala from MRI by augmenting ANIMAL with a template library and label fusion. Neuroimage. 2010;52:1355–1366. doi: 10.1016/j.neuroimage.2010.04.193. [DOI] [PubMed] [Google Scholar]
- 44.Chupin M, Hammers A, Liu RS, Colliot O, Burdett J, Bardinet E, Duncan JS, Garnero L, Lemieux L. Automatic segmentation of the hippocampus and the amygdala driven by hybrid constraints: method and validation. Neuroimage. 2009;46:749–761. doi: 10.1016/j.neuroimage.2009.02.013. [DOI] [PMC free article] [PubMed] [Google Scholar]
- 45.Leung KK, Barnes J, Ridgway GR, Bartlett JW, Clarkson MJ, MacDonald K, Schuff N, Fox NC, Ourselin S. Automated cross-sectional and longitudinal hippocampal volume measurement in mild cognitive impairment and Alzheimer’s disease. Neuroimage. 2010;51:1345–1359. doi: 10.1016/j.neuroimage.2010.03.018. [DOI] [PMC free article] [PubMed] [Google Scholar]
- 46.Morra J, Tu Z, Apostolova L, Green A, Avedissian C, Madsen S, Parishak N, Hua X, Toga A, Jack C, Jr, et al. Automated 3D mapping of hippocampal atrophy and its clinical correlates in 400 subjects with Alzheimer’s disease, mild cognitive impairment, and elderly controls. Hum Brain Mapp. 2009;30:2766–2788. doi: 10.1002/hbm.20708. [DOI] [PMC free article] [PubMed] [Google Scholar]
- 47.Wang H, Das S, Wook Suh J, Altinay M, Pluta J, Craige C, Avants B, Yushkevich P. A learning-based wrapper method to correct systematic errors in automatic image segmentation: consistently improved performance in hippocampus, cortex and brain segmentation. Neuroimage. 2011;55:968–985. doi: 10.1016/j.neuroimage.2011.01.006. [DOI] [PMC free article] [PubMed] [Google Scholar]
- 48.Wolz R, Aljabar P, Rueckert D, Heckermann R, Hammers A. Segmentation of subcortical structures in brain MRI using graph-cuts and subject-specific a priori information. IEEE International Symposium on Biomedical Imaging; 2009. pp. 470–473. [Google Scholar]
- 49.Yushkevich PA, Wang H, Pluta J, Das SR, Craige C, Avants BB, Weiner MW, Mueller S. Nearly automatic segmentation of hippocampal subfields in in vivo focal T2 weighted MRI. Neuroimage. 2010;53:1208–1224. doi: 10.1016/j.neuroimage.2010.06.040. [DOI] [PMC free article] [PubMed] [Google Scholar]
- 50.Morris JC, Weintraub S, Chui HC, Cummings J, Decarli C, Ferris S, Foster NL, Galasko D, Graff-Radford N, Peskind ER, Beekly D, Ramos EM, Kukull WA. The uniform data set (UDS): clinical and cognitive variables and descriptive data from Alzheimer Disease Centers. Alzheimer Dis Assoc Disord. 2006;20:210–216. doi: 10.1097/01.wad.0000213865.09806.92. [DOI] [PubMed] [Google Scholar]
- 51.Thomas DL, De Vita E, Roberts S, Turner R, Yousry TA, Ordidge RJ. High resolution fast spin echo imaging of the human brain at 4.7T: Implementation and sequence characteristics. Magn Reson Med. 2004;51:1254–1264. doi: 10.1002/mrm.20106. [DOI] [PMC free article] [PubMed] [Google Scholar]
- 52.De Vita E, Thomas DL, Roberts S, Parkes HG, Turner R, Kinchesh P, et al. High resolution MRI of the brain at 4.7 Tesla using fast spin echo imaging. Br J Radiol. 2003;76:631–637. doi: 10.1259/bjr/69317841. [DOI] [PubMed] [Google Scholar]
- 53.Rorden C, Brett M. Stereotaxic display of brain lesions. Behav Neurol. 2000;12:191–200. doi: 10.1155/2000/421719. [DOI] [PubMed] [Google Scholar]
- 54.Avants BB, Epstein CL, Grossman M, Gee JC. Symmetric diffeomorphic image registration with cross-correlation: Evaluating automated labeling of elderly and neurodegenerative brain. Med Image Anal. 2008;12:26–41. doi: 10.1016/j.media.2007.06.004. [DOI] [PMC free article] [PubMed] [Google Scholar]
- 55.Aljabar P, Heckermann RA, Hammers A, Hajnal JV, Rueckert D. Multi-atlas based segmentation of brain images: atlas selection and its effect on accuracy. Neuroimage. 2009;46:726–738. doi: 10.1016/j.neuroimage.2009.02.018. [DOI] [PubMed] [Google Scholar]
- 56.Heckemann RA, Hajnal JV, Aljabar P, Rueckert D, Hammers A. Automatic anatomical brain MRI segmentation combining label propagation and decision fusion. Neuroimage. 2006;33:115–126. doi: 10.1016/j.neuroimage.2006.05.061. [DOI] [PubMed] [Google Scholar]
- 57.Rohlfing T, Brandt R, Menzel R, Maurer CR. Evaluation of atlas selection strategies for atlas-based image segmentation with application to confocal microscopy images of bee brains. Neuroimage. 2004;21:1428–1442. doi: 10.1016/j.neuroimage.2003.11.010. [DOI] [PubMed] [Google Scholar]
- 58.Sabuncu MR, Yeo BT, Leemput K, Fischl B, Golland P. A generative model for image segmentation based on label fusion. IEEE Trans on Med Imaging. 2010;29:1714–1720. doi: 10.1109/TMI.2010.2050897. [DOI] [PMC free article] [PubMed] [Google Scholar]
- 59.Warfield SK, Zou K, Wells W. Simultaneous truth and performance level estimation (STAPLE): An algorithm for the validation of image segmentation. IEEE Trans Med Imaging. 2004;23:903–921. doi: 10.1109/TMI.2004.828354. [DOI] [PMC free article] [PubMed] [Google Scholar]
- 60.Shing YL, Rodrigue KM, Kennedy KM, Fandakova Y, Bodammer N, Werkle-Bergner M, Lindenberger U, Raz N. Hippocampal subfield volumes: age, vascular risk, and correlation with associative memory. Front Aging Neurosci. 2011;3:1–8. doi: 10.3389/fnagi.2011.00002. [DOI] [PMC free article] [PubMed] [Google Scholar]
- 61.Das S, Avants B, Pluta J, Wang H, Wook J, Weiner M, Mueller S, Yushkevich P. Measuring longitudinal change in the hippocampal formation from in vivo high-resolution T2-weighted MRI. Neuroimage. 2012;60:1266–1279. doi: 10.1016/j.neuroimage.2012.01.098. [DOI] [PMC free article] [PubMed] [Google Scholar]
- 62.Barnes J, Ridgway GR, Bartlett J, Henley SM, Lehmann M, Hobbs N, Clarkson MJ, MacManus DG, Ourselin S, Fox NC. Head size, age and gender adjustment in MRI studies: a necessary nuisance? Neuroimage. 2010;53:1244–1255. doi: 10.1016/j.neuroimage.2010.06.025. [DOI] [PubMed] [Google Scholar]
- 63.Shapiro S, Wilk M. An analysis of variance test for normality (complete samples) Biometrika. 1965;52:591–611. [Google Scholar]
- 64.Hanley J, McNeil B. A method of comparing the areas under receiver operating characteristic curves derived from the same cases. Radiology. 1983;148:839–843. doi: 10.1148/radiology.148.3.6878708. [DOI] [PubMed] [Google Scholar]
- 65.R Development Core Team. R: A language and environment for statistical computing. R Foundation for Statistical Computing; Vienna, Austria: 2010. URL http://www.R-project.org. [Google Scholar]
- 66.Sing T, Sander O, Beerenwinkel N, Lengauer T. ROCR: visualizing classifier performance in R. Bioinformatics. 2005;21:3940–3941. doi: 10.1093/bioinformatics/bti623. [DOI] [PubMed] [Google Scholar]
- 67.Wang L, Miller JP, Gado MH, McKeel DW, Rothermich M, Miller MI, Morris JC, Csernansky JG. Abnormalities of hippocampal surface structure in very mild dementia of the Alzheimer type. Neuroimage. 2006;30:52–60. doi: 10.1016/j.neuroimage.2005.09.017. [DOI] [PMC free article] [PubMed] [Google Scholar]
- 68.Hanseeuw B, Van Leemput K, Kavec M, Grandin C, Seron X, Ivanoiu A. Mild cognitive impairment: differential atrophy in the hippocampal subfields. AJNR Am J Neuroradiol. 2011;32:1658–1661. doi: 10.3174/ajnr.A2589. [DOI] [PMC free article] [PubMed] [Google Scholar]
- 69.Harding AJ, Halliday GM, Kril JJ. Variation in hippocampal neuron number with age and brain volume. Cereb Cortex. 1998;8:710–718. doi: 10.1093/cercor/8.8.710. [DOI] [PubMed] [Google Scholar]
- 70.Kerchner GA, Hess CP, Hammond-Rosenbluth KE, Xu D, Rabinovici GD, Kelley DA, Vigneron DB, Nelson SJ, Miller BL. Hippocampal CA1 apical neuropil atrophy in mild Alzheimer disease visualized with 7-T MRI. Neurology. 2010;75:1381–1387. doi: 10.1212/WNL.0b013e3181f736a1. [DOI] [PMC free article] [PubMed] [Google Scholar]
- 71.Devanand DP, Pradhaban G, Liu X, Khandji A, De Santi S, Segal S, Rusinek H, Pelton GH, Honig LS, Mayeux R, Stern Y, Tabert MH, de Leon MJ. Hippocampal and entorhinal atrophy in mild cognitive impairment: Prediction of Alzheimer disease. Neurology. 2007;68:828–836. doi: 10.1212/01.wnl.0000256697.20968.d7. [DOI] [PubMed] [Google Scholar]
- 72.Wilcke-Schmidt T, Poljansky S, Hierlmeier S, Hausner J, Ibach B. Memory performance correlates with gray matter density in the ento/-perirhinal cortex and posterior hippocampus in patients with mild cognitive impairment and healthy controls- a voxel based morphometry study. Neuroimage. 2009;47:1914–1920. doi: 10.1016/j.neuroimage.2009.04.092. [DOI] [PubMed] [Google Scholar]
- 73.Holland D, McEvoy L, Dale A the Alzheimer’s Disease Neuroimaging Initiative. Unbiased comparison of sample size estimates from longitudinal structural measures in ADNI. Hum Brain Mapp. 2011 doi: 10.1002/hbm.21386. [Epub ahead of print] [DOI] [PMC free article] [PubMed] [Google Scholar]
- 74.Blaizot X, Mansilla F, Insauti AM, Constans JM, Salinas-Alaman A, Pro-Sistiaga P, Mohedano-Moriano A, Insauti R. The human parahippocampal region: I. Temporal pole cytoarchitectonic and MRI correlation. Cereb Cortex. 2010;20:2198–2212. doi: 10.1093/cercor/bhp289. [DOI] [PMC free article] [PubMed] [Google Scholar]
- 75.Yushkevich PA, Avants BB, Pluta J, Das S, Minkoff D, Mechanic-Hamilton D, Glynn S, Pickup S, Liu W, Gee JC, Grossman M, Detre JA. A high-resolution computational atlas of the human hippocampus from postmortem magnetic resonance imaging at 9.4T. Neuroimage. 2009;44:385–398. doi: 10.1016/j.neuroimage.2008.08.04. [DOI] [PMC free article] [PubMed] [Google Scholar]