

Abstract
Scholars call for greater attention to social contexts that promote and deter risk factors for health. Parenthood transforms social contexts in a myriad of ways that may influence long-term patterns of weight gain. Life course features of parenthood such as age at first birth, parity, and living with a minor child may further influence weight gain. Moreover, the social and biological features of parenthood vary in systematic ways for women and men, raising questions about how social contexts might differentially affect weight patterns by gender. We consider how parenthood influences trajectories of change in body weight over a fifteen year period (from 1986 to 2001) with growth curve analysis of data from the Americans' Changing Lives Survey, conducted with adults aged 24 and older in the contiguous United States (N=3,617). Findings suggest that parents gain weight more rapidly than the childless throughout the study period and that this weight gain occurs for both men and women. Men and women who have their first child earlier or later than about age 27 have accelerated weight gain, living with a minor child is associated with heavier weight for men than women, and parity is associated with greater weight gain for women than men. We conclude that parenthood contributes to a long term, cumulative process of weight gain for American women and men but life course factors that accelerate this process may differ by gender.
Keywords: USA, Life Course, Parenthood, Family, Health Behavior, Body Weight, Embodiment
Ideally, for health and longevity, one would maintain a trim and stable body weight throughout adulthood (Breeze et al., 2006). Unfortunately, most adults in post-industrial nations gain weight fairly rapidly at least through midlife (Adams & Schoenborn, 2006; Rennie & Jebb, 2005). Even modest weight gain is associated with increased morbidity and mortality (Breeze et al., 2006) and incremental weight gain throughout life can add up substantially over time. Scientifically, an important goal is to identify social contexts that are associated with significant weight change over the life course.
Research on health behavior, including behaviors associated with weight gain, has been limited by a focus “on individual health-related behaviors (or ‘life styles’), without due consideration of the social contexts in which health behaviors occur and become socially patterned” (Glass & McAtee, 2006:1651). Social contexts shape health risks by serving to “constrain, limit, reward, and induce the behaviour of individuals” in systematic ways (Glass & McAtee, 2006). Family contexts may be particularly influential in shaping adults' body weight (Sobal et al., 2003). Studies have shown effects of marital status (Sobal et al., 2003; Umberson et al., 2009), pregnancy (e.g., Amorim et al., 2007), and parity (Weng et al., 2004) on weight gain. For example, the transition to parenthood has been shown to foster women's weight gain (Gunderson et al., 2004). However, the longer-term effects of parenthood on body weight are largely unknown; early weight gain may be ephemeral or set a long-term and cumulative trajectory of weight gain into motion. We work from a life course perspective (Elder et al., 2003) to argue that parenthood alters social contexts at the familial level—constraining, limiting, rewarding, and inducing health practices that influence weight change over time.
A life course approach emphasizes that contexts vary systematically across social groups in ways that give rise to different health behavior trajectories. In particular, parenthood imposes a different set of demands and constraints on men and women that may lead to gendered trajectories of weight gain. Given the greater burden of pregnancy and child-rearing for women, one might assume that parenthood affects weight gain only for women. However, past research points to the substantial “civilizing” impact of parenthood on men's risky health habits, such as smoking and drinking, and the effects of parenthood on men's weight patterns are rarely considered. We explore not only how parenthood, per se, influences weight trajectories, but also how other life course features of parenthood (e.g., timing of first birth) influence the degree to which parenthood slows, stabilizes, or accelerates weight change. We consider how parenthood shapes trajectories of change in body weight with a national panel survey of Americans over a fifteen year period, examine gender differences in parenthood and weight trajectories, and test several possible explanations (e.g., exercise, stress) for the effects of parenthood on body weight.
A Gendered Life Course Perspective on Parenthood and Body Weight
A key principle of the life course perspective is that of “linked lives,” the idea that individuals in key relationships influence one another throughout life (Elder et al., 2003). The linked lives of parents and children shape social contexts over the life course in ways that accumulate to influence health outcomes as people age (Milkie et al., 2008). Certainly, the linked lives of parents and children operate differently for men and women throughout life. In addition to the effects of pregnancy and childbearing, women shoulder most of the care for minor children and parenting of minor children results in higher levels of stress and psychological distress for women compared to men (Umberson et al., 2010). In turn, stress and psychological distress are psycho-social mechanisms that may contribute to weight gain (Greeno & Wing, 1994), partly mediating the impact of parenthood on body weight, perhaps especially for women.
Minor children in the household also influence health behaviors associated with weight gain—but in potentially different ways for men and women. Living with minor children decreases the probability of substance abuse (Blackburn et al., 2005), interferes with regular exercise (Bellows-Riecken & Rhodes, 2008; Nomaguchi & Bianchi, 2004), and limits the types of food one prepares (Devine et al., 2000)—all factors associated with weight gain (Liu et al., 1994; Williamson et al., 1991). Explanations for these effects often focus on the “social control” introduced by parenthood—that is, parenthood imposes pressure for routine (e.g., sharing scheduled meals) and introduces new responsibilities (e.g., one must stay sober and healthy to care for children) (Umberson et al., 2010). Given that smoking and heavy drinking are more prevalent among men than women prior to parenthood, parenthood may have stronger effects on these behaviors for men. Moreover, at least one longitudinal study shows that having minor children in the home reduces exercise time for men more than for women (Nomaguchi & Bianchi, 2004.
Parenthood effects filter across life stages (Milkie et al., 2008) so that any early effects on weight gain are likely to be cumulative and persistent, even after children become independent. It is difficult for adults to lose weight or sustain weight loss over time (Jeffery et al., 2000), thus, it is unlikely that such a trajectory would be reversed. In addition to carryover effects, adult children may influence ongoing family contexts in ways that influence parents' weight. Parents tend to remain closely involved and in frequent contact with their adult children (Milkie et al., 2008). Yet women are more likely to maintain ties and have emotionally closer relationships with adult children (Umberson et al., 2010) and recent work shows that family closeness/cohesion may be associated with eating habits (Franko et al., 2008). After children grow up and leave home, the ongoing constraints of parenting are reduced and this may lead to contextual changes that affect weight—for example, by providing the opportunity for more exercise and fewer meals or for a more sedentary routine. In late life, adult children may even monitor and provide groceries for parents.
In sum, contextual features of parenthood may, through a variety of behavioral and psychosocial mechanisms, promote or sustain weight throughout the life course and this may occur in different ways for men and women. We hypothesize that parenthood will contribute to weight gain for men and women but also expect that gender differences in parenting experiences will be reflected in stronger effects on the weight trajectories of women compared to men and that the pathways linking parenthood to weight change (e.g., stress, cohesion, or health behavior as pathways) may differ for men and women. Several concepts that are central to the life course frame may further inform how parenthood influences adults' body weight over time: parenting transitions, the timing of parenthood in the life course, and parity.
Parenting Transitions
Major transitions can trigger turning points in life trajectories (Elder et al., 2003). The transition to parenthood is often associated with women's short-term weight gain; Amorim and colleagues (2007) found that about 50% of women remained above their pre-pregnancy weight (about 1.7 kg.) a year following childbirth (Amorim et al., 2007). Some scholars argue that these effects go beyond physical effects of pregnancy and reflect social conditions of parenthood for women (Devine, et al. 2000; Gunderson & Abrams, 1999). While the transition into parenthood has received significant attention, parental transitions that occur long after a child is born have not been studied in relation to body weight. Common transitions of mid to later life parenthood include the transition to empty nest and the return of adult children to the parental home. We hypothesize that these transitions will alter the weight trajectories of men and women.
Timing of Parenthood
The timing of parenthood, reflected in age at first birth (AFB), may also influence the degree to which parenthood affects weight trajectories. Very young AFB is associated with truncated educational and economic opportunities, factors associated with increased risk for overweight and obesity (Ball & Crawford, 2005). Late AFB may also contribute to weight gain. Women are more likely to gain weight toward mid-life (Adams & Schoenborn, 2006) and pregnancy during this time may accelerate weight gain. In fact, previous research shows that early (before age 18) and late (beyond age 40) AFB are associated with weight gain for women (Gunderson & Abrams, 1999). Later AFB may affect weight gain, in part, because biological aspects of aging dovetail with social contexts to shape the effects of parenthood on body weight. For example, average age at first birth may promote only modest weight gain while older age at first birth may exacerbate the accelerated weight gain that typically occurs toward mid-life. Given that men, on average, are as likely as women to gain weight in mid-life (Adams & Schoenborn, 2006), we hypothesize that later AFB will also affect weight gain for men.
Parity
Life course experiences are also marked by the number of children one has. Weng and colleagues (2004) report that obesity risk increases by about seven percent with each additional biological child for women and about four percent for men (Devine et al., 2000; Greeno & Wing, 1994). Longitudinal research on women suggests that higher parity contributes to weight gain in mid to late life (Lahmann et al., 2000). However, past studies have not considered long-term trajectories of weight change for men and women, taking into account starting points on weight and the rate of weight gain over time. We hypothesize that parity will be positively associated with accelerated weight gain for women and men because additional children impose more constraints and responsibilities that influence weight change.
Study Goals and Approach
This study extends our understanding of family contexts and body weight by evaluating the effects of parenthood on the long-term weight trajectories for both men and women. We analyze a national panel study and use growth curve analysis (Singer & Willett, 2003) to take into account that parents and nonparents may have a different mean baseline level and rate of change in body weight over time. Recognizing that adults typically experience an upward weight trajectory with age (Adams & Schoenborn, 2006), we ask whether parenthood makes this weight trajectory steeper, whether parity or timing of first birth regulate the steepness of the weight trajectory, whether specific parenthood contexts (e.g., children in home versus not) or transitions (e.g., to empty nest) account for shifts in trajectories, and whether these patterns differ for men and women. We also consider whether the effects of parenthood on body weight, and any gender differences in these effects, are explained by psychosocial and behavioral variables such as stress, psychological distress, smoking, and alcohol consumption.
Method
Data
We analyze four waves of the Americans' Changing Lives (ACL) national panel survey conducted in the United States. The original sample (age 24–96 in 1986) was obtained using multistage stratified area probability sampling with an oversample of African Americans, persons over age 59, and married women with husbands over age 64. Face to face interviews lasting approximately 90 minutes were conducted in 1986 (Time 1 (T1) N=3,617), 1989 (Time 2 (T2) N =2,867) and 1994 (Time 3 (T3) N=2,398), with a phone interview in 2001 (Time 4 (T4) N=1,787). Institutional Review Board approval for secondary analysis of the ACL data was provided by the University of Texas, Austin. The ACL data were originally collected by the Institute for Social Research and are now publicly available through the Interuniversity Consortium for Political and Social Research at the University of Michigan. All information for measures at T1 and T2 is based on self-reports. 164 interviews at T3 and 95 interviews at T4 were completed by proxy with proxies more likely for older respondents. Our analytic sample is comprised of the entire sample of 3,617 respondents. We use the Full Information Maximum Likelihood (FIML) missing-data-handling feature of Mplus to handle missing values due to sample attrition for T2-T4 and include three dummy variables indicating missing cases (1=missing) at T2, T3, and T4. FIML maximizes a case-wise likelihood function by using only those variables that are observed for a particular case with the assumption of missing at random (MAR) (Muthén & Muthén, 2007). However, respondents who are older, unmarried, less educated, or with lower family income are more likely to exit the survey. Survey attrition may also vary across parental status groups with certain groups more likely to drop out of the study (childless were 3% more likely to exit). Moreover, overweight and obesity are associated with increased risk for infertility and pregnancy complications (Wane et al., 2010); these patterns suggest that the most overweight respondents would be less likely to transition to parenthood. The most likely result for the present study would be underestimation of parenthood effects on weight gain.
Measures
Dependent variable
Our dependent variable is measured with the body mass index (BMI). This index is calculated as weight (in kilograms) divided by height squared (in meters). Weight is based on self reports (which have demonstrated validity in national surveys, Gorber et al., 2007). Missing data on weight or height in subsamples (T1 to T4=79, 55, 44, 46) are imputed with gender-specific median values. We examine the BMI as a continuous variable in growth curve analyses because we are focusing on trajectories and degrees of change in body weight over time. One BMI unit translates to about 3.08 kilograms for a man of average height and about 3.13 kilograms for a woman of average height. Change in adult BMI over time is primarily due to change in weight rather than change in height and for ease of discussion we refer to the dependent variable as “body weight” and “weight.”
Parenthood variables
Parenthood is coded one for parents (biological and nonbiological children) and zero for childless individuals. We assess parental status based on age and living arrangements of children at T1: minor child (18 or younger) living with respondent, minor child living elsewhere, adult child (older than 18) living with respondent, and adult child living elsewhere (for all variables, 1=yes, 0=otherwise). Each parental status comprises one single predictor (although all statuses are considered together in a single model to measure parental status). The four variables can be interpreted as separate dummy variables. For example, the regression coefficient for “minor child at home” indicates the difference between those who have a minor child at home and all others, holding constant other parental status variables and covariates. This takes into account that respondents may qualify for more than one “status” (e.g., one may have a minor child at home and an adult child away). Parity is measured as number of children at T1. Age at first birth (AFB) indicates the age at which respondents had their first child and is calculated based on respondents' age and their oldest child's age at T1. We use the internal moderator approach to study the effect of AFB on weight (see Mirowsky, 1999). We also include a squared term for AFB to assess possible nonlinear effects.
Parental transitions
Three parental status transitions between surveys are analyzed as time-varying covariates: (1) transition to parenthood (1=experienced the birth or adoption of a child, 0=otherwise), (2) transition to empty nest (1=transition from having any minor child at home to all adult children living elsewhere, 0=otherwise), and (3) return of an adult child to the parental home (1=transition from having an adult child living elsewhere and no adult child living at home to having an adult child living at home, 0=otherwise). Although we use the entire sample of 3,617 respondents at T1 to estimate the effects of parenthood, parental status, parity, and age at first birth, we rely on different subsamples to analyze parental transitions to ensure the most appropriate comparison group for each transition (i.e., each transition group is compared to the group they transition from). The transition to parenthood subsample includes those who were childless at T1 (n=591) (i.e., those who transition to having a child are compared to those who have no children). The transition to empty nest subsample includes those who had a child living at home at T1 (n=1523). The subsample for transition to having an adult child return home includes those who had an adult child living elsewhere at T1 (and no children at home) (n=1375).
Explanatory variables
We assess several variables as possible mediators between parenthood and body weight. T1 explanatory variables are used to predict T1 weight and T1 to T2 change in explanatory variables are used to predict rate of weight change over the entire T1 to T4 period. T1 smoking is a dichotomous variable indicating current smoking status (1=yes, 0=otherwise). Change in smoking includes: remained non-smoker (reference group), remained smoker, stopped smoking, and started smoking. T1 vigorous exercise indicates whether one regularly engages in active exercise (1=often, 0=otherwise). Change in exercise includes: continued no exercise (reference group), continued exercise, stopped exercising, and started exercising. Financial strain reflects two items: difficulty meeting monthly payments on bills and satisfaction with present financial situation (higher score indicates greater strain). Psychological distress is measured with an 11-item version of the Center for Epidemiological Studies-Depression (CES-D) Scale (higher scores indicate more distress). Cohesion is assessed with two questions that indicate how much children make respondents feel loved and cared for and how often children are willing to listen when parents need to talk about worries/problems. Parental stress is based on three questions that tap into satisfaction with being a parent, frequency of feeling bothered or upset as a parent, and feelings of happiness with how children have turned out. Because parental stress applies to respondents who are parents and cohesion applies to respondents who have a child 16+, we apply the internal moderator approach to handle cases where measures are not applicable (Mirowsky, 1999). Financial strain, psychological distress, cohesion, and parental stress are measured as continuous indices and T1–T2 change reflects differences in absolute values.
Gender and other socio-demographic variables
We assess possible interactions of the parenthood variables with respondents' gender (1=male, 0=female) in predicting weight change. Respondents' age is centered at 54 and scaled in ten-year units. We also include a squared term for age to identify nonlinear patterns and control for race (1=Non-Hispanic White, 0=others), education (years, T1), family income ($1,000s, T1), and marital status (time-varying). Family income and education are centered at their mean ($23,000 for income and 11.5 for education). Marital status includes: continuously married between surveys with no transition, transition from married to single between surveys, transition from single to married between surveys, and continuously single between surveys with no transition (reference group=continuously married).
Analytical Approach
We use linear growth curve models to estimate weight trajectories across four waves of data. Models account for systematic variation in growth parameters (i.e., latent intercept and slope) attributable to parenthood and other covariates, as well as heterogeneity in weight trajectories across individuals. A major advantage of growth curve modeling in comparison to traditional regression modeling is its ability to distinguish the two levels (i.e., within- and between-individual) of heterogeneity in estimating weight trajectories shaped by parenthood status and transitions. The structural parameters from this part of the model provide the basis for assessing effects of key variables on initial level and change in body weight. Parental status transitions between waves are modeled as time-varying covariates. The linear growth curve model can be specified as:
where Yij represents the outcome variable, (i.e., body weight of individual i at Time j), where j = 1,2, 3 or 4 index ACL T1–4 respectively. Tij is the time variable (coded 0, 3, 8, 15) and εij is the level 1 residual1. Pkij denotes parental transitions occurring between waves, with k = 1, 2 or 3 indexing transitions between T1–T2, T2–T3, and T3–T4, respectively. Mlij denotes marital transitions occurring between waves, with l = 1, 2 or 3 indexing transitions between T1– T2, T2– T3, and T3–T4, respectively. π0i and π1i are the ith individual's latent intercept and slope. πkj and γlj are the effects of parental transition k and marital transition l respectively at Time j, which, unlike the intercept and slope, do not vary over individuals. X0i′ and X1i′ are vectors of explanatory variables for the ith individual. For the analysis of parenthood effects, Pkij = 0 and we include variables for parental status at T1 in X0i′ and X1i′. A0 and A1 are population-average (i.e., fixed) effects of X0i′ and X1i′. ζ0i and ζ1i are individual-specific (level 2) residuals. The linear mixed effects model is estimated as a latent growth curve model using MPlus software (Muthén & Muthén, 2007).
Results
Descriptive information is presented in Table 1. At T1, respondents had an average of 2.6 children and 16 percent of the sample was childless. Thirty-one percent of the sample had a minor child at home, 7% had a minor child living in a separate residence, 15% had a child over age 18 living at home, and 55% had an adult child living independently. Descriptive information regarding other variables is also presented in Table 1.
Table 1. Descriptive Statistics.
| Mean | SD | N | |
|---|---|---|---|
| Body Mass Index (BMI) | |||
| T1 BMI | 26.02 | 5.10 | 3617 |
| T2 BMI | 26.30 | 5.22 | 2867 |
| T3 BMI | 26.70 | 5.36 | 2562 |
| T4 BMI | 27.51 | 5.68 | 1787 |
| Parental Status (T1) | |||
| Parent | 0.84 | 0.37 | 3617 |
| Parity | 2.60 | 2.08 | 3617 |
| Had biological child | 0.83 | 0.38 | 3617 |
| Age at first birth | 23.84 | 5.79 | 2979 |
| Minor child home | 0.31 | 0.46 | 3617 |
| Minor child away | 0.07 | 0.25 | 3617 |
| Adult child home | 0.15 | 0.36 | 3617 |
| Adult child away | 0.55 | 0.50 | 3617 |
| Transitions | |||
| T1-T2 Parenthood | 0.06 | 0.23 | 2867 |
| T1-T2 Empty nest | 0.01 | 0.12 | 2867 |
| T1-T2 Adult child returns | 0.05 | 0.21 | 2867 |
| T2-T3 Parenthood | 0.06 | 0.24 | 2562 |
| T2-T3 Empty nest | 0.03 | 0.16 | 2562 |
| T2-T3 Adult child returns | 0.04 | 0.21 | 2562 |
| T3-T4 Parenthood | 0.03 | 0.18 | 1787 |
| T3-T4 Empty nest | 0.06 | 0.24 | 1787 |
| T3-T4 Adult child returns | 0.05 | 0.22 | 1787 |
| Explanatory Mechanisms T1 | |||
| Smoker | 0.29 | 0.46 | 3617 |
| Vigorous exercise | 0.28 | 0.45 | 3617 |
| Financial strain | 0.05 | 1.07 | 3617 |
| CESD | 0.11 | 1.06 | 3617 |
| Cohesion | 0.00 | 0.80 | 3611 |
| Parental stress | 0.00 | 0.91 | 3614 |
| Explanatory Mechanisms T1-T2 | |||
| Remained smoker | 0.22 | 0.42 | 2867 |
| Stopped smoking | 0.06 | 0.23 | 2867 |
| Started smoking | 0.02 | 0.15 | 2867 |
| Remained nonsmoker | 0.70 | 0.46 | 2867 |
| Continued exercise | 0.13 | 0.34 | 2867 |
| Stopped exercise | 0.16 | 0.36 | 2867 |
| Started exercise | 0.09 | 0.28 | 2867 |
| Continued no exercise | 0.62 | 0.49 | 2867 |
| Financial strain change | -0.10 | 0.95 | 2867 |
| CESD change | -0.05 | 1.01 | 2867 |
| Cohesion change | -0.00 | 0.73 | 3132 |
| Parental stress change | -0.01 | 0.81 | 2968 |
| Control Variables (T1) | |||
| Age | 53.64 | 17.62 | 3617 |
| Gender (1=male) | 0.38 | 0.48 | 3617 |
| Race (1=white) | 0.64 | 0.48 | 3617 |
| Education | 11.47 | 3.47 | 3617 |
| Income (in $1,000s) | 23.35 | 21.98 | 3617 |
| Time-Varying Marital Transitions | |||
| T1 to T2 | |||
| Remained married | 0.52 | 0.50 | 2867 |
| Married to single | 0.05 | 0.22 | 2867 |
| Single to married | 0.03 | 0.18 | 2867 |
| Remained single | 0.40 | 0.49 | 2867 |
| T2 to T3 | |||
| Remained married | 0.51 | 0.50 | 2348 |
| Married to single | 0.07 | 0.26 | 2348 |
| Single to married | 0.04 | 0.20 | 2348 |
| Remained single | 0.38 | 0.49 | 2348 |
| T3 to T4 | |||
| Remained married | 0.51 | 0.50 | 1694 |
| Married to single | 0.11 | 0.31 | 1694 |
| Single to married | 0.04 | 0.19 | 1694 |
| Remained single | 0.34 | 0.48 | 1694 |
| Sample Attrition Indicator (not interviewed) | |||
| T2 | 0.21 | 0.41 | 3617 |
| T3 | 0.29 | 0.45 | 3617 |
| T4 | 0.51 | 0.50 | 3617 |
Results from unconditional growth curve models with no covariates (not shown, available upon request) indicate that, on average, body weight increases over time (b=0.061; p < .001) for the 3,617 individuals included in the analyses. We also find evidence of significant variation in the random intercept (var(π0i)=24.577, p < .001) and slope (var(π1i)=0.067, p < .001) from the unconditional model with no covariates, suggesting significant between-individual differences in growth trajectories of body weight.
Parenthood
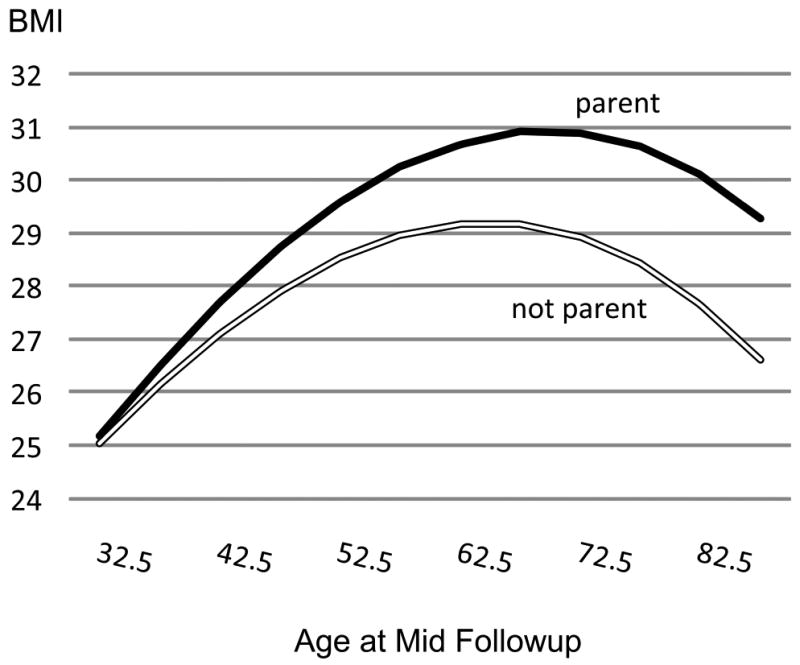
We begin by considering the general question of how parenthood affects weight patterns over time. Table 2 compares parents to childless individuals; these results indicate that, net of controls, parents and nonparents began the study period with similar weight levels (latent intercept, indicating baseline body weight) but that, compared to the childless, parents experienced more rapid weight gain (latent slope, indicating the rate of change in body weight over time) over the fifteen year study period (b=0.046, p < 0.01). We graphically present the predicted weight trajectories across age for parents and non-parents (assuming mean values on demographic variables at different ages) in Figure 1 based on results in Table 2. Figure 1 shows that, throughout adulthood, the differential weight gain of parents and nonparents resulted in about two points on the BMI scale. This translates to about 5.44 kilograms for a female (average height 1.626 meters) and 6.25 kilograms for a male (average height 1.778 meters). Integrating the age-specific slopes for the youngest cohort in the sample suggests that the average BMI of parents will be over 30 by the time they are age 55 and peak at an average of 31 by the mid to late 60s. The integral for nonparents suggests that they will average BMIs in the overweight zone (25-–29) but not in the obese zone (over 30). None of the tests for two-way interactions of parenthood with gender were statistically significant (not shown, available upon request), suggesting that the effect of parenthood on weight gain is similar for men and women. Covariates were associated with body weight trajectories in expected ways. Transitions out of marriage were associated with weight loss, whites respondents weighed less than others at T1, and income and education were inversely associated with T1 body weight. Higher education was associated with more rapid weight gain over time (related to a significantly lower starting point on weight).
Table 2. Estimated Effects of Parenthood on Body Weight (in BMI units)Trajectories from Growth Curve Models (N=3617).
| Intercept | Slope | ||
|---|---|---|---|
| Parent (1=yes) | 0.14 | 0.046** | |
| Control Variables (T1) | |||
| Age | 0.083 | -0.088*** | |
| Age² | -0.324*** | -0.006* | |
| Gender (1=male) | 0.21 | -0.015 | |
| Race (1=white) | -1.384*** | -0.008 | |
| Education | -0.151*** | 0.005** | |
| Income ($1,000s) | -0.102* | -0.004 | |
| T2 Not interviewed | -0.134 | 0.003 | |
| T3 Not interviewed | -1.040*** | -0.015 | |
| T4 Not interviewed | -0.156 | -0.031* | |
| Constant | 28.224*** | 0.023 | |
| Variance | 22.469*** | 0.046*** | |
| Time-Varying Marital Transitions | T2 BMI | T3 BMI | T4 BMI |
| T1 Married-T2 single | -0.501** | ||
| T1 Single-T2 married | 0.202 | ||
| T1-T2 Remained single | 0.06 | ||
| T2 Married-T3 single | -0.377* | ||
| T2 Single-T3 married | -0.07 | ||
| T2-T3 Remained single | -0.023 | ||
| T3 Married-T4 single | -0.723** | ||
| T3 Single-T4 married | 0.026 | ||
| T3-T4 Remained single | -0.048 | ||
| CFI/TLI | 1.000/1.010 | ||
| Test Model Fit chi2/df | 0.000/52 | ||
Age, education, and income are centered at their means.
Two-tailed tests:
p<.05.
p<.01.
p<.001.
Fig. 1. Predicted BMI trajectory for parents and nonparents.
Parenting Transitions
The results described thus far suggest that parenthood, per se, has gradual and long-term effects on weight trajectories but it may be key parenting transitions that initiate change in social contexts that launch change in weight trajectories. We considered transitions to parenthood, empty nest, and return of adult child as time-varying covariates. Results in Table 3 show no significant main effects of any of the parenting transitions on weight change between time points, net of controls. We also assessed possible interactions of parenting transitions with gender (not shown, available upon request). Only four of 54 interaction terms attained statistical significance and yielded no consistent pattern of results.
Table 3. Estimated Effects of Parental Transitions on Body Weight (in BMI units)Trajectories from Growth Curve Models (N=3617).
| Model 1 | Model 2 | Model 3 | |||||||
|---|---|---|---|---|---|---|---|---|---|
| T2 BMI | T3 BMI | T4 BMI | T2 BMI | T3 BMI | T4 BMI | T2 BMI | T3 BMI | T4 BMI | |
| (T1 Childless, n = 591) | (T1 Minor Child at Home, n = 1523) | (T1 Adult Children Away, n = 1375) | |||||||
| Transition to Parenthood | Empty Nest | Adult Child Returns | |||||||
| Time Varying Parental Transitions | |||||||||
| T1-T2 Parenthood | 0.117 | -0.447 | -0.180 | ||||||
| T2-T3 Parenthood | 0.605 | 0.778 | |||||||
| T3-T4 Parenthood | 0.257 | ||||||||
| T1-T2 Empty nest | 0.471 | 0.047 | -0.597 | ||||||
| T2-T3 Empty nest | 0.108 | 0.168 | |||||||
| T3-T4 Empty nest | 0.084 | ||||||||
| T1-T2 Child returns | 0.193 | 0.395 | 0.932 | ||||||
| T2-T3 Child returns | 0.299 | 0.559 | 0.496 | 0.503 | |||||
| T3-T4 Child returns | 0.329 | 0.383 | |||||||
| Intercept | Slope | Intercept | Slope | Intercept | Slope | ||||
| Constant | 27.686*** | 0.019 | 28.701*** | 0.084*** | 28.422*** | 0.029 | |||
| Variance | 18.129*** | 0.046*** | 24.262*** | 0.047*** | 22.127*** | 0.042*** | |||
| CFI/TLI | 1.000/1.082 | 1.000/1.027 | 1.000/1.028 | ||||||
| Test Model Fit chi2/df | 0.000/56 | 0.000/61 | 0.000/56 | ||||||
All models control for T1 age, age², gender, race, education, income, missing data indicators for those not interviewed at T2-T4, time-varying marital transitions.
Two-tailed tests:
p<.05.
p<.01.
p<.001.
The most important information in Table 3 concerns the “constant” and “variance” rows, suggesting major differences in body weight trajectories across parental status groups, net of covariates. The average slope for weight (constant term for slope) was significantly higher for persons who began the study with a child in the home (Model 2), compared to the childless or those with an empty nest. Those with a child at home were the only group predicted to still have significantly positive slopes at age 54 (indicated by the significant positive constant term for slope in Model 2). These findings lead to the next part of our analysis in which we consider how T1 parental status shapes weight trajectories.
Other Life Course Features of Parenthood
Although key parenting transitions did not have measurable effects on weight trajectories, Table 2 showed that parenthood is associated with trajectories of long-term weight gain. We now consider whether the effects of parenthood on body weight depend on the age at which one becomes a parent, the number of children one has, or T1 age and living arrangements of one's children. Model 1 of Table 4 presents the main effects of parental status on body weight. We also assessed the possibility that these effects vary by gender in Model 2 of Table 4.
Table 4. Estimated Main and Gender Interaction Effects of Parental Status on Body Weight (in BMI units) Trajectories from Growth Curve Model (N=3617).
| Model 1 | Model 2 | |||||
|---|---|---|---|---|---|---|
| Main Effects | Gender Interaction Effects | |||||
| Intercept | Slope | Intercept | Slope | |||
| T1 Parental Status | ||||||
| Age at first birth | -0.147 | -0.013 | -0.126 | -0.004 | ||
| Age at first birth2 | 0.117 | 0.023* | 0.230 | 0.017 | ||
| Parity | 0.163** | -0.003 | 0.315*** | -0.005 | ||
| Minor child home | 0.006 | 0.030 | -0.673 | 0.041 | ||
| Minor child away | -0.623 | 0.037 | -0.804 | 0.057 | ||
| Adult child home | 0.790*** | 0.001 | 0.757** | -0.012 | ||
| Adult child away | -0.168 | 0.046* | -0.449 | 0.046* | ||
| Gender Interactions (1=male) | ||||||
| X Age at first birth | 0.082 | -0.032 | ||||
| X Age at first birth2 | -0.284 | 0.021 | ||||
| X Parity | -0.470*** | 0.005 | ||||
| X Minor child home | 1.900*** | -0.037 | ||||
| X Minor child away | 0.626 | -0.043 | ||||
| X Adult child home | 0.041 | 0.049 | ||||
| X Adult child away | 0.971* | -0.008 | ||||
| Constant | 27.973*** | 0.022 | 27.905*** | 0.023 | ||
| Varianced | 22.270*** | 0.046*** | 22.045*** | 0.046*** | ||
| Time-Varying Marital Transitions | T2 | T3 | T4 | T2 | T3 | T4 |
| T1-T2 Married to single | -0.508** | -0.507** | ||||
| T1-T2 Single to married | 0.205 | 0.208 | ||||
| T1-T2 Remained single | 0.050 | 0.054 | ||||
| T2-T3 Married to single | -0.405* | -0.391* | ||||
| T2-T3 Single to married | -0.084 | -0.087 | ||||
| T2-T3 Remained single | -0.050 | -0.036 | ||||
| T3-T4 Married to single | -0.726*** | -0.720** | ||||
| T3-T4 Single to married | -0.030 | -0.001 | ||||
| T3-T4 Remained single | -0.098 | -0.075 | ||||
| CFI/TLI | 1.000/1.013 | 1.000/1.016 | ||||
| Test Model Fit chi2/df | 0.000/66 | 0.000/80 | ||||
All models control for T1 age, age2, gender, race, education, income, having any biological child, and missing data indicators for those not interviewed T2-T4.
Two-tailed tests:
p<.05.
p<.015.
p<.001.
We begin with timing of parenthood in the life course. We found a significant parabolic effect of age at first birth (AFB) on the slope for weight (b=0.023, p < 0.05, Model 1, slope), with the flattest BMI trajectories for parents with first births around age 26.8 (calculated: [-(- .013) /(2*.023)]X10+24, AFB centered at 24, 10 year units). First births earlier or later than 26.8 were associated with increasingly steep BMI trajectories. Table 4 also shows that parity is positively associated with T1 body weight (b=0.163, p < 0.01, intercept, Model 1) and a significant interaction of parity with gender (b= -0.470, p < 0.001, intercept, Model 2) indicates that this effect occurred for women but not men. However, parity does not significantly affect the rate of weight change over time (slope, Model 1, Table 4).
Next, we discuss the estimated effects of age/living arrangements of children. Model 1 of Table 4 shows that, holding constant other living arrangement variables and covariates, living with an adult child at T1 was associated with heavier baseline body weight (b=0.790, p < 0.001, intercept, Model 1) but not with the rate of weight change over time (slope). The effect of living with an adult child did not depend on gender (indicated by the absence of significant interaction effects, Model 2). Model 2 indicates that living with a minor child was associated with significantly higher T1 body weight for men but not for women (significant gender interaction of b=1.900, p < 0.001 and non-significant main effect, Model 2). Living separately from an adult child was not significantly associated with T1 weight for women but is related to higher T1 body weight for men (significant gender interaction of b= 0.971, p < 0.05 and non-significant main effect, Model 2). Living separately from an adult child was also associated with more rapid weight gain over time (b = 0.046, p < 0.05, slope, Model 1).
How Does Parenthood Affect Body Weight?
We considered several possible explanations (mediators) for the link between parent status measures and body weight: cohesion, financial stress, parental stress, psychological distress, smoking, heavy drinking, and vigorous exercise. In order for a variable to qualify as a mediating variable in the relationship between parenthood measures and body weight, the parenthood variable must have a significant effect on the mediator, and the mediator must be associated with weight, controlling for the parenthood measure. We found that parenthood, compared to childlessness, was not significantly associated with any of the possible mediating variables, however, each of the other parental measures was associated with at least one of the possible mediators. For example, some of the effects of parental variables on mediators (not shown, available upon request) included an association of greater parity with increased probability of smoking, higher levels of financial strain, and lower probability of vigorous exercise for those living with a minor child at T1. We used the explanatory variables (measured at T1) to predict the intercept for weight trajectories and considered T1 to T2 change in the explanatory variables to predict the slope of weight trajectories from T1 to T4. Results (not shown, available upon request) show that the effects of parity and age/living arrangements of children, as well gender interactions, remained statistically significant and were reduced in magnitude only modestly, if at all, by taking the explanatory variables into account.
Discussion
People in industrialized nations tend to gain weight, at least through late midlife (Adams and Schoenborn 2006), and our results suggest that parenthood may steepen these weight trajectories and raise their peak. Although the difference in annual rates of gain between U.S. parents and nonparents may not be noticeable in the short-run, these differences appear to become substantial over the course of adulthood, for both women and men.
Given the power of social contexts to influence health throughout adulthood (Glass & McAtee, 2006; House et al., 1994), we expected that the social contexts of parenthood would affect both men and women, albeit though different mechanisms. Our results suggest that parenthood (compared to childlessness), age at first birth, and living with an adult child have similar effects on men and women. Parents gain weight at a more rapid rate than nonparents and, among parents, younger and older age at first birth are associated with increasingly accelerated weight gain (with the most stable weight trajectories occurring for first birth at around age 27), and living with an adult child is associated with higher baseline body weight. In contrast, parity is positively associated with baseline body weight, with greater effects on women than men, perhaps reflecting biological as well as social consequences of multiparous parenthood for women's weight gain (Weng et al., 2004). Yet living with minor children and having independent adult children is associated with heavier baseline weight only for men. These findings demonstrate the potential power of parental contexts to have biological consequences (reflected in body weight) for men as well as for women. Taken together, the findings from this study support the concept of “embodiment,” defined as “the sculpting of internal biological systems that occurs as a result of prolonged exposure to particular environments” (Glass & McAtee, 2006: 1655). Our results suggest that it is not the transition into a particular parental status that suddenly reshapes weight trajectories, rather, parenthood seems to shape a long-term, gradual, and cumulative pattern of weight gain and in somewhat different ways for men and women. Moreover, findings suggest greater weight stability for childless men and women. Weight stability is better for health than is fluctuating or increasing weight (Adams & Schoenborn, 2006), thus, our findings correspond to recent research showing that childlessness seems to have few costs for long-term health and may even have some benefits (Umberson et al., 2010).
Degree of exposure to particular social contexts increases the cumulative effect of those contexts (Glass & McAtee, 2006; House et al., 1994). Certainly, “exposure” associated with parenthood is substantial in societies where parents and children typically live together until children are young adults and often much longer. Moreover, parents and adult children tend to remain closely involved with one another throughout life, even after children become independent adults. Recent work demonstrates that obesity risk “spreads” across social networks regardless of geographic proximity and social distance (i.e., closer network relatedness) trumps geographic distance in promoting the spread of obesity across networks (Christakis & Fowler, 2007). Parenthood introduces social constraints and demands that are long-term, difficult to avoid, and have lasting, as well as cumulative, effects on parents' weight. Additionally, given the intergenerational transmission of overweight and obesity (Jacobson et al., 2007), family contexts that contribute to parents' weight gain may also foster long-term weight gain in their children.
Family scholars suggest several reasons that parenthood would affect weight trajectories. We analyzed some of these possibilities including smoking, physical activity levels, financial stress, and psychological distress, but these explanatory mechanisms did not explain the effects of parenthood on weight gain. Future research should consider potential mediators that are tied to parenthood, having minor children in the home, parity, and early or late first birth. This work should investigate the interplay of social, psychological, behavioral, and biological processes underlying patterns of weight gain associated with family contexts and how they differ for men and women. This research is needed in order to better understand how family contexts promote weight gain across social groups.
Growth curve analysis and longitudinal data offered a unique opportunity to consider how parenthood modifies weight trajectories over time but this approach is limited in potentially important ways. The ACL survey was conducted in the U.S. between 1986 and 2001 and results might differ in other countries and time periods. Although obesity rates are increasing across industrialized nations (World Health Organization, 2006), the U.S. may be characterized by unique geographic or cultural features that promote greater weight gain (Oliver, 2006). While longitudinal data and growth curve techniques provide indirect evidence for causal interpretations, we cannot rule out the possibility that body weight influences parental status and parental transitions. The absence of parental transition effects may also reflect the small numbers in our sample who experienced transitions between data collections or that the amount of time following transitions is too crude to detect changes triggered by transitions. Although we included a broad age range in our sample to better understand the effects of parenthood on weight over the life course, the ACL age distribution (24–96) may not be adequate to analyze certain transitions (e.g., birth of first child). Studies that more precisely measure the timing of parenting transitions and include more frequent data points can advance understanding of how parenthood contributes to weight change. In addition, the ACL data do not allow us to address the ways in which age, period, and cohort effects may work together to influence results. We used a synthetic cohort approach (Mirowsky & Kim, 2007) to begin to consider how weight trajectories change over time for individuals of various ages but this approach is limited by an assumption of similar parenthood/weight patterns across birth cohorts. We explored possible interactions of age with parenthood (not shown, available upon request) but these results revealed only one significant age interaction. Specifically, those living separately from an adult child would have faster weight gain up to about age 54, but less rapid weight gain (or even more rapid weight loss) at older ages. However, this apparent age effect could be due to some combination of age, period, or cohort effects (for example, younger generations may have more body weight at younger ages). Although teasing out age, period and cohort effects is beyond the scope of our study, this is an important issue for future studies to address.
In sum, parenthood appears to steepen trajectories of weight gain for both men and women, particularly for those who become parents relatively early or late in the life course. Certain aspects of parenthood seem to have greater implications for women's weight patterns and others for men's and this may result from differences in the impact of parenthood on the social contexts of men and women. Long term, cumulative aspects of parenthood appear to be an operative factor in fostering and sustaining weight gain over time, although the precise mechanisms through which this occurs remain uncertain. These findings add to a growing body of evidence that family contexts influence body weight. Our results suggest that social conditions associated with parenthood may contribute to long-term risk for weight gain. Given that even small changes in weight are associated with increased risk for morbidity and mortality (Breeze et al., 2006), and the intergenerational transmission of overweight and obesity (Jacobson et al., 2007), social scientists should further explore how family contexts influence weight change of all family members throughout the life course.
Acknowledgments
This research was supported by grant RO1AGO26613 from the National Institute on Aging, National Institutes of Health, USA.
Contributor Information
Debra Umberson, Department of Sociology, University of Texas at Austin.
Hui Liu, Department of Sociology, Michigan State University.
John Mirowsky, Department of Sociology, University of Texas at Austin.
Corinne Reczek, Department of Sociology, University of Cincinnati.
References
- Adams PF, Schoenborn CA. National Center for Health Statistics. Vital Health Statistics; 2006. Health behaviors of adults: United States, 2002–04; p. 10. [PubMed] [Google Scholar]
- Amorim A, Rossner S, Neovius M, Lourenco PM, Linne Y. Does excess pregnancy weight gain constitute a major risk for increasing long-term BMI? Obesity. 2007;15:1278–1286. doi: 10.1038/oby.2007.149. [DOI] [PubMed] [Google Scholar]
- Ball K, Crawford D. Socioeconomic status and weight change in adults: a review. Social Science & Medicine. 2005;60:1987–2010. doi: 10.1016/j.socscimed.2004.08.056. [DOI] [PubMed] [Google Scholar]
- Bellows-Riecken KH, Rhodes RE. A birth of inactivity? A review of physical activity and parenthood. Preventive Medicine. 2008;46:99–110. doi: 10.1016/j.ypmed.2007.08.003. [DOI] [PubMed] [Google Scholar]
- Blackburn C, Bonas S, Spence N, Dolan A, Coe C, Moy R. Smoking behavior change among fathers of new infants. Social Science & Medicine. 2005;61:517–526. doi: 10.1016/j.socscimed.2004.12.009. [DOI] [PubMed] [Google Scholar]
- Breeze E, Clarke R, Shipley MJ, Marmot MG, Fletcher AE. Cause-specific mortality in old age in relation to body mass index in middle age and in old age: Follow-up of the Whitehall Cohort of male civil servants. International Journal of Epidemiology. 2006;35:169–175. doi: 10.1093/ije/dyi212. [DOI] [PubMed] [Google Scholar]
- Christakis NA, Fowler JH. The spread of obesity in a large social network over 32 years. The New England Journal of Medicine. 2007;357:370–379. doi: 10.1056/NEJMsa066082. [DOI] [PubMed] [Google Scholar]
- Devine CM, Bove CF, Olson CM. Continuity and change in women's weight orientations and lifestyle practices through pregnancy and the postpartum period: the influence of life course trajectories and transitional events. Social Science & Medicine. 2000;50:567–582. doi: 10.1016/s0277-9536(99)00314-7. [DOI] [PubMed] [Google Scholar]
- Elder G, Johnson M, Crosnoe R. The emergence and development of life course theory. In: Mortimer J, Shanahan M, editors. Handbook of the life course. New York: Plenum; 2003. pp. 369–388. [Google Scholar]
- Franko DL, Thompson D, Bauserman R, Affenito SG, Striegel-Moore RH. What's love got to do with it? Family cohesion and healthy eating behaviors in adolescent girls. International Journal of Eating Disorders. 2007;41:360–367. doi: 10.1002/eat.20517. [DOI] [PMC free article] [PubMed] [Google Scholar]
- Glass TA, McAtee MJ. Behavioral science at the crossroads in public health: Extending horizons, envisioning the future. Social Science & Medicine. 2006;62:1650–1671. doi: 10.1016/j.socscimed.2005.08.044. [DOI] [PubMed] [Google Scholar]
- Greeno CG, Wing RR. Stress-induced eating. Psychological Bulletin. 1994;115:444–464. doi: 10.1037/0033-2909.115.3.444. [DOI] [PubMed] [Google Scholar]
- Gorber SC, Tremblay M, Moher D, Gorber B. A comparison of direct vs. self report measures for assessing height, weight and body mass index: a systematic review. Obesity Reviews. 2007;8:307–326. doi: 10.1111/j.1467-789X.2007.00347.x. [DOI] [PubMed] [Google Scholar]
- Gunderson EP, Abrams B. Epidemiology of gestational weight gain and body weight changes after pregnancy. Epidemiologic Reviews. 1999;22:261–274. doi: 10.1093/oxfordjournals.epirev.a018038. [DOI] [PubMed] [Google Scholar]
- House JS, Lepkowski JM, Kinney AM, Mero RP, Kessler RC, Herzog AR. The social stratification of aging and health. Journal of Health and Social Behavior. 1994;35:213–234. [PubMed] [Google Scholar]
- Jacobson P, Torgerson JS, Sjöström L, Bouchard C. Spouse resemblance in body mass index: effects on adult obesity prevalence in the offspring generation. American Journal of Epidemiology. 2007;165:101. doi: 10.1093/aje/kwj342. [DOI] [PubMed] [Google Scholar]
- Jeffery RW, Epstein LH, Wilson TG, Drewnowski A, Stunkard AJ, Wing RR. Long-term maintenance of weight loss: Current status. Health Psychology. 2000;19:5–16. doi: 10.1037/0278-6133.19.suppl1.5. [DOI] [PubMed] [Google Scholar]
- Lahmann PH, Lissner L, Gullberg B, Berglund G. Sociodemographic factors associated with long-term weight gain, current body fatness and central adiposity in Swedish women. International Journal of Obesity. 2000;24:685–604. doi: 10.1038/sj.ijo.0801219. [DOI] [PubMed] [Google Scholar]
- Liu S, Serdula MK, Williamson DF, Mokdad AH, Byers T. A prospective study of alcohol intake and change in body weight among US adults. American Journal of Epidemiology. 1994;140:912–920. doi: 10.1093/oxfordjournals.aje.a117179. [DOI] [PubMed] [Google Scholar]
- Milkie M, Bierman A, Schieman S. How adult children influence older parents' mental health: Integrating stress-process and life-course perspectives. Social Psychology Quarterly. 2008;71:86–105. [Google Scholar]
- Mirowsky J. Analyzing associations between mental health and social circumstances. In: Aneshensel CS, Phelan JC, editors. Handbooks of Sociology and Social Research. New York: Springer Press; 1999. pp. 105–123. [Google Scholar]
- Mirowsky J, Kim J. Graphing age trajectories: Vector graphs, synthetic and virtual cohort projections, and cross-sectional profiles of depression. Sociological Methods and Research. 2007;35:497–541. [Google Scholar]
- Muthén LK, Muthén BO. MPlus User's Guide. Muthén and Muthén; 2007. [Google Scholar]
- Nomaguchi KM, Bianchi SM. Exercise time: Gender differences in the effects of marriage, parenthood, and employment. Journal of Marriage and Family. 2004;66:413–430. [Google Scholar]
- Oliver E. Fat politics: The real story behind America's obesity epidemic. New York: Oxford University Press; 2006. [Google Scholar]
- Rennie KL, Jebb SA. Prevalence of obesity in Great Britain. Obesity Reviews. 2005;6:11–12. doi: 10.1111/j.1467-789X.2005.00164.x. [DOI] [PubMed] [Google Scholar]
- Singer JD, Willett JB. Applied Longitudinal Data Analysis: Modeling Change and Event Occurrence. New York: Oxford University Press; 2003. [Google Scholar]
- Sobal J, Rauschenbach B, Frongillo EA. Marital status changes and body weight changes: A US longitudinal analysis. Social Science & Medicine. 2003;56:1543–1555. doi: 10.1016/s0277-9536(02)00155-7. [DOI] [PubMed] [Google Scholar]
- Umberson D, Liu H, Powers D. Marital status, marital transitions, and body weight. Journal of Health and Social Behavior. 2009;50:327–343. doi: 10.1177/002214650905000306. [DOI] [PMC free article] [PubMed] [Google Scholar]
- Umberson D, Pudrovska T, Reczek C. Parenthood, childlessness, and well-being: A life course perspective. Journal of Marriage and Family. 2010;72:621–629. doi: 10.1111/j.1741-3737.2010.00721.x. [DOI] [PMC free article] [PubMed] [Google Scholar]
- Wane SB, Jannique van SC, Uffelen GZ, Brown T. Determinants of Weight Gain in Young Women: A Review of the Literature. Journal of Women's Health. 2010;19:1327–1340. doi: 10.1089/jwh.2009.1738. [DOI] [PubMed] [Google Scholar]
- Weng HH, Bastian LA, Taylor DH, Moser BK, Ostbye T. Number of children associated with obesity in middle-aged women and men: Results from the Health and Retirement Study. Journal of Women's Health. 2004;13:85–91. doi: 10.1089/154099904322836492. [DOI] [PubMed] [Google Scholar]
- Williamson DF, Madans J, Anda RF, Kleinman JC, Giovino GA, Byers T. Smoking cessation and severity of weight gain in a national cohort. New England Journal of Medicine. 1991;324:739–745. doi: 10.1056/NEJM199103143241106. [DOI] [PubMed] [Google Scholar]
- World Health Organization. Obesity and overweight. 2006 Retrieved from http://www.who.int/hpr/NPH/docs/gs_obesity.pdf (11 March 2006)