

Abstract
Background
Although hair testing is well established for the assessment of past drug exposure, uncertainties persist about mechanisms of drug incorporation into hair and interpretation of results. The aim of this study was to administer methamphetamine (MAMP) under controlled conditions as a model drug to investigate drug incorporation into human hair.
Material and Methods
Seven volunteers with a history of stimulant use received 4×10 mg (low) doses of sustained release S-(+)-MAMP HCl within one week, with weekly head hair samples collected by shaving. 3 weeks later, 4 of them received 4×20 mg (high) doses. After extensive isopropanol/phosphate buffer washing of the hair, MAMP and its metabolite amphetamine (AMP) concentrations were determined in all weekly hair samples by LC-MS-MS in selected reaction monitoring mode with the undeca- and deca-deuterated drugs, respectively, as internal standards (LLOQ, 0.005 ng/mg).
Results
MAMP Tmax occurred from 1 to 2 weeks after both doses, with Cmax ranging from 0.6–3.5 ng/mg after the low and 1.2–5.3 ng/mg after the high MAMP doses. AMP Cmax in hair was 0.1–0.3 ng/mg and 0.2–0.5 ng/mg, respectively, for low and high doses. Highly dose–related concentrations within subjects, but large variability between subjects were observed. MAMP concentrations were above the 0.2 ng/mg cutoff for at least two weeks following administration of both low and high doses. The overall AMP/MAMP ratio ranged from 0.07 to 0.37 with a mean value of 0.15±0.07, and a median of 0.13. The percentage of MAMP and AMP removed with the washing procedure decreased with time after administration. A strong correlation was found between area under the curve of MAMP (r2=0.90, p=0.00) and AMP (r2=0.94, p=0.00) concentrations calculated for the 3-week period following administration and the total melanin concentration in hair. Significant correlations were observed also between Cmax and melanin.
Conclusions
This study demonstrated that despite large inter-individual differences, the incorporation of MAMP and AMP into hair is dose-related with much of the observed scatter of MAMP and AMP concentrations explained by melanin concentration in hair.
Keywords: methamphetamine, LC-MS-MS, hair, controlled administration, melanin
1. INTRODUCTION
Hair analysis has gained a well established role in forensic and clinical testing for past exposure to drugs. Advantages of hair testing as compared to analyses of other matrices for drugs is the much wider window of drug detection, enabling assessment of drug exposure well beyond the period of drug elimination from blood and urine. Additional advantages are the possibility of segmental analysis to document drug use history over time, and the detection of parent compounds, often permitting discrimination between different sources of exposure (e.g. heroin use from morphine or codeine intake). Practically, hair testing offers significant advantages, as its collection and storage are simple and inexpensive, as compared to other body fluids.
Nevertheless, many issues remain under discussion, including those of environmental contamination and removal of drugs due to different types of cosmetic treatments, and the ability of pre-analytical washing(s) of hair to remove external contamination and spare “actively” incorporated drug. Cut-off concentrations and analytes to discriminate between drug use and passive exposure (e.g. to smoked drugs), the lag time before a positive hair sample can be obtained after intake, and the role of melanin in drug incorporation, and correlations between dose and concentrations in hair are not yet fully understood.
The present work investigated some of these knowledge gaps through a controlled human study of the disposition of drugs in hair following oral methamphetamine administration. The incorporation of methamphetamine and its metabolite amphetamine in head hair was followed for a 3-week period after administration of 2 different methamphetamine dosages (4×10 mg and 4×20 mg), and methamphetamine and amphetamine concentrations were determined in discreet weekly hair samples collected by shaving the head, as well as in the respective hair wash solutions.
2. EXPERIMENTAL
2. 1 Protocol of Drug Administration
Seven volunteers with a history of stimulant use provided written informed consent to participate in a 10-week inpatient study approved by the National Institute on Drug Abuse (NIDA) Institutional Review Board and conducted at the Clinical Research Unit of the NIDA Intramural Research Program. Subjects’ characteristics are listed in Table 1. Before admission, subjects were submitted to clinical and psychological evaluations. During the study, individuals were kept under 24-h medical surveillance in order to ensure their safety and to prevent drug use outside the protocol. Participants were allowed to carry out normal activities including exercise and outside sport activities in a walled courtyard. The study was carried out over multiple years at all seasons.
Table 1.
Subjects characteristics, melanin concentration in hair, methamphetamine (MAMP) and amphetamine (AMP) concentration in weekly sweat patches, weeks 4 and 8.
| Subject | Gender | Age (y) |
Weight (kg) |
Race | Hair color |
Melanin in hair (µg/mg) |
|---|---|---|---|---|---|---|
| 1 | M | 38 | 66.4 | Caucasian | Black | 34.60 |
| 2 | F | 35 | 54.7 | African-American | Black | 51.75 |
| 3 | M | 26 | 103.2 | Caucasian | Dark | 22.95 |
| Brown | ||||||
| 4 | F | 34 | 57.5 | African American | Black | 41.55 |
| 5 | M | 39 | 67.2 | Hispanic | Black | 45.80 |
| 6 | F | 34 | 65.5 | African American | Black | 51.70 |
| 7 | M | 34 | 95.4 | Hispanic | Black | 44.25 |
| Mean | 34.3 | 72.8 | 41.80 | |||
| SD | 4.2 | 18.8 | 10.20 | |||
| Median | 34 | 66.4 | 44.20 | |||
| Minimum | 26 | 54.7 | 22.90 | |||
| Maximum | 39 | 103.2 | 51.7 | |||
After at least a 2-week washout period, subjects received four sustained-release 10-mg (low) oral doses of S-(+)-methamphetamine hydrochloride (Desoxyn Gradumet, Abbott Laboratories, USA) within 1 week. Dosing was carried out, whenever possible, on consecutive days (Monday to Thursday). However, in some cases this was not possible due to increased baseline heart rate or research unit schedules. After another 3-week interval, participants received 4 daily 20-mg (high) oral doses. Three of 7 participants were disqualified either for medical reasons (2 subjects) or personal issues (1 subject): subject no. 2 was disqualified before the second sample after the low dose, whereas in the case of subjects 4 and 6 only the low dose experiment could be performed. Further information about the study protocol is available in previous publications1–4.
2.2 Collection of specimens
Initial hair was collected before the first MA administration with clippers from different regions of the scalp hair (frontal, anterior vertex, posterior vertex, nape, and temporal hair). Initial hair was stored temporarily in Ziploc™ plastic bags until it could be cut with scissors in 2–3 mm segments and transferred to glass vessels for storage at −30°C. The remaining hair stubble was removed with shaving cream and a disposable straight-edge razor, and discarded. Subsequently, “weekly” (sampling interval varied from 5 to 12 days) hair samples (2–3 mm length) were collected as close as possible to the scalp with a clean electric shaver (Norelco, Stamford, CT, USA). Again, the remaining stubble was removed with a straight edge razor and discarded. After collecting the maximum amount of hair possible from the razor collection chamber, the razor components (screen, blades, and brackets) were placed in a beaker and rinsed with running tap water. Then, the beaker was filled with absolute ethanol. After at least 30 min, the ethanol was drained from the beaker and razor components were left to air dry before being reassembled for future use. Storage time was months to years, depending on the subject. For the purpose of the present study, and unless otherwise specified, only posterior vertex samples were analyzed for methamphetamine and amphetamine.
2.3 Reagents and Materials
Methamphetamine (MAMP) hydrochloride and amphetamine (AMP) sulphate for preparation of calibrators were obtained from Sigma-Aldrich (St. Louis, MO). AMP, MAMP as free bases in methanolic solution (1 mg/ml) for the preparation of control and validation samples were purchased from Cerilliant (Austin, Texas). MAMP-d11 and AMP-d10 as free bases in methanolic solutions (0.1 mg/ml) also were purchased from Cerilliant. Proteinase K (lyophilized powder, 10.2 units/mg), dithiothreitol (DTT), sodium dodecylsulphate (SDS), and sepia melanin (99%) were purchased from Sigma-Aldrich. N-Methyl,-N-(tert-butyldimethylsilyl)-trifluoroacetamide+ 1% tert-butyldimethylchlorosylane (MTBSTFA) were from Pierce (Rockford, IL). Soluene-350 was obtained from Packard Instrument Company (Meridien, CT). All solvents used (methanol, acetonitrile, and 2-propanol) were HPLC grade. Water was prepared by filtering distilled water on a Milli-Q A10 filtration system from Millipore (Bedford, MA). Cellulose and nylon 0.45 µm-pore size filters for mobile phase filtration were obtained from Agilent (Palo Alto, CA). All other chemicals were reagent grade. Fritted filter reservoirs (4 mL, RFV02F4P) with luer plug and solid phase extraction (SPE) columns (Clean Screen DAU, 200 mg-10 mL) were bought from United Chemical Technologies Inc. (Bristol, PA). Micro disposable magnetic stir-bars were from PGC-Scientifics (Frederick, MD).
0.01 M phosphate buffer (pH 5.6) was prepared by mixing 52 ml 0.01 M solution of sodium phosphate dibasic with 948 ml 0.01 M solution of sodium phosphate monobasic. 0.5 M Tris buffer (pH 6.2) was prepared by dissolving 75.6 g of Tris (hydroxymethyl) aminomethane hydrochloride and 2.42 g of Tris (hydroxymethyl) aminomethane in 1 l of water. 0.5 M Acetate buffer (pH 4) was prepared by mixing 854 ml 0.5 M glacial acetic acid solution with 145 ml 0.5 M sodium acetate solution. The enzymatic digesting solution was prepared fresh daily by dissolving 320 U of Protease K, 480 mg DTT and 1.8 g SDS in 80 ml Tris buffer. The mobile phase consisted of a mixture of water (A) and acetonitrile/water (99.5:0.5 v/v, B) both containing 2 mmol/l ammonium formate and 0.1% (v/v) formic acid. Component B mobile phase was prepared by dissolving 126 mg ammonium formate in 5 ml water. After the addition of 1 ml formic acid, the solution was made up to 1000 ml with acetonitrile. Both components of the mobile phase were filtered on 0.45 µm cellulose (A) and nylon (B) filters and degassed with helium before and during use.
2.4 Determination of methamphetamine and amphetamine in hair
2.4.1 Sample preparation
The following procedure was applied either to hair samples from the controlled study of MAMP administration or blank hair samples utilized for the preparation of calibrators and controls.
Washing procedure
A 10-mg hair sample was added to a fritted filter reservoir fitted with a luer plug. 2 mL 2-propanol and a disposable stir-bar were added. The sample was incubated for 15 min in a heat/stir Pierce Reacti-Therm unit at 37 °C and at 20% maximum stirring speed. The luer plug was removed and 2-propanol collected under vacuum in a glass tube. The fritted reservoir was fitted again with the luer plug, 2 ml 0.01 M phosphate buffer were added, and the sample incubated for 30 min at 37 °C and at 20% maximum stirring speed. The phosphate buffer was collected under vacuum in a glass tube and two further washes with phosphate buffer were applied as just described. The three phosphate washes were combined. The 2-propanol wash and the combined phosphate buffer washes were stored at −20 °C until analysis.
Enzymatic digestion
Internal standards (50 µl of a water solution of MAMP-d11 and AMP-d10, each at 0.1 ng/µl) and a 2-ml volume of the enzymatic digesting solution were added, and the reservoir capped and incubated overnight at 37 °C and at maximum stirring speed.
Solid Phase extraction
After overnight incubation, the enzymatic digest was collected under vacuum in a glass tube and the reservoir was washed with 2 ml 0.5 M acetate buffer. 2-ml acetate buffer were added to the glass tube and the diluted enzymatic digest was gently stirred for a few s. The digest was poured into a SPE cartridge previously conditioned with 2 × 3 ml methanol, 2 × 3 ml water, and 0.5 ml 0.5 M acetate buffer. The cartridge was washed with 2 × 1 ml water, followed by 1 ml 0.2 M HCl, and 2 × 1 ml methanol, and dried for 5 min under vacuum. Elution of analytes was carried out with four consecutive 1-ml aliquots of methylene chloride/2-propanol/ammonium hydroxide (80:20:2 v/v/v). After the addition of 20 µl MTBSTFA, the extract was evaporated to dryness with nitrogen at 55°C, reconstituted with 200 µl A mobile phase (vortex, 30 s), centrifuged (1600 × g/5 min), and transferred with Pasteur pipettes into 250-µl autosampler microvials. A 20-µl volume of the extract was submitted to instrumental analysis.
2.4.2 Instrumental analysis
LC-MS-MS instrumentation consisted of the following components: (a) a Perkin-Elmer (Norwalk, CT, USA) Series 200 Autosampler (injector needle and valve were flushed in between sample injections with a water/methanol, 75:25 v/v, solution); (b) two Perkin Elmer Series 200 pumps connected together through a 10 µl tee mixer (Lee Company, Westbrok, CT); (c) a PE-Sciex (Foster City, Canada) API 3000 tandem mass spectrometer equipped with a TurboIonSpray® interface.
Chromatographic separation was carried out on a Chrompack Inertsil ODS-3 column 100 × 3mm I.D., 3 µm particle size (Varian, Walnut Creek, CA) equipped with Chrompack 10 × 2 mm RP-guard column. Gradient elution at a constant 0.7 ml/min flow rate was performed as follows: 95% A for 0.1 min, linear decrease to 80% A in 6.0 min, step decrease to 50% A with 3 min hold, step increase to 95% A with 6-min equilibration before the next injection (total run time: 15.1 min).
Electrospray ionization of analytes utilized the following settings: source temperature, 475 °C; ion source voltage, 1250 V; orifice and ring voltages, 30 and 125 V, respectively; nebulizer and curtain gases (nitrogen) settings, 10 and 8, respectively; heater gas (nitrogen), 8 l/min.
Tandem mass spectrometric analysis was performed with nitrogen as collision gas (setting, 10). The following transitions were monitored: m/z 150 → m/z 119 (collision energy, −16 eV) and m/z 150 → m/z 91(−40 eV) for MAMP; m/z 161 → m/z 127 (−16 eV) and m/z 161 → m/z 97 (−40 eV) for MAMP-d11; m/z 136 → m/z 119 (−14 eV) and m/z 136 → m/z 91 (−30 eV) for AMP; m/z 146 → m/z 129 (−14 eV) and m/z 146 → m/z 98 (−30 eV) for AMP-d10. The total scan time was 1.21 s. For each analyte, the reaction in bold identifies the quantitative ion, the non-bold ion was the qualifier ion (relative intensity within 25% of that of the calibrators).
2.4.3 Method validation
Calibration curves were established by preparing 9 calibrators, containing MAMP and AMP each at concentrations of 0.000, 0.005, 0.013, 0.025.0.050. 0.125, 0.250, 0.500, 2.500, and 5.000 ng/mg. The lower limit of quantification (LOQ) was set to 0.005 ng/. Method selectivity was assessed by examining three different blank human hair samples, as well as the hair samples of subjects participating in the study prior to administration of MAMP. Matrix effects were assessed at 0.050 and 0.625 ng/mg with the post extraction addition method5,6 that compared absolute peak areas of analytes added to 6 blank hair matrices after extraction (P) to a pure standard solution of the respective analytes at the same concentrations (R), using the formula: (P-R)/R*100. A negative control and 2 positive controls at 0.6250 and 0.0625 ng/mg of MAMP and AMP, prepared in washed blank hair samples, were included in all batches and were required to quantify within 20% of target concentration. Relative retention times were required to be within 2% of analytes in control samples.
2.5 Spectrophotometric determination of total melanin in hair
The method proposed by Ozeki et al.7, with minor modifications, was used. Unwashed hair sample (4 mg) was put in a screw-cap glass vial. 0.2 ml water and 1.8 ml Soluene 350 were added, and the vial was capped and incubated at 80°C for 30 min. After cooling, the vial was briefly vortexed and heated for 15 min. After cooling, the absorbance at 500 nm was measured with a Beckman DU70 UV/visible spectrophotometer. A suspension of sepia melanin in water (2 mg/ml) was prepared by dispersing 2 mg melanin in 4 ml water and sonicating for 5 min. A calibration curve was prepared by submitting 25, 50, 100, 200, 300, and 400 µg sepia melanin to the solubilization procedure previously described for hair. A blank prepared with albino rat hair was included in each batch and its absorbance was subtracted from those of the samples. The absorbance at 500 nm (A500) was a measure of total melanin.
3. RESULTS
3.1 Determination of methamphetamine and amphetamine in hair
Typical equation curves (1/x weighted regression analysis) were y = 1.842x + 0.004 (MAMP), y = 0.909x + 0.007 (AMP), where y is the peak-area ratio (analyte/internal standard) and x is the theoretical concentration. Correlation coefficients were higher than 0.999.
Intra- and inter-day imprecision and bias for MAMP and AMP are shown in Table S1. The limit of quantification was established at 0.005 ng/mg for MAMP and AMP on the basis of the bias and imprecision of the determinations at this concentration (within 20%, see table S1). Method selectivity was demonstrated by the absence of interferences coeluting with the analytes in all blank human hair samples, including hair samples of subjects participating in the study collected before administration of MAMP. The mean deviation of analyte response (absolute peak area) added post-extraction to extracted blank hair, as compared to the pure standard solutions, was always less than 5%.
3.2 Determination of total melanin in hair
The spectrophotometric method for melanin quantification in hair developed by Ozeki et al.7 was selected due to its simplicity and applicability on a routine basis. Eumelanin was reported to have a higher binding capacity for drugs than pheomelanin8 and could provide, therefore, a better normalization for pigmentation of hair than total melanin. However, Kronstrand9 found that codeine in hair better correlated with total melanin than with eumelanin when hair concentrations were not normalized for the codeine plasma area under the curve. A linear calibration curve was established for melanin between 25 and 400 µg. The equation was y = 0.0037x + 0.0457, where Y is the absorbance at 500 nm and x is the amount of melanin in the sample. The correlation coefficient was higher than 0.998. Intra- and inter-day CVs were less than 6.3% and 3.9%, respectively. The melanin content of hair from the seven subjects under study is reported, together with subjects’ characteristics, in Table 1.
3.3 Disposition of methamphetamine and amphetamine in hair
The time courses of MAMP and AMP concentrations in 7 subjects’ hair are shown in Figure 1. Maximum times (Tmax) and concentrations (Cmax) are reported in Table 2. The area under the curve of MAMP and AMP hair concentrations calculated during the 3-week period after 4×10-mg and after 4×20-mg doses (AUC1–3), also are reported in Table 2.
Figure 1.
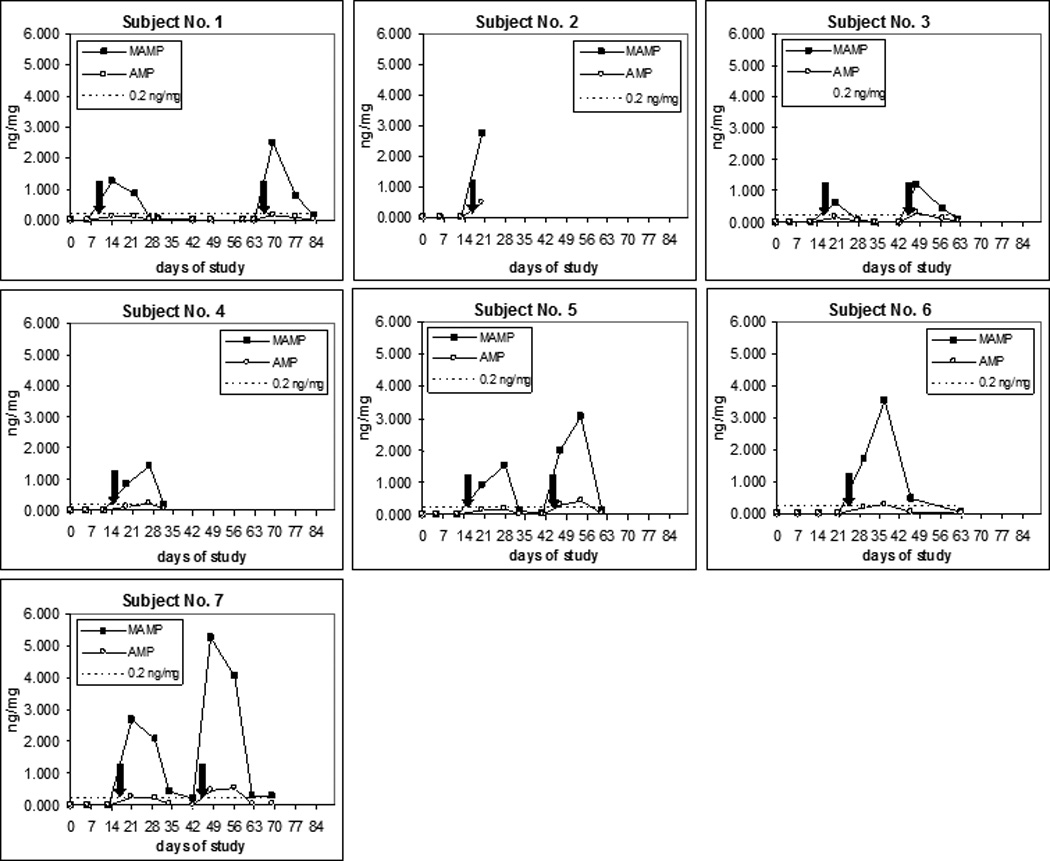
Time course of methamphetamine (MAMP) and amphetamine (AMP) concentrations in hair. The black arrows indicate the time of low (4×10 mg, left arrow) and high dosing (4×20 mg, right arrow) MAMP administration.
Table 2.
Maximum time (Tmax), maximum concentration (Cmax) in hair and area under the curve (AUC1–3) calculated for the 3-week period following low (4×10 mg) and high (4×20 mg) oral methamphetamine administration. MAMP = methamphetamine; AMP = amphetamine; MAMP+AMP: sum of MAMP and AMP (the latter expressed as MAMP equivalents).
| MAMP | AMP | MAMP+AMP | ||||||||
|---|---|---|---|---|---|---|---|---|---|---|
| Subject | Dose (mg) |
Tmax (weeks) |
Cmax (ng/mg) |
AUC1–3 (ng/week*mg) |
Tmax (weeks) |
Cmax (ng/mg) |
AUC1–3 (ng/week*mg) |
Tmax (weeks) |
Cmax (ng/mg) |
AUC1–3 (ng/week*mg) |
| 1 | 4×10 | 1 | 1.24 | 2.22 | 1 | 0.13 | 0.24 | 1 | 1.38 | 2.48 |
| 4×20 | 1 | 2.49 | 3.32 | 1 | 0.16 | 0.24 | 1 | 2.67 | 3.58 | |
| 2 | 4×10 | - | - | - | - | - | - | - | - | - |
| 4×20 | - | - | - | - | - | - | - | - | - | |
| 3 | 4×10 | 1 | 0.60 | 0.76 | 1 | 0.13 | 0.18 | 1 | 0.74 | 0.96 |
| 4×20 | 1 | 1.18 | 1.71 | 1 | 0.27 | 0.41 | 1 | 1.48 | 2.16 | |
| 4 | 4×10 | 2 | 1.13 | 2.35 | 2 | 0.17 | 0.34 | 2 | 1.32 | 2.73 |
| 4×20 | - | - | - | - | - | - | - | - | - | |
| 5 | 4×10 | 2 | 1.52 | 2.51 | 2 | 0.19 | 0.33 | 2 | 1.73 | 2.87 |
| 4×20 | 2 | 3.07 | 4.99 | 2 | 0.44 | 0.73 | 2 | 3.56 | 5.80 | |
| 6 | 4×10 | 2 | 3.53 | 6.29 | 2 | 0.30 | 0.55 | 2 | 3.86 | 6.90 |
| 4×20 | - | - | - | - | - | - | - | - | - | |
| 7 | 4×10 | 1 | 2.68 | 5.12 | 1 | 0.27 | 0.52 | 1 | 2.98 | 5.69 |
| 4×20 | 1 | 5.25 | 9.52 | 2 | 0.54 | 1.02 | 1 | 5.85 | 10.65 | |
| Mean | 4×10 | 1.5 | 1.78 | 3.21 | 1.5 | 0.20 | 0.36 | 1.5 | 2.00 | 3.61 |
| 4×20 | 1.3 | 3.00 | 4.89 | 1.5 | 0.35 | 0.60 | 1.5 | 3.39 | 5.55 | |
| Dev.St. | 4×10 | 0.5 | 1.10 | 2.07 | 0.5 | 0.07 | 0.15 | 0.5 | 1.18 | 2.23 |
| 4×20 | 0.5 | 1.70 | 3.37 | 0.6 | 0.17 | 0.35 | 0.6 | 1.85 | 3.71 | |
| Median | 4×10 | 1.5 | 1.38 | 2.43 | 1.5 | 0.18 | 0.34 | 1.5 | 1.56 | 2.80 |
| 4×20 | 1.0 | 2.78 | 4.16 | 1.5 | 0.36 | 0.57 | 1.5 | 3.11 | 4.69 | |
| Min | 4×10 | 1.0 | 0.60 | 0.76 | 1.0 | 0.13 | 0.18 | 1.0 | 0.74 | 0.96 |
| 4×20 | 1.0 | 1.18 | 1.71 | 1.0 | 0.16 | 0.24 | 1.0 | 1.48 | 2.16 | |
| Max | 4×10 | 2.0 | 3.53 | 6.29 | 2.0 | 0.30 | 0.55 | 2.0 | 3.86 | 6.90 |
| 4×20 | 2.0 | 5.25 | 9.52 | 2.0 | 0.54 | 1.02 | 2.0 | 5.85 | 10.65 | |
No hair sample collected during the washout period had detectable MAMP or AMP. In all subjects, and at both low and high doses, MAMP and AMP were first detected in the first hair sample collected, i.e. 6–8 days after the first MAMP low or high dose. However, MAMP peaked in the first hair sample after dosing in subjects 1, 3 and 7, whereas in subjects 4, 5 and 6 the MAMP peak concentration occurred one week later, and this observation was consistent across doses. AMP showed the same behavior as MAMP with the only exception being Subject 7, in whom hair concentration peaked in the first sample after the low dose and in the second hair sample after high dose. The different administration pattern imposed by the protocol (see section “Protocol of Drug Administration”) might partly explain these differences in Tmax among subjects. However, Subjects 3, 4 and 5, who received the same administration pattern (dosing on 4 consecutive days for the 10 and 20-mg doses, with first dose 7 days before hair collection) had different Tmax: first sample for Subject 3 and second for Subjects 4 and 5. Conversely, Subject 7, who received low and high doses with substantially different administration patterns (10-mg doses at 7, 6, 4, and 1 days before hair collection, and 20-mg doses on consecutive days starting 7 days before hair collection), had quite similar time courses (Tmax=1 in both cases). Therefore, the observed different Tmax might be explained with a slower hair growth rate in subjects 4–6, as compared to the other subjects, although this information was not available.
In Subjects 3 and 6, the distribution of MAMP and AMP in different scalp regions, namely frontal, anterior vertex, posterior vertex, nape, and temporal hair, was investigated (figure S1).
The removal of MAMP and AMP from hair with the washing procedure (isopropanol wash followed by 3 subsequent phosphate buffer washes) was investigated by analyzing MAMP and AMP in washes and comparing drug amounts in washes, with residual amounts in washed hair. In general, the three phosphate buffer washes were combined and analyzed together. However, in selected samples the three phosphate buffer washes were analyzed separately in order to investigate the kinetics of removal of analytes from hair (Table 3).
Table 3.
Methamphetamine (MAMP) and amphetamine (AMP) concentrations in hair, and washes expressed as percentage of the total amount detected (hair + washes).
| Subject/Sample | Hair (%) |
isopropanol wash (%) |
phosphate buffer wash 1 (%) |
phosphate buffer wash 2 (%) |
phosphate buffer wash 3 (%) |
Sum phosphate buffer washes (%) |
Total | |
|---|---|---|---|---|---|---|---|---|
| 3/week 1 after 4×10 mg | MAMP | 60.8 | 2.6 | 26.0 | 6.9 | 3.6 | 36.6 | 100.0 |
| AMP | 48.9 | 5.9 | 32.2 | 8.3 | 4.7 | 45.1 | 100.0 | |
| 3/week 2 after 4×10 mg | MAMP | 89.3 | 0.0 | 10.7 | 0.0 | 0.0 | 10.7 | 100.0 |
| AMP | 80.0 | 0.0 | 20.0 | 0.0 | 0.0 | 20.0 | 100.0 | |
| 6/week 1 after 4×10 mg | MAMP | 76.2 | 5.2 | 13.1 | 3.8 | 1.8 | 18.6 | 100.0 |
| AMP | 72.7 | 5.4 | 15.2 | 4.4 | 2.2 | 21.9 | 100.0 | |
| 6/week 2 after 4×10 mg | MAMP | 82.4 | 0.7 | 12.1 | 2.9 | 1.9 | 16.9 | 100.0 |
| AMP | 82.4 | 0.0 | 12.4 | 3.1 | 2.1 | 17.6 | 100.0 | |
| 6/week 3 after 4×10 mg | MAMP | 93.3 | 0.0 | 4.6 | 1.3 | 0.8 | 6.7 | 100.0 |
| AMP | 92.8 | 0.0 | 7.2 | 0.0 | 0.0 | 7.2 | 100.0 | |
4. DISCUSSION
Hair analysis is typically employed for the assessment of repeated or chronic exposure to drugs in different settings10,11. In postmortem toxicology, hair analysis may be useful for the assessment of naïve12 or chronic13 MAMP intake, in order to evaluate a subject’s tolerance. Analysis of maternal and neonatal hair is also a valid tool to assess intrauterine exposure to MAMP14.
4.1 Correlation between dose and concentration in hair
One of the issues still debated in hair analysis is the existence of a dose-hair concentration relationship. There is general agreement that a good within-subject correlation is generally found in controlled studies, whereas the inter-individual correlation may br poor. To our knowledge, although limited to 7 subjects, these are the first data on MAMP and AMP incorporation in human hair after controlled administration. We report a good within-subject correlation between dose and MAMP and AMP hair concentrations (Table 2, figure 1), and their sum - expressed as MAMP equivalents – as well. In all cases, hair concentrations after the high dose were about two times those of the low dose, with the only exception Subject 1, whose MAMP hair levels after the high dose were less than 2 times those of the low dose and who had almost identical concentrations of AMP after the low and high doses. Yet large differences in Cmax and AUC1–3 was observed among subjects: MAMP Cmax ranged from 0.6 to 3.5 ng/mg after the low and 1.2 to 5.3 ng/mg after the high dose. Corresponding ranges for AMP were 0.1–0.3 ng/mg and 0.2–0.5 ng/mg, respectively. Similar differences were observed also for AUC1–3 (Table 2).
4.2 Time Course in Hair
According to the model of drug incorporation into hair by passive diffusion from blood into cells of the hair bulb, excretion in hair should be delayed a few days because new hair takes some time to emerge from the skin surface and be available for shaving. This explains why, after repeated dosing, high MAMP and AMP levels were detected not only in week 1 but also in week 2 after administration.
After oral administration of methoxyphenamine (50 mg/day for 1 week) and collection of hair on the first day of the 2 following weeks, the drug was found to move along the hair shaft at 2.8–3.2 mm/week, according to the hair growth rate (approximately 1±0.5 cm/month)15. Lin et al.16 found that MAMP peaked at different distances from the root in hair collected from different users. These and other similar observations are the basis for the reconstruction of the history of drug use by segmental analysis. In our study, the collection of hair by shaving ensured that each week only new hair was collected. Therefore, the incorporation of MAMP/AMP into hair could be quite precisely followed and it was possible to confirm that, at least under controlled conditions, reconstructing the history of drug intake by segmental analysis is feasible. However, it is easy to predict that if the hair grew for one month and was divided into equal “weekly” segments, the pattern of incorporation probably would have been less clear due to sampling error, and the non-constant and asynchronous growth rate of hair.
4.3 Detection time window
For all subjects and after low and high doses, MAMP concentrations in hair were above the 0.2 ng/mg cut-off established by the Society of Hair Testing17 in the first week after MAMP administration and, with one exception (Subject 3, low dose), also during the second week after dosing. All subjects had detectable (i.e. above the LLOQs 0.005 ng/mg) MAMP and AMP levels in the hair sample collected during the third week after dosing. However, only 2 of 7 (Subject 7 after both doses, and Subject 6) had MAMP concentrations above the 0.2 ng/mg cut-off.
We estimated whether the administered MAMP doses would result in a positive “real-life” hair sample. If we assume that the growth rate of hair was constant during the 4-week period following MAMP administration, and infer that levels on week 4, when not available, are negligible (as supported by data from the only 2 subjects (6 and 7) with a 4th week sample (Figure 1), a hair segment corresponding to 1-month growth, made of equal parts of the 4 weekly segments (sum of drug concentrations in the 4 weekly segments divided by 4), would contain MAMP levels above the 0.2 ng/mg SOHT cut-off, with the only exception Subject 3 after the low dose, where the level would be 0.17 ng/mg. If we assume that no MAMP was taken during the following 2 months, the hair sample corresponding to 3-months’ growth would test positive, except Subject 3 at both doses and 1 after the low dose (0.18 ng/mg), with Subjects 4 and 5 just above the cut-off (0.21 and 0.22 ng/mg).
4.4 Sampling from different regions of the scalp hair
Although studies comparing the concentration of MAMP and AMP in hair collected from different parts of the body (head, axilla and pubic hair) were published18, this is, to our knowledge, the first study comparing MAMP and AMP in hair from different regions of the scalp.
Our results show rather large inter-regional variations in MAMP and AMP hair concentrations, with CV% ranging from 15 to 39%. However, these were not consistent among or within-subjects (Figure S1), although in general, higher concentrations were detected in the nape, temporal and posterior vertex regions than in the frontal and anterior vertex regions.
4.5 Hair washing
When hair is exposed to the external environment, the chance of external passive contamination (e.g. through drug-laden smoke) cannot be excluded. In fact, contamination is quite difficult to remove from hair19. Hair washes before analysis should never be omitted. Comparing the amount of drug in the wash and in hair is a useful approach for the correct interpretation of results.
As shown in Table 3, the isopropanol wash accounted for the removal of only small amounts of MAMP and AMP from hair (5% or less), whereas the buffer washes removed much larger amounts. Decreasing amounts of analytes were detected in the three phosphate washes. Although in many cases MAMP and/or AMP were still detectable in the third phosphate buffer wash, the percentage of analyte removed by the last wash was always less than 5% of the total amount found in hair and washes.
Quite interestingly, a decreasing trend with time after dosing was observed in the ratio between analyte in washes (sum of isopropanol and of the 3 phosphate buffer washes)/analyte in hair (Figure 2). This clearly indicates that the amount of analyte the washing procedure removes from hair decreases with time after administration or, that the strength of MAMP and/or AMP binding in hair matrix increases with time. The particular sampling protocol adopted in this study (weekly removal of hair with a razor), allowed us to exclude that this is due to repeated exposure of hair to hygienic treatments (shampoo), as all consecutive samples were exposed to such treatments for 1 week.
Figure 2.
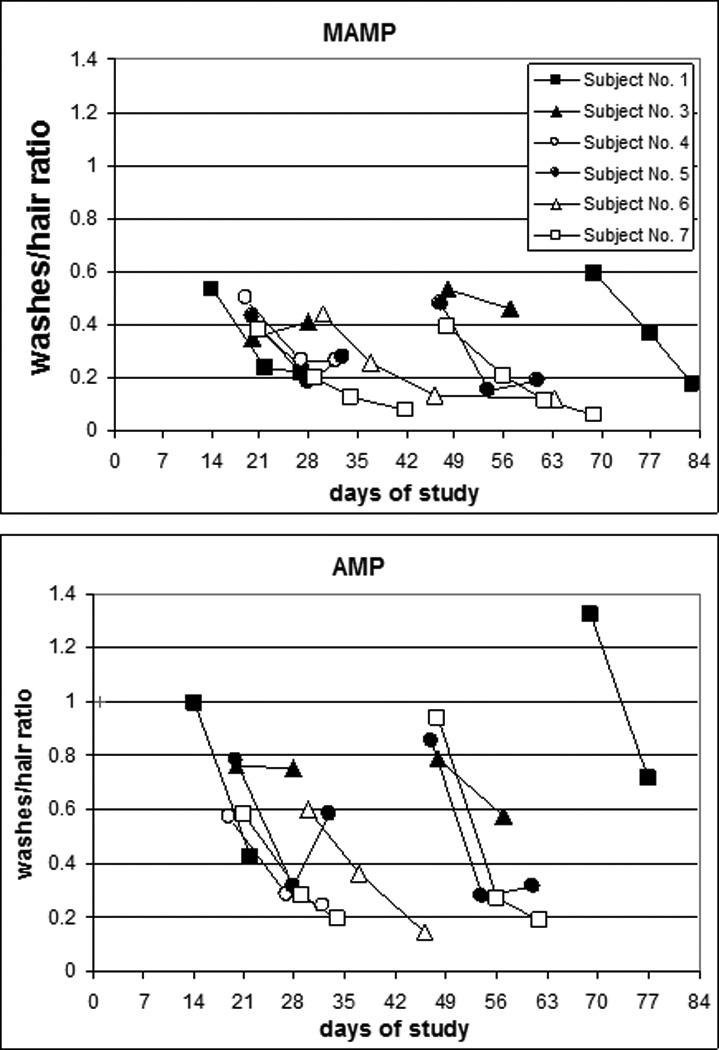
Ratio time course for methamphetamine (MAMP)/amphetamine (AMP) concentrations in summed washes and in the corresponding hair sample.
The sampling and administration protocols ensured that subjects had no other access to drugs other than the administered MAMP doses, and also excluded passive environmental contamination of hair. Therefore, the only possible sources of MAMP in hair are: (i) passive diffusion from blood, and (ii) contamination from sweat and/or sebum. It is well documented that drug contamination of hair from sweat may occur.20–22 MAMP and AMP excretion into sweat was extensively investigated1. Therefore, the amount of MAMP and AMP removed with washes entered the hair by either one of the two ways listed above and likely established a weak and non selective interaction with the hair matrix.
In general, as shown in Figure 2, the ratio of washes/analyte in hair was higher for AMP (ranging from 0.1 to 1.4) than MAMP (0.1–0.6) possibly indicating that the washing procedure selectively removes AMP from hair.
Another factor that helps exclude contamination is the detection of MAMP metabolites in hair. AMP detection can corroborate the hypothesis that MAMP in hair is due to intake and not passive drug exposure. AMP itself is an illicit drug. Our data clearly show that when MAMP is detected above the SOHT cutoff of 0.2 ng/mg, a lower cutoff (0.01 ng/mg) should be adopted for AMP as a MAMP metabolite (see the following section).
4.6 AMP/MAMP ratio
The metabolite/parent ratio may help discriminate different sources of drug. For example, it is known that selegiline, a selective monoamine oxidase-type B inhibitor prescribed for the treatment of Parkinson’s disease, is metabolized to MAMP and AMP23. Therefore, it is necessary to discriminate between MAMP, AMP, and selegiline ingestion (see Supplementary Data). Not unexpectedly, MAMP concentrations in hair were always higher than AMP in our study. The AMP/MAMP ratio, all samples considered, ranged from 0.07 to 0.37 with a mean value of 0.15±0.07, and a median of 0.13, which is in agreement with earlier observations24–29. A slight, although non-significant, increasing trend in AMP/MAMP ratio with time after MAMP administration was observed (Table S2). In general, in studies of controlled selegiline administration, the AMP/MAMP ratio is on average consistently higher than in case of MAMP intake24–29. However, ranges overlap. In addition, the apparent increase of the ratio over time after use is a further confounding factor. Therefore, the AMP/MAMP ratio alone should be used with extreme caution in discriminating selegiline and MAMP use.
4.7 Role of melanin
Melanin is proposed as an important factor for the incorporation of basic drugs into hair. Nakahara and colleagues30,31 were among the first to observe that an interaction between basic compounds and melanin is essential for incorporation into hair. This research group also found - by segmental analysis of monkey and human hair after methamphetamine intake - a good correlation between the duration of drug exposure and drug distribution in hair32.
The melanin-drug interaction was later confirmed by Kronstrand et al who noted a strong correlation between codeine9 and selegiline27 and melanin concentrations in human hair. Other studies confirmed these observations in human and animal models for MAMP and N-butylAMP33, haloperidol34,35, codeine36,37, and cocaine and metabolites37. The nature of this interaction is still unclear38. Cationic drugs are thought to be ionically bound to the polyanionic melanin molecule39. However, indications of covalent binding of drugs40, and of amphetamine in particular41, were noted, and hydrophobic and electrostatic interactions were claimed as well42. Different types of melanin (eumelanins, pheomelanins) may have different binding properties. Borges et al. found that eumelanin was the major determining factor of how much AMP and other basic drugs were incorporated into hair8.
On the other hand, the incorporation of neutral and acidic compounds in hair did not appear to be melanin-correlated, as demonstrated by Borges et al. in studies of the incorporation of AMP and its non-basic analogue N-acetylAMP in pigmented and non-pigmented rats43 and melanocites44 and by recent studies on ethyl glucuronide45–47 and fatty acid ethyl esters48.
The role of melanin in MAMP and other cationic compound incorporation in hair may lead to a so-called colour bias, as a subject with dark hair will have much higher drug concentrations than a subject with blonde hair exposed to the same doses. Borges and colleagues suggested that it may be possible to correct for this bias by normalizing drug concentrations in hair to the eumelanin content8. On the other hand, the hair sample may be adulterated with cosmetic treatments49 or more sophisticated methods50 to reduce drug binding in hair. Bleaching removed significant amounts (up to 39%) of MAMP from hair49,50. The topical application of a Protein Kinase C Inhibitor selectively blocked tanning and reduced basal pigmentation in the epidermis and in anagen hair shafts50. The possibility that incorporated drug in hair was removed by cosmetic treatments or that incorporation was reduced by modifying hair pigmentation should be carefully considered when interpreting hair results, especially in forensic settings. We observed a significant linear correlation between the AUC1–3 of MAMP after low MAMP doses and melanin concentration in hair (R2=0.68, p=0.03); the correlation improved after correcting AUC1–3 for body weight (i.e. AUC1–3/body weight*70 kg; R2=0.75, p=0.02) and transformation into natural logarithm (R2=0.90, p=0.00; Figure 3, top). A significant linear correlation also was found between AMP AUC1–3 after low dose MAMP and melanin: regression coefficients of 0.73 (p=0.02) and 0.86 (p=0.00) were obtained without and with correction for body weight. Again, a strengthening of correlation was obtained after logarithmic transformation (R2=0.94, p=0.00; Figure 3, bottom). Good correlation with melanin was obtained for the sum of the AUC1–3 of MAMP and AMP (the latter expressed as MAMP equivalents) corrected for body weight and transformed into the natural logarithm (R2=0.91, p=0.00).
Figure 3.
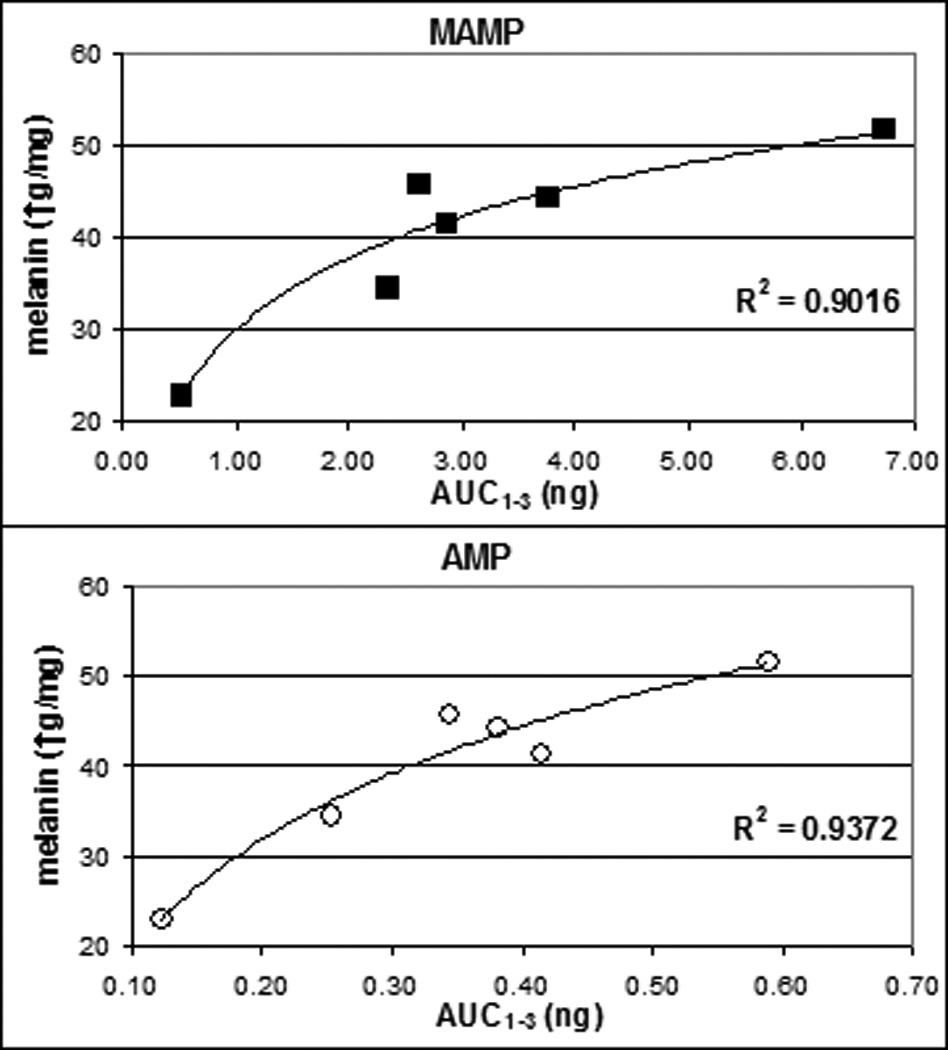
Correlation between methamphetamine (MAMP) and amphetamine (AMP) AUC1–3 expressed as natural logarithms and melanin concentration in hair.
Significant linear correlations were observed also between Cmax and melanin, both for MAMP (R2=0.64; p=0.04; R2=0. 73, p=0.02 after correction for body weight, and R2=0.92, p=0.00 after logarithmic transformation) and AMP (R2=0.66, p=0.04; R2=0.85, p=0.00, and R2=0.96, p=0.00, respectively).
Similar correlations with melanin were found for AUC1–3 MAMP, AUC1–3 AMP, and their sum (all corrected for body weight and transformed into natural logarithm) after high doses (R2=0.93, p=0.01; R2=0.73, p=0.10; and R2=0.95, p=0.01, respectively), despite the lower number of data points (4 subjects). Correlations between melanin and Cmax were also good after high doses (R2=0. 89, p=0.03 for MAMP; R2=0. 76, p=0.09 for AMP). These results clearly support the hypothesis of a relevant role of melanin for the incorporation of MAMP and AMP in hair.
In conclusion, this study demonstrated that under controlled conditions, and despite large inter-individual differences, the incorporation of MAMP and AMP into hair is dose-related. Much of the observed scatter of MAMP/AMP concentrations is explained by melanin concentrations in hair: the higher the total melanin concentration the higher the amount of incorporated drug. This study also provided insight on pre-analytical washing procedures, including the ability to remove drug from hair, on possible origins of drug incorporated in hair, and on differences in regional distribution of MAMP /AMP in head hair, providing a scientific basis for interpretation of hair analysis results.
Supplementary Material
Highlights.
We studied in vivo incorporation of methamphetamine in human head hair
Methamphetamine (40 and 80 mg) was administered under controlled conditions
methamphetamine and amphetamine incorporation was followed for 3 weeks
Influence of various factors (e.g. pre-analytical washing, melanin) was studied
Criteria to ascertain MAMP use based on MAMP/AMP ratio and AMP cutoff are proposed
Footnotes
Publisher's Disclaimer: This is a PDF file of an unedited manuscript that has been accepted for publication. As a service to our customers we are providing this early version of the manuscript. The manuscript will undergo copyediting, typesetting, and review of the resulting proof before it is published in its final citable form. Please note that during the production process errors may be discovered which could affect the content, and all legal disclaimers that apply to the journal pertain.
REFERENCES
- 1.Barnes AJ, Smith ML, Kacinko SL, Schwilke EW, Cone EJ, Moolchan ET, et al. Clin. Chem. 2008;54:172–180. doi: 10.1373/clinchem.2007.092304. [DOI] [PMC free article] [PubMed] [Google Scholar]
- 2.Schepers RJ, Oyler JM, Joseph RE, Jr, Cone EJ, Moolchan ET, Huestis MA. Clin. Chem. 2003;49:121–132. doi: 10.1373/49.1.121. [DOI] [PubMed] [Google Scholar]
- 3.Oyler JM, Cone EJ, Joseph RE, Jr, Moolchan ET, Huestis MA. Clin. Chem. 2002;48:1703–1714. [PubMed] [Google Scholar]
- 4.Kim I, Oyler JM, Moolchan ET, Cone EJ, Huestis MA. Ther Drug Monit. 2004;26:664–672. doi: 10.1097/00007691-200412000-00013. [DOI] [PubMed] [Google Scholar]
- 5.Matuszewski BK, Constanzer ML, Chavez-Eng CM. Anal. Chem. 1998;70:882–889. doi: 10.1021/ac971078+. [DOI] [PubMed] [Google Scholar]
- 6.Taylor PJ. In: Application of LC-MS in Toxicology. Polettini A, editor. London: Pharmaceutical Press; 2006. pp. 23–42. [Google Scholar]
- 7.Ozeki H, Ito S, Wakamatsu K. Pigment Cell Res. 1996;9:51–57. doi: 10.1111/j.1600-0749.1996.tb00088.x. [DOI] [PubMed] [Google Scholar]
- 8.Borges CR, Roberts JC, Wilkins DG, Rollins DE. J. Anal. Toxicol. 2003;27:125–134. doi: 10.1093/jat/27.3.125. [DOI] [PubMed] [Google Scholar]
- 9.Kronstrand R, Forstberg-Peterson S, Kagedal B, Ahlner J, Larson G. Clin. Chem. 1999;45:1485–1494. [PubMed] [Google Scholar]
- 10.Tsanaclis L, Wicks JK. Forensic Sci. Int. 2007;170:121–128. doi: 10.1016/j.forsciint.2007.03.033. [DOI] [PubMed] [Google Scholar]
- 11.Wang SM, Lin CC, Li TL, Shih CY, Giang YS, Liu RH. Anal. Chim. Acta. 2006;576:140–146. doi: 10.1016/j.aca.2006.01.007. [DOI] [PubMed] [Google Scholar]
- 12.Ago M, Ago K, Hara K, Kashimura S, Ogata M. Leg. Med. (Tokyo) 2006;8:235–239. doi: 10.1016/j.legalmed.2006.03.002. [DOI] [PubMed] [Google Scholar]
- 13.Berankova K, Habrdova V, Balikova M, Strejc P. Forensic Sci. Int. 2005;153:93–97. doi: 10.1016/j.forsciint.2005.04.037. [DOI] [PubMed] [Google Scholar]
- 14.Garcia-Bournissen F, Rokach B, Karaskov T, Koren G. Arch. Dis. Child Fetal Neonatal Ed. 2007;92:F351–F355. doi: 10.1136/adc.2006.100156. [DOI] [PMC free article] [PubMed] [Google Scholar]
- 15.Nakahara Y, Shimamine M, Takahashi K. J. Anal. Toxicol. 1992;16:253–257. doi: 10.1093/jat/16.4.253. [DOI] [PubMed] [Google Scholar]
- 16.Lin DL, Yin RM, Liu HC, Wang CY, Liu RH. J. Anal. Toxicol. 2004;28:411–417. doi: 10.1093/jat/28.6.411. [DOI] [PubMed] [Google Scholar]
- 17.Society of Hair Testing. Forensic Sci. Int. 2004;145:83–84. doi: 10.1016/j.forsciint.2004.04.022. [DOI] [PubMed] [Google Scholar]
- 18.Han E, Yang W, Lee J, Park Y, Kim E, Lim M, et al. Forensic Sci. Int. 2005;147:21–24. doi: 10.1016/j.forsciint.2004.03.035. [DOI] [PubMed] [Google Scholar]
- 19.Wang WL, Cone EJ. Forensic Sci. Int. 1995;70:39–51. doi: 10.1016/0379-0738(94)01616-d. [DOI] [PubMed] [Google Scholar]
- 20.Cone EJ. Ther. Drug Monit. 1996;18:438–443. doi: 10.1097/00007691-199608000-00022. [DOI] [PubMed] [Google Scholar]
- 21.Henderson GL, Harkey MR, Zhou C, Jones RT, Jacob P. J. Anal. Toxicol. 1996;20:1–12. doi: 10.1093/jat/20.1.1. [DOI] [PubMed] [Google Scholar]
- 22.Stout PR, Ropero-Miller JD, Baylor MR, Mitchell JM. J. Anal. Toxicol. 2006;30:490–500. doi: 10.1093/jat/30.8.490. [DOI] [PubMed] [Google Scholar]
- 23.Nishida K, Itoh S, Inoue N, Kudo K, Ikeda N. J. Anal. Toxicol. 2006;30:232–237. doi: 10.1093/jat/30.4.232. [DOI] [PubMed] [Google Scholar]
- 24.Cairns T, Hill V, Schaffer M, Thistle W. Forensic Sci. Int. 2004;145:137–142. doi: 10.1016/j.forsciint.2004.04.028. [DOI] [PubMed] [Google Scholar]
- 25.Han E, Park Y, Yang W, Lee J, Lee S, Kim E, et al. Forensic Sci. Int. 2006;16:124–129. doi: 10.1016/j.forsciint.2006.03.031. [DOI] [PubMed] [Google Scholar]
- 26.Nakahara Y, Kikura R, Takahashi K, Konuma K. In: Advances in Chemical Diagnosis and Treatment of Metabolic Disorders. Matsumoto I, editor. Boca Raton: CRC Press; 1994. pp. 187–199. [Google Scholar]
- 27.Kronstrand R, Andersson MC, Ahlner J, Larson G. J. Anal. Toxicol. 2001;26:594–601. doi: 10.1093/jat/25.7.594. [DOI] [PubMed] [Google Scholar]
- 28.Kronstrand R, Ahlner J, Dizdar N, Larson G. J. Anal. Toxicol. 2003;27:135–141. doi: 10.1093/jat/27.3.135. [DOI] [PubMed] [Google Scholar]
- 29.Han E, Paulus MP, Wittmann M, Chung H, Song JM. J. Chromatogr. B Analyt. Technol. Biomed. Life Sci. 2011;879:541–547. doi: 10.1016/j.jchromb.2011.01.002. [DOI] [PubMed] [Google Scholar]
- 30.Nakahara Y, Kikura R, Takahashi K. Life Sci. 1998;63:883–893. doi: 10.1016/s0024-3205(98)00345-2. [DOI] [PubMed] [Google Scholar]
- 31.Nakahara Y, Kikura R. Arch. Toxicol. 1996;70:841–849. doi: 10.1007/s002040050348. [DOI] [PubMed] [Google Scholar]
- 32.Nakahara Y, Takahashi K, Shimamine M, Takeda Y. J. Forensic Sci. 1991;36:70–78. [PubMed] [Google Scholar]
- 33.Stout PR, Claffey DJ, Ruth JA. Drug. Metab. Dispos. 2000;28:286–291. [PubMed] [Google Scholar]
- 34.Potsch L, Emmerich P, Skopp G. Int. J. Legal Med. 2002;116:12–16. doi: 10.1007/s004140100243. [DOI] [PubMed] [Google Scholar]
- 35.Potsch L, Emmerich P, Skopp G. Int J Legal Med. 2002;116:58–61. doi: 10.1007/s004140100242. [DOI] [PubMed] [Google Scholar]
- 36.Rollins DE, Wilkins DG, Krueger GG, Augsburger MP, Mizuno A, O'Neal C, et al. J. Anal. Toxicol. 2003;27:545–551. doi: 10.1093/jat/27.8.545. [DOI] [PubMed] [Google Scholar]
- 37.Scheidweiler KB, Cone EJ, Moolchan ET, Huestis MA. J. Pharmacol. Exp. Ther. 2005;313:909–915. doi: 10.1124/jpet.104.082388. [DOI] [PubMed] [Google Scholar]
- 38.Testorf MF, Kronstrand R, Svensson SP, Lundstrom I, Ahlner J. Anal. Biochem. 2001;298:259–264. doi: 10.1006/abio.2001.5364. [DOI] [PubMed] [Google Scholar]
- 39.Gautam L, Scott KS, Cole MD. J. Anal. Toxicol. 2005;29:339–344. doi: 10.1093/jat/29.5.339. [DOI] [PubMed] [Google Scholar]
- 40.Claffey DJ, Stout PR, Ruth JA. J. Anal. Toxicol. 2001;25:607–611. doi: 10.1093/jat/25.7.607. [DOI] [PubMed] [Google Scholar]
- 41.Claffey DJ, Ruth JA. Chem. Res. Toxicol. 2001;14:1339–1344. doi: 10.1021/tx0155303. [DOI] [PubMed] [Google Scholar]
- 42.Tanaka M, Ono C, Yamada M. J. Pharm. Pharmacol. 2004;56:463–469. doi: 10.1211/0022357023141. [DOI] [PubMed] [Google Scholar]
- 43.Borges CR, Wilkins DG, Rollins DE. J. Anal. Toxicol. 2001;25:221–227. doi: 10.1093/jat/25.4.221. [DOI] [PubMed] [Google Scholar]
- 44.Borges CR, Martin SD, Meyer LJ, Wilkins DG, Rollins DE. J. Pharm. Sci. 2002;91:1523–1535. doi: 10.1002/jps.10144. [DOI] [PubMed] [Google Scholar]
- 45.Appenzeller BM, Schuman M, Yegles M, Wennig R. Alcohol Alcohol. 2007;42:326–327. doi: 10.1093/alcalc/agm016. [DOI] [PubMed] [Google Scholar]
- 46.Morini L, Politi L, Polettini A. Addiction. 2009;104:915–920. doi: 10.1111/j.1360-0443.2009.02535.x. [DOI] [PubMed] [Google Scholar]
- 47.Politi L, Leone F, Morini L, Polettini A. Anal. Biochem. 2007;368:1–16. doi: 10.1016/j.ab.2007.05.003. [DOI] [PubMed] [Google Scholar]
- 48.Kulaga V, Velazquez-Armenta Y, Aleksa K, Vergee Z, Koren G. Alcohol Alcohol. 2009;44:287–292. doi: 10.1093/alcalc/agn114. [DOI] [PubMed] [Google Scholar]
- 49.Martins LF, Yegles M, Thieme D, Wennig R. Forensic Sci. Int. 2008;176:38–41. doi: 10.1016/j.forsciint.2007.06.023. [DOI] [PubMed] [Google Scholar]
- 50.Park HY, Lee J, Gonzalez S, Middelkamp-Hup MA, Kapasi S, Peterson S, et al. J. Invest. Dermatol. 2004;122:159–166. doi: 10.1046/j.0022-202X.2003.22134.x. [DOI] [PubMed] [Google Scholar]
Associated Data
This section collects any data citations, data availability statements, or supplementary materials included in this article.