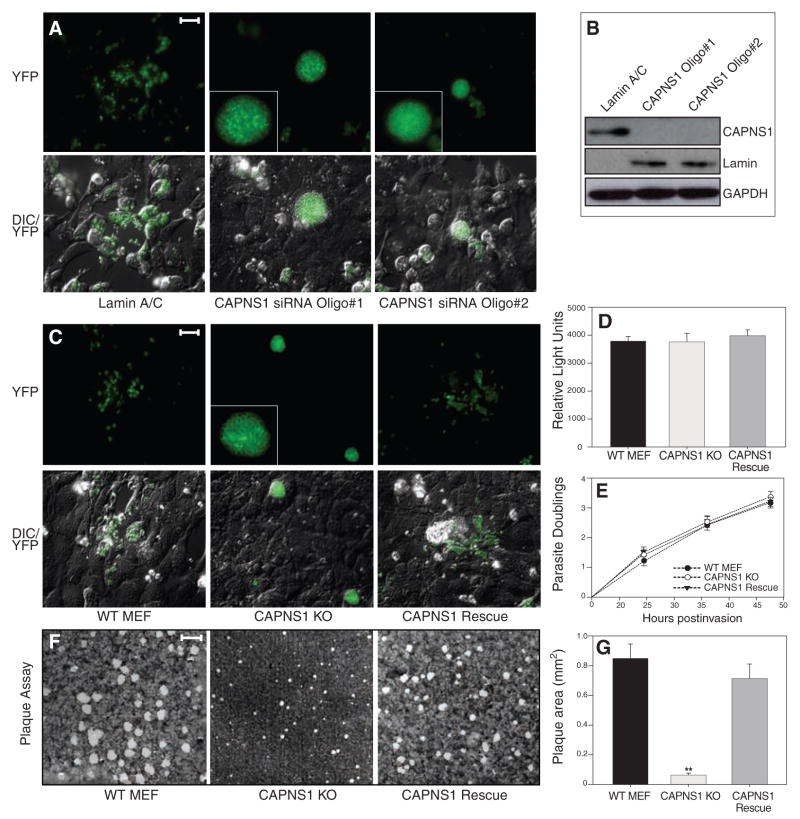
Fig. 3.
Host calpain facilitates the egress of T. gondii. (A) U2OS cells were transfected with siRNAs targeting either the common calpain regulatory subunit CAPNS1 (two different siRNAs) or lamin A/C, infected 24 hours post-transfection with T. gondii parasites expressing yellow fluorescent protein (YFP), and examined by fluorescence microscopy 56 hours later. Parasites ruptured out of most infected cells in controls, but not the knockdown cultures, where infected cells were grossly swollen with intracellular parasites. Insets show enlarged images of parasite-containing vacuoles. Scale bar, 30 μm. (B) Suppression of CAPNS1 protein levels was assessed in uninfected cells 72 hours post transfection using antibodies to CAPNS1, lamin A/C, and glyceraldehyde phosphate dehydrogenase (GAPDH). (C) YFP parasites were used to follow replication and egress in CAPNS1 KO host cells. By 56 hours postinfection, parasites had ruptured out of most cells in the WT and CAPNS1 rescue cultures, whereas CAPNS1 KO cells were heavily infected but unlysed. Scale bar, 30 μm. (D) To follow infection, cells were inoculated with luciferase-expressing transgenic parasites, producing comparable numbers of intracellular tachyzoites 4 hours postinfection. (E) To assay intracellular replication, host cell monolayers were infected with parasites, and parasitophorous vacuoles were scored every 12 hours for the number of parasites per vacuole, demonstrating comparable growth rates throughout the intracellular growth cycle (represented as log2 parasite count). (F) Confluent fibroblast monolayers were infected with T. gondii tachyzoites, and plaques were stained with crystal violet at 7 days, demonstrating comparable rates of infection but very small plaques in the CAPNS1 KO cultures, as a consequence of the egress defect in this mutant host cell line. Scale bar, 2 mm. (G) Quantitation of plaque size revealed a substantial decrease in the CAPNS1 KOs versus WT and CAPNS1 rescued cells (average radius of 20 randomly selected plaques per sample ± SE). Asterisks indicate the statistical significance using a Student’s two-tailed t test comparing CAPNS1 KO to WT, which yielded a P value of 1.91 × 10⁻⁷.

