Abstract
We show that simply designed amphiphilic 4-helix bundle peptides can be utilized to vectorially-orient a linearly-extended Donor-bridge-Acceptor (D-br-A) electron transfer (ET) chromophore within its core. The bundle’s interior is shown to provide a unique solvation environment for the D-br-A assembly not accessible in conventional solvents, and thereby control the magnitudes of both light-induced ET and thermal charge recombination rate constants. The amphiphilicity of the bundle’s exterior was employed to vectorially-orient the peptide-chromophore complex at a liquid-gas interface, and its ends tailored for subsequent covalent attachment to an inorganic surface, via a “directed assembly” approach. Structural data, combined with evaluation of the excited state dynamics exhibited by these peptide-chromophore complexes, demonstrates that densely-packed, acentrically ordered 2-D monolayer ensembles of such complexes at high in-plane chromophore densities approaching 1/200Å2 offer unique potential as active layers in binary heterojucntion photovoltaic devices.
1. Introduction
Covalently linked Donor-bridge-Acceptor (D-br-A) assemblies have been designed to exhibit efficient light-induced electron transfer “through bonds” over nano-scale distances to achieve long-lifetime charge-separated states.1–13 Such D-br-A chromophores thereby offer considerable potential as the active layer in bilayer heterojunction devices for organic photovoltaic (OPV) applications.14–20 However, in order for such structures to realize their full potential, they must be vectorially oriented throughout a 2-D ensemble positioned between planar electrodes with a comparable nano-scale separation.
We have shown that robust, amphiphilic 4-helix bundle peptides can be designed to bind linearly-extended chromophores containing a metal-porphyrin with high specificity to thereby vectorially-orient the chromophore within the core of the bundle.21–23 The amphiphilic exterior of the bundle can then be utilized to form ordered 2-D ensembles of the peptide-chromophore complex at an interface between polar and non-polar media, the designed amphiphilicity directing the acentric ordering of the complex at the interface. The designed chemical reactivity of the end(s) of the bundle can subsequently be utilized for attaching the acentrically ordered 2-D ensemble to planar inorganic (conductor, semi-conductor) surfaces. The utility of this “directed-assembly” approach was demonstrated using a dipolar chromophore possessing a large optical hyperpolarizability, since the macroscopic nonlinear optical (NLO) response of the 2-D ensemble is exquisitely sensitive to the degree of acentric order achieved.24, 25
Here, we utilize amphiphilic 4-helix bundle peptides to bind, orient, and assemble a D-br- A chromophore, PZnPI (N-[5-(10,20-diphenyl porphinato)zinc(II)]-N′-(octyl)pyromellitic diimide), that features a pyromellitimide (PI) acceptor directly linked to the (porphinato)zinc(II) (PZn) chromophore meso-carbon, at an interface.13 Two amphiphilic 4-helix bundle peptides of minimal length were utilized, that differed only in the particular end of the bundle possessing the inorganic surface-reactive residue, to thereby control the orientation of the electron transfer (ET) vector with respect to the surface normal, as shown by the electron density profiles of the monolayer ensembles derived from x-ray reflectivity/interferometry data. Time-resolved transient absorption spectroscopic experiments demonstrate that incorporation of the PZnPI chromophore into the core of the bundle accelerates light-induced charge separation and substantially extends the lifetime of the charge-separated state relative to that evinced previously in organic solvents.13 This work demonstrates that these 4-helix bundle peptides not only provide the required structure to enable formation of acentric 2-D ensembles of D-br-A chromophores at high in-plane densities, but also afford a means to engineer chromophore-localized solvation environments while protecting sensitive, organic-based photo-active elements in an insulating sheath.
2. Experimental Section
2.1. Peptide Design
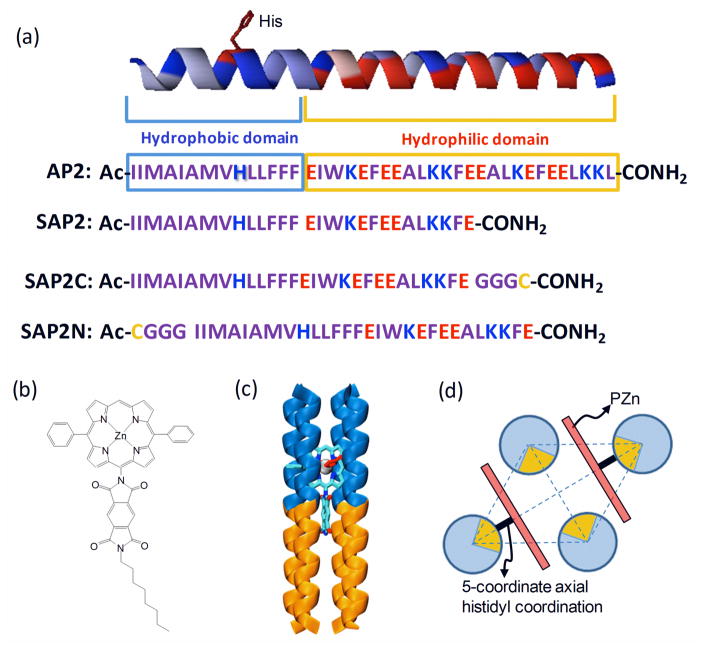
The simple graphical “heptad-based” design of the helices within the prototypical amphiphilic 4-helix bundle peptides AP0 and AP2 has been described previously.21, 26 It employs 3.5 residues/turn to yield 7 residues (one heptad)/2-turns of the helix, instead of the 3.6 residues/turn typical of an ideal, straight α-helix. The peptides employed herein differ from full-length AP2 only in that their hydrophilic domains are shortened by one heptad (7-residues) to result in SAP2 (i.e., short AP2). Additionally, a Gly-Gly-Gly-Cys sequence was added to either the C-terminus or the N-terminus, designated as SAP2C and SAP2N, respectively, to permit homo-dimerization resulting in di-helices covalently linked via a disulfide at the end of either the hydrophilic domain (SAP2C) or the hydrophobic domain (SAP2N). Note that the SAP2 peptide, lacking a cysteine, cannot be dimerized. The primary sequences of these peptides are shown in Scheme 1a.
Scheme 1.
(a) Amino acid sequences (one-letter symbol) for AP2, SAP2, SAP2C and SAP2N. (b) Chemical structure of the PZnPI chromophore. (c) Schematic illustration of the SAP2-PZnPI complex (the blue and yellow regions represent the hydrophobic and hydrophilic domains, respectively). (d) Schematic illustration of a rhombic arrangement of the four helices in the plane perpendicular to the bundle axis with resulting chromophore/4-helix bundle mole ratio of 2:1.
2.2. Peptide Synthesis and Purification
The peptides described in Scheme 1a were synthesized on a Liberty-12-channel automated solid-phase peptide synthesizer (CEM Co., Matthews, NC, USA) using standard Fmoc/tBu protection strategy on a Fmoc-PEG-PAL-PS resin (Applied Biosystems, Carlsbad, CA, USA) at 0.1 mmol scale. After peptide formation, the peptides were acetylated at their N-terminus (1:1 (v/v) acetic anhydride: pyridine for 20 min) followed by thorough washing with dimethylformamide (DMF) and CH2Cl2 (solvents from Fisher Scientific, Pittsburg, PA, USA). Each peptide was cleaved from the resin and simultaneously deprotected using 90:8:2 (v/v/v) trifluoroacetic acid (TFA)/ethanedithiol/water for 2 h followed by thorough washing with TFA (Sigma, St. Louis, MO, USA). TFA was then evaporated on a rotary evaporator (ROTAVAPOR® R-200, BUCHI Co., New Castle, DE, USA). Crude peptides were precipitated and washed with tert-butyl methyl ether (Sigma-Aldrich, St. Louis, MO, USA), followed by dissolution in water (0.1% v/v TFA), lyophilization, and purification on a reversed phase C4 high-performance liquid chromatography (HPLC) column (VYDAC® Grace, Deerfield, IL, USA) using gradients of 6:3:1 (v:v:v) 2-propanol/acetonitrile/H2O (solvents from Fisher Scientific, Pittsburg, PA, USA) containing 0.1% (v/v) TFA and water containing 0.1% (v/v) TFA. The purity and molecular weight of the acetylated peptides were confirmed by matrix-assisted laser desorption/ionization mass spectrometry (MALDI-MS, Applied Biosystems, Carlsbad, CA, USA) using α-cyano-r-hydroxycinnamic acid as a matrix. The peptides were lyophilized and stored in a freezer. We also dimerized pure peptides (SAP2C and SAP2N) as necessary by resolubilizing them in a basic buffer solution (pH 8.5) to form the disulfide-linked peptide dihelical units (composition confirmed by analytical C4 HPLC).
2.3. Materials
N-[5-(10,20-Diphenylporphinato)zinc(II)]-N′-(octyl)pyromellitic diimide (PZnPI) was synthesized as described previously.27 The molecular structure of PZnPI, and a schematic representation of SAP2 peptide and SAP2-PZnPI peptide-chromophore complex are shown in Scheme 1b and c, respectively. The detergent n-octyl-β-D-glucopyranoside (OG) was purchased from Anatrace (Maumee, OH, USA). 3-Aminopropyldimethylethoxysilane was bought from Gelest Inc. (Morrisville, PA, USA) while the linker succinimidyl 4-(N-maleidomethyl) cyclohexane-1-carboxylate (SMCC) was obtained from Fisher Scientific (Springfield, NJ, USA). All other solvents and reagents were obtained from Fisher Scientific. All purchased chemicals were used without further purification. The fused silica slides (UV grade; 25 mm ×70 mm) were bought from Esco Products (Oak Ridge, NJ, USA) and the 3 in. diameter silicon wafers (n-type Si:P, 600 μm thick) were purchased from El-Cat Inc. (Waldwick, NJ, USA). In order to increase the sensitivity and spatial resolution of the x-ray reflectivity technique by employing the interferometric approach, Si-Ni-Si multilayers comprised of 50Å Si/20Å Ni/20Å Si were deposited via magnetron sputtering onto the silicon wafers. This fabrication was performed in the deposition laboratory at the Advanced Photon Source (APS) at Argonne National Laboratory (ANL) (Argonne, IL, USA).
2.4. Peptide Solubilization
Since the AP (Amphiphilic Peptide) family of peptides are water-insoluble, they require detergent (OG) for solubilization in aqueous buffers. We have found that all peptides used in this study could be solubilized in 2.2 % (w/v) OG, 50 mM potassium phosphate (KPi), pH 8.0 buffer. Peptide concentrations were determined spectroscopically by monitoring the tryptophan (W) absorption at 280 nm using an extinction coefficient of 5690 M−1 cm−1.
2.5. Chromophore Incorporation
A dimethyl sulfoxide (DMSO) (Aldrich) solution of the PZnPI chromophore was added to peptides in 2.2 % OG solutions. The final concentration of DMSO in the peptide solution was lower than 2.0 % (v/v). UV-visible spectroscopy for SAP2- PZnPI complexes were carried out in buffer solutions containing 2.2 % OG, 50 mM KPi at pH 8.0. A Lambda 650 UV-vis spectrometer (PerkinElmer, Waltham, MA) and a standard 1 cm path length quartz cuvette were used for absorbance measurements.
2.6. Langmuir Monolayer Preparation
Solutions of the apo-form (i.e., without a PZnPI chromophore) and holo-form (i.e., with a bound PZnPI chromophore) of the peptides, typically having a concentration of about 100 μM, were spread from 50 mM KPi Buffer (pH 8) with 2.2 % OG to form Langmuir monolayers on the aqueous subphase (1 mM KPi at pH 8.0) in Langmuir troughs manufactured by either Riegler & Kirstein (Potsdam, Germany) or Lauda, (Lauda- Koenigshofen, Germany), which were equipped with the Wilhelmy plate and the floating-barrier surface pressure transducer, respectively, for monitoring the surface pressure. The temperature of the subphase was maintained constant at 20 °C during the experiment. After waiting for about 15 min for the monolayer to equilibrate, we compressed at a rate of 20 Å2 per helix per minute by a motor-controlled barrier with feedback until the desired surface pressure was achieved. The pressure-area (π-A) isotherms were also recorded during the compression. Chromophore binding into peptide bundles at the air-water interface has been examined by using a portable UV-vis absorption spectrometer, which has been specially designed for measuring absorbance of Langmuir monolayers by six passes through the Langmuir monolayer. The detailed description of the instrumentation and data collection has been described in an earlier publication.28
2.7. X-ray Reflectivity from Langmuir Monolayers at the Liquid-Gas Interface
The x-ray reflectivity (XR) measurements on the Langmuir monolayers were performed at the liquid surface scattering instrument on the undulator beamline at sector 9 of Advanced Photon Source (APS) at Argonne National Laboratory (ANL) (Argonne, IL, USA). The Langmuir trough, enclosed within a gas-tight canister, was flushed with humid He gas, as monitored by an oxygen sensor in the canister (S101, QUBIT Systems, Kingston, ON, Canada), in order to reduce the xray background scattering arising from air and also to minimize subphase evaporation. A large Kapton window permitted the incident and scattered x-ray beams to penetrate the canister. A Bicron scintillation detector measured the scattered beam intensity, while a He-filled ion chamber before the sample measured the incident beam intensity. A flat smooth glass block was also placed in the trough and submerged slightly below the water surface to damp long-wavelength excitations in the local height of the water surface. X-ray reflectivity data at the air-water interface were collected over a range of photon momentum transfer 0.01 Å−1 < qz < 0.60 Å−1 at constant surface pressures or constant areas (for π > 30 mN/m). At higher surface pressures, we relied on the area/α-helix instead of surface pressure because the Wilhelmy-plate utilized for the latter did not penetrate through the monolayer vertically, typical of more solid-like monolayers. During the measurement, we kept the spectrometer in the specular reflectivity condition, α=β, where α and β are the angles that incident and reflected beams, respectively, make with the liquid surface, so as to collect the photons scattered with momentum transfer perpendicular to the liquid surface (qz=(4π sinα)/λ). We collected data with the detector in the plane of the reflection (2θxy=0°), and the background with the detector on either side of the plane (2θxy=0.3°) over the full range of qz, and subtract the latter from the former to provide the specular x-ray reflectivity data. Data reduction including normalization of the specular reflectivity data by the Fresnel function was performed on Silicon Graphics workstations using the program C-Plot (Certified Scientific Software, Cambridge, MA). The Fresnel-normalized specular reflectivity data were analyzed by the so-called “box-refinement” method, which requires no a-priori assumptions and is therefore model-independent,29 to solve the classical “phase problem” and thereby provide directly the monolayer electron density profiles.
2.8. Interferometric Approach for X-ray Reflectivity from Langmuir Monolayers
The x-ray reflectivity measurement on the apo-SAP2C Langmuir monolayer employing an interferometric approach was also performed using the same liquid surface spectrometer at the APS. The details of interferometric x-ray reflectivity data collection and analysis have been explained in an earlier publication.30 Interference between the strong specular reflectivity from the Si-Ni-Si multilayer reference structure with the much weaker specular reflectivity from the Langmuir monolayer enhances both the sensitivity and spatial resolution of the monolayer electron density profiles derived from the x-ray reflectivity data. For SAP2C peptide, however, we used the Si wafer (76mm × 38mm) possessing multilayer structure on its upper surface, and also alkylated with 3-aminopropyldimethylethoxysilane and the SMCC linker to facilitate the covalent attachment between the SMCC linker and the cysteine residue at the lower end of the peptide bundle’s hydrophilic domain. The details of experimental procedure for the silane/linker deposition have been described previously.24 The alkylated substrate was initially buried deeply in the subphase. The Langmuir monolayer of SAP2C peptide was formed at water-air interface as described in the previous section and compressed. Subsequently, the wafer was slowly raised, ultimately coming into juxtaposition with the compressed Langmuir monolayer by using a NTS10 NanoDirect nanopositioner (DTI-NanoTech, Sarasota, FL, USA).
2.9. Langmuir-Schaefer Deposition of Langmuir Monolayers on Solid Substrates
For interferometric x-ray reflectivity measurement for the covalently attached monolayers of the apo and holo forms at the silicon oxide-helium interface, we used a triple-axis diffractometer with an Enraf-Nonius F-591 rotating-anode x-ray source and a scintillation detector. The silicon wafers with multilayer structure were cut into pieces of 20 mm × 10 mm dimension suitable for this x-ray experiment and alkylated with the silane and linker as described in the previous section. The Langmuir monolayer of the apo-form of the SAP2N or SAP2C peptide spread at the water-air interface was compressed to a surface area of 100 Å2 per α-helix, using the Lauda trough, and subsequently covalently attached onto the previously treated silicon wafer by Langmuir-Schaefer deposition (i.e., with the plane of the substrate’s surface parallel to the plane of the Langmuir monolayer) from either above the monolayer (designated LSa) or from below the monolayer (designated LSb) for the SAP2N or SAP2C peptide, respectively. After deposition, the substrates with the attached peptide monolayer were washed several times with 2.2 % OG solution in order to remove nonspecifically adsorbed peptide molecules. After x-ray reflectivity measurement of this apo monolayer on the substrates, the substrates were then incubated with 30 μM PZnPI solution (in 2.2 % OG pH 8.0 KPi buffer) at 4 °C overnight to achieve axial histidyl ligation of PZnPI chromophore into the bundles of SAP2C and SAP2N peptides. After incubation, the substrates were once again washed several times with 2.2 % OG solution in order to remove nonspecifically adsorbed PZnPI molecules. In addition, covalently attached single monolayers of both the apo- and holo-forms of the two peptides on fused silica were also prepared in parallel with monolayer deposition on the multilayer substrates. Linear UV-vis absorption spectroscopic data were collected at room temperature from monolayer films on fused silica slides in order to confirm the chromophore binding into peptide bundles.
2.10 Pump-Probe Transient Absorption Spectroscopic Studies of SAP2N-PZnPI in Detergent Solution
Ultrafast transient absorption spectra were obtained using standard pumpprobe methods. Optical pulses (≥ 120 fs) centered at 780 nm, were generated using a Ti:Sapphire laser (Clark-MXR, CPA-2001, Dexter, MI, USA), which consisted of a regenerative amplifier seeded by a mode-locked fiber oscillator. A homebuilt near-IR (NIR) optical parametric amplifier generates excitation pulses tunable in wavelength from the UV through the NIR region. The pump beam was chopped at half the laser repetition rate (~500 Hz). A fraction (<5%) of the output from the regenerative amplifier was passed through an optical delay line, and focused onto a 2 mm c-cut sapphire plate to generate a white light continuum, which was used as the probe beam. The polarization and attenuation of the pump and probe beams were controlled by a half-wave plate and Rochon prism polarizer pairs. The polarization was set to the magic angle (54.7 °) for these experiments. The pump beam was focused into the sample cell with an f = 20 cm lens, while the probe beam was focused with a concave mirror. The spot size diameter was 0.3 mm. After passing through the sample, the probe light was adjusted using a neutral density filter to avoid saturating the detectors, and focused onto the entrance slit of the computer-controlled image spectrometer (Acton Research Corporation, SpectraPro-150, Trenton, NJ, USA). A CCD array detector (Roper Scientific, 1024 × 128 elements), interfaced to the spectrometer, recorded the spectrum of the probe light from the UV (~370 nm) to the NIR (~1100 nm), providing spectral resolution better than 0.5 nm. Pairs of consecutive spectra were measured with (Ion(λ)) and (Ioff(λ)) to determine the difference spectrum, ΔA = log(Ioff(λ))/(Ion(λ)). Transient absorption data acquired over 0.9–1.4 μm NIR region were recorded using a liquid nitrogen cooled InGaAs 512-element linear array detector (Roper Scientific, Trenton, NJ, USA) interfaced to a SpectraPro-2150 spectrometer. All these experiments utilized a 2 mm12 path-length fused-silica sample cell; all transient optical studies were carried out at 20 ± 1 °C. All transient spectra reported represent averages obtained over 5 scans, with each scan consisting of ~100–200 data points.
In these experiments, the delay line utilizes a computer-controlled delay stage. Delay times up to 6 ns were achieved using a Compumotor-6000 (Parker, Rohnert Park, CA, USA). The baseline noise level in these transient absorption experiments corresponded to ~ 0.2 mOD per second of signal accumulation. The time resolution is probe wavelength dependent; in these experiments, the FWHM of the instrument response function (IRF) varied between 140–200 fs (e.g., at 680 nm, the IRF was 150 ± 6 fs). Following all pump-probe transient absorption experiments, electronic absorption spectra verified that peptide-bound PZnPI was robust.
3. Results and Discussion
3.1. PZnPI Incorporation into SAP2C & SAP2N Peptides
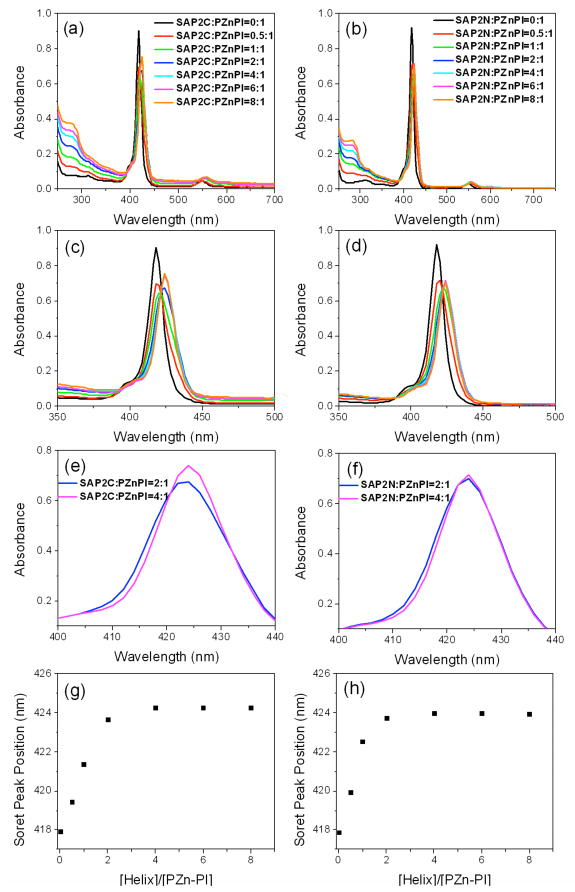
We investigated whether the histidine residue in the α-helix of the two peptides binds the (porphinato)zinc component in PZnPI via axial histidyl coordination, using UV-vis absorption spectroscopy. Titration experiments were performed by adding the dihelical peptides of SAP2C or SAP2N (see Figure 1) dissolved in a aqueous buffer solution (50 mM KPi at pH=8.0) containing 2.2 % of the detergent OG into the PZnPI in 50 mM KPi buffer solution with 2.2 % OG. The PZnPI absorption spectrum shows the characteristic features of this chromophore,31, 32 displaying Soret and Q-bands centered respectively at 418 and 549 nm. Upon adding the SAP2C peptide into the PZnPI solution, the Soret and Q-band absorption maxima were red-shifted from 418 to 424 nm, and from 549 to 556 nm, respectively, indicative of binding the Zn-porphyrin component of the chromophore to the peptide bundles via axial-histidyl coordination of the zinc atom. This was not the case at other lower detergent concentrations, most likely due to aggregation of the chromophore, as evidenced by a broadening of the chromophore’s absorption bands when solubilized in detergent at these lower concentrations in the absence of the peptide. The titration shows a gradual increase in spectral shift toward the red with added peptide saturating at a 2:1 peptide helix/PZnPI mole ratio, after which there was no further detectable shift for both Soret and Q-bands. Similar spectral changes were also obtained for SAP2N-PZnPI complexes. The peptide in the monomeric state (i.e., undimerized helices) also exhibited the same PZnPI chromophore binding properties on this spectroscopic basis. The prototype AP2 peptide was designed to form 4-helix bundles and shown to bind up to two metal-porphyrin chromophores per bundle with high specificity.21 The α-helices forming the hydrophilic domain of AP2 are three heptads long and their amphipathicity is solely responsible for driving bundle formation. 4-helix bundle formation was demonstrated for the apo-form (without bound chromophores) via grazing-incidence x-ray diffraction (GIXD) from Langmir monolayers of the peptide at higher surface pressures. However, the GIXD data for this full-length AP2 was substantially weaker than for another prototypical amphiphilic 4-helix bundle peptide AP0, in which the α-helices forming the hydrophilic domain are comprised of four heptads, namely one heptad longer.21 Although the peptides utilized in this work, SAP2C & SAP2N, were based on AP2, the helices forming their hydrophilic domain were even shorter, comprised of only two heptads. Thus, it may not be surprising that GIXD was not observable from Langmuir monolayers of these shorter peptides even at higher surface pressures, where the helices are oriented perpendicular to the air-water interface (see section 3.2), for both apo- and holo-forms. As a result, we can only assume that the observed saturation of PZnPI chromophore binding upon increasing the chromophore/helix mole ratio from 1:4 to 1:2 relates to one versus two chromophores per 4-helix bundle, respectively. Support for this assumption is provided by closer inspection of the chromophore’s Soret absorption, which slightly broadens to result in a small blue-shift characteristic of a H-type (face-to-face) excitonic interaction upon increasing the chromophore/helix mole ration from 1:4 to 1:2.33, 34 The cartoon in Scheme 1d shows how the two, five-coordinate Zn-porphyrin moieties of the chromophore could be accommodated within the core of a close-packed rhombic 4-helix bundle structure to satisfy the spectroscopic data. Note that while an obvious alternative of one chromophore per 2-helix bundle could account for the absence of detectable GIXD (based on model calculations shown in the supporting information24) for PZnPI chromophore/helix mole ratios from 1:4 to 1:2, it could not account for the spectroscopic data described above.
Figure 1.
Titration of SAP2C (a) and SAP2N (b) with a 3μM solution of PZnPI in 50 mM KPi buffer with 2.2 wt% OG at pH 8 and 20°C. The spectra were recorded in a 1cm path length cuvette, containing 0, 0.5, 1, 2, 4, 6, 8 equiv added peptide monomer per chromophore. Expanded UV-vis absorption spectral views (Soret region, 350–500 nm) for SAP2C-PZnPI (c) and SAP2N-PZnPI (d) complexes. Further expanded UV-vis absorption spectral views (Soret region, 400–450 nm) for SAP2C-PZnPI (e) and SAP2N-PZnPI (f) complexes at chromophore/peptide helix mole ratios of 1:2 and 1:4. Soret peak positions determined by Gaussian fitting vs [SAP2C helix]/[PZnPI] mole ratio for SAP2C-PZnPI (g) and SAP2N-PZnPI (h) complexes.
3.2. Pressure-Area Isotherms for Langmuir Monolayers of apo- & holo-SAP2 Peptides at the Liquid-Gas Interface
Due to the overall amphiphilic nature of the 4-helix bundle peptides, they are capable of vectorial insertion across a soft interface between polar and nonpolar media. Surface pressure-area (π-A) isotherms can provide some insight into the orientation of the helices with respect to the plane of the interface. The isotherms recorded upon compression for the apo- and holo-forms of the SAP2 peptide monolayers are shown in Figure 2. The surface pressure for apo-peptide monolayer increases rapidly over the 5–10 mN/m range, corresponding to an average area per helix of 400–450 Å2. This is reasonably consistent with the expected dimension of the ~42 Å length of the SAP2 α-helix (i.e., 28 residues at 1.5 Å/residue) with a diameter of ~10 Å, suggesting that helices are tightly packed, all lying in the plane of the interface at these lower surface pressures. Upon further compression approaching a maximal pressure of 55–60 mN/m, the average area per helix approaches ~100 Å2/helix, namely approximately the cross sectional area of an α-helix, suggesting that helices are again tightly packed, but now all with their long-axis perpendicular to the plane of the interface at these higher surface pressures, thereby resulting in a 2-D ensemble of vectorially oriented peptide bundles on a macroscopic scale. The isotherm for the holo-form of the SAP2 peptide with a chromophore/peptide helix mole ratio of 1:4 is similar to that of the apo-form but shifted slightly by about 40 Å2 toward larger area/helix over the entire isotherm before the inflection point at π = ~53 mN/m. This shift likely reflects the presence of the chromophores incorporated into the core of the peptide bundles via axial histidyl ligation. Porphyrin binding into peptide bundles in these Langmuir monolayers at the air-water interface has been examined by using a portable UV-vis absorption spectrometer.28 From the absorbance spectrum (See supporting information Figure S1), it was evident that the position of the Soret peak centered at 424 nm is identical to that for solution spectra (see Figure 1). This emphasizes that axial histidyl ligation of the Zn-porphyrins in the peptide bundles present in the holo solution was preserved even after spreading at the air-water interface and subsequent compression in the monolayer.
Figure 2.
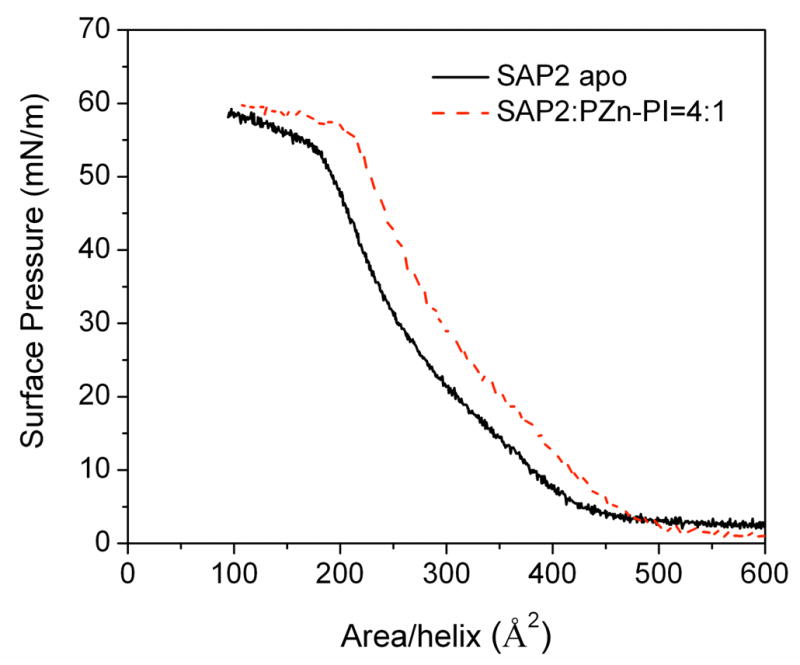
Surface pressure-area (π-A) isotherms recorded for SAP2 in the apo-form (continuous) and with PZnPI at a chromophore/peptide helix mole ratio of 1:4 (dotted) spread from aqueous solution (50 mM phosphate buffer) with 2.2 wt% OG detergent on a subphase of 50 mM phosphate buffer at pH 8 and 20°C.
3.3. X-ray Reflectivity from Langmuir Monolayers of apo-SAP2 Peptides at the Liquid-Gas Interface
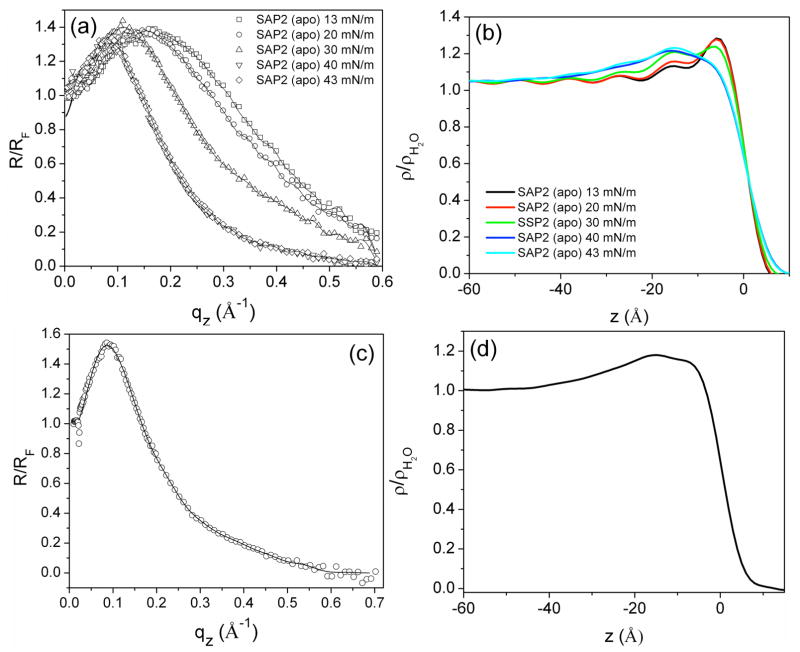
Fresnel-normalized x-ray reflectivity data, R(qz)/RF(qz), shown in Figure 3a were collected from Langmuir monolayers of the apo-SAP2 peptide in the monomeric (un-dimerized) state as a function of surface pressure. These data are typical of such amphiphilic peptide bundles, exhibiting a broad maximum at π=13 mN/m, which becomes progressively narrower and shifts to smaller momentum transfer, qz, with increasing surface pressure. The inverse Fourier transform of these data without phase information provides the autocorrelation of the gradient electron density profile of the Langmuir monolayer, indicating the maximal extent of the respective gradient profiles at each surface pressure. This maximal extent is employed as the key constraint for the box-refinement algorithm applied to the normalized reflectivity data to solve the phase problem and thereby obtain directly the gradient electron density profile for the monolayer, which subsequently provides the monolayer electron density profile itself via numerical integration of the gradient profile. The electron density profiles of the apo-peptide monolayer at the corresponding surface pressures are shown in Figure 3b. At the lowest pressure of 13 mN/m, a single relatively electron dense feature ~10 Å in width occurs at the interface, consistent with the cross-sectional dimension of an α-helix, indicating that all the helices in the monolayer lie with their long-axis parallel to the plane of the interface. With increasing surface pressures up to 40–43 mN/m, the excess electron density in the monolayer profiles extends progressively more deeply into the aqueous subphase, reaching a maximal extent of ~40Å. The normalized reflectivity from a Langmuir monolayer of the dimerized apo-SAP2C peptide was also collected at one of the higher surface pressures (40 mN/m), the data being qualitatively similar to that for the peptide in the monomeric (un-dimerized) state (Figure 3c and d). The electron density profile for the apo-SAP2C similarly extends over ~40 Å along the z-axis into the subphase, consistent with the expected length of the peptide helix (for the SAP2C, the 28- residue helix provides a length of 42 Å for an ideal straight α-helix with 1.5 Å/residue along the long axis), indicating that the long-axis of the helices becomes oriented perpendicular to the plane of the interface at these higher surface pressures. We note that the peptide-water interface at the end of the 2-heptad hydrophilic domain for these shorter SAP2, SAP2C & SAP2N peptides in such Langmuir monolayers at higher surface pressures is comparable to that for the longer AP2 peptide possessing a 3-heptad hydrophilic domain, but much less well defined than for the even longer AP0 peptides possessing a 4-heptad hydrophilic domain. Nevertheless, these above-mentioned results are fully consistent with the implications from the pressure-area isotherm data described in the previous section.
Figure 3.
Experimental Fresnel-normalized x-ray reflectivity data (open symbols) compared with that calculated for the monolayer electron density profiles (solid curves) derived from the boxrefinement analysis as a function of photon momentum transfer qz for Langmuir monolayers of the SAP2 (at various surface pressures) (a) and of the SAP2C (at the higher surface pressure extreme) (c) at the water-air interface. The derived electron density profiles are shown for Langmuir monolayers of the SAP2 (b) and SAP2C (d).
3.4. X-ray Interferometry from Langmuir Monolayers of apo-SAP2C Peptide at the Liquid-Gas Interface
In order to enhance the “sensitivity” (ability to distinguish features of slightly differing contrast across the interface) and “spatial resolution” (the minimum separation of distinct features along the length of the electron density profile perpendicular to the interface) of electron density profiles derived from x-ray reflectivity data from Langmuir monolayers of the SAP2 peptide bundles, a recently developed interferometric approach was utilized. This approach utilizes a juxtaposed, inorganic multilayer as a reference structure to produce an interference effect between the strong specular reflectivity from the inorganic multilayer and the much weaker specular reflectivity from the adjacent bio-organic Langmuir monolayer without any perturbation of the latter.30
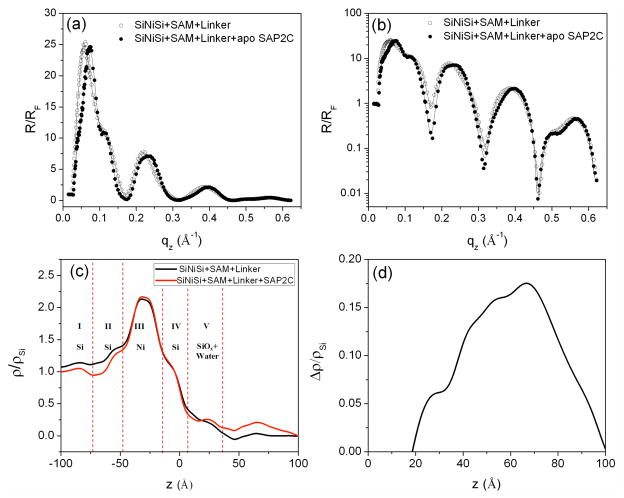
In this work, the Si-Ni-Si inorganic multilayer substrate’s surface was alkylated with 3- aminopropyldimethylethoxysilane, followed by deposition of the succinimidyl 4-(N-maleidomethyl) cyclohexane-1-carboxylate (SMCC) linker to facilitate the covalent attachment of the peptide monolayer to the surface of the substrate upon contact with the Langmuir monolayer of the SAP2C peptide. This alkylated substrate was immersed deeply in the subphase before spreading the Langmuir monolayer, having been precisely aligned parallel to the plane of the interface and characterized in helium gas by x-ray reflectivity prior to immersion in the subphase. After the x-ray reflectivity data collection from the compressed peptide monolayer at the gas-water interface (corresponding to Figure 3), the alkylated surface of the inorganic substrate was gently raised to the interface until juxtaposed with the vectorially oriented peptide monolayer. The substrate was then tilted by ~ 3° relative to the plane of the monolayer, but with the water meniscus remaining fully attached, to promote thinning of the intervening water layer between the Langmuir monolayer and the multilayer substrate. This allowed the covalent attachment of the Langmuir monolayer onto the alkylated surface of the inorganic multilayer substrate, the former remaining otherwise unperturbed at the water-helium interface based on the invariance of the measured surface pressure. Fresnel-normalized x-ray reflectivity data were then collected from the apo-SAP2C monolayer on the Si-Ni-Si substrate, following retilting the wafer back to the original alignment (i.e., precisely parallel to the water-helium interface). The results are shown in Figure 4a and b along with data for the alkylated Si-Ni-Si reference structure itself in helium gas, clearly demonstrating that the normalized reflectivity for the alkylated Si-Ni- Si substrate is significantly different from that with the covalently attached apo-SAP2C peptide monolayer over the range of momentum transfer, 0 Å−1 <qz<0.3 Å−1. Differences in the data for higher momentum transfer, qz, are more evident on a semilog scale, and directly provide the electron density profile for the multilayer-overlayer system via the box-refinement procedure, which here also utilizes the known profile structure of the reference multilayer (determined independently) as an additional constraint (see Figure 4c). Note that the electron density profile for the alkylated multilayer substrate itself in helium is used only as an initial constraint in the box-refinement of reflectivity data for the multilayer-overlayer system to thereby provide the electron density profile for the system nearest (i.e., most similar to) that of the multilayer substrate; as a result, the profile structure of the substrate within the multilayer-overlayer system can evolve somewhat from that initially as the refinement proceeds to convergence. The results reveal the significant difference in the electron density between the reference structure itself and that with the overlying peptide monolayer. Given the fabrication specifications employed for the Si-Ni-Si multilayer deposition, the electron density profile of the reference structure can be expected to be comprised of five regions (layers); region I (the underlying bulk Si wafer), region II (first deposited amorphous Si layer), region III (deposited amorphous Ni layer), region IV (second deposited amorphous Si layer), and region V (amorphous SiOx layer). This allows us to assign the different features of the electron density profile to these different layers, as shown in Figure 4c, consistent with the fabrication specifications and allowing for subsequent interlayer diffusion and oxidation of the surface. Note also that this Fourier representation, here of the reference multilayer structure itself, provided by the box-refinement phasing procedure contains the effects of Fourier transform truncation, both for qz < (qz)min ~ 0.032Å−1 corresponding to the critical-angle for total reflection and for qz > (qz)max ~ 0.625Å−1, resulting in the minimum wavelength Fourier component in the so-derived electron density profile thereby limiting the spatial resolution achieved. The former (qz)min truncation effect is more pronounced near the substrate’s surface due to the nearby high contrast Ni-layer resulting in a negative apparent electron density adjacent the surface (see Figure 4c & Figure 6c–d). This effect can be removed by subtraction of the profile for the multilayer substrate itself from that for the multilayer-overlayer system, as demonstrated previously48. Subtraction of the profile of this reference structure from that profile for the peptide monolayer on the same substrate’s surface thus correctly provides the electron density of the SAP2C monolayer itself occurring within the range of +35 Å (corresponding to the SiOx-peptide interface) to +82 Å (corresponding to the peptide-helium interface) (see Figure 4d). The full-width at half-maximum (fwhm) value of the features of the peptide monolayer over this region of the profile was found to be 43–45 Å, which is in good agreement with the expected length of the peptide helix, noting here that both the peptide-linker interface at z ~ 40 Å and the peptide-helium interface at z ~ 80 Å are well-defined. Also of relevance to the subsequent section, note that the overall asymmetry of the SAP2C peptide monolayer profile shown here (namely somewhat higher density in the hydrophobic domain for 60Å < z < 80Å relative to that in the hydrophilic domain for 40Å < z < 60Å) is consistent with that of SAP2C in a Langmuir monolayer in the absence of the adjacent multilayer substrate (Fig. 3d), the peptide having the same vectorial orientation in each case.
Figure 4.
Fresnel-normalized x-ray reflectivity data (circles) obtained via the interferometric approach for (i) a Si-Ni-Si multilayer reference structure with SAM and linker and (ii) the overlying SAP2C monolayer covalently attached to the surface of the Si-Ni-Si multilayer structure; (a) shows these data on a linear ordinate scale while (b) utilizes a corresponding log scale. (c) Corresponding electron density profiles derived for the multilayer substrate-peptide overlayer system. (d) Difference between the electron density profile for the Si-Ni-Si reference structure itself and with the SAP2C monolayer overlying the Si-Ni-Si structure [i.e., profile for SAP2C on Si-Ni-Si] minus that for [Si-Ni-Si].
Figure 6.
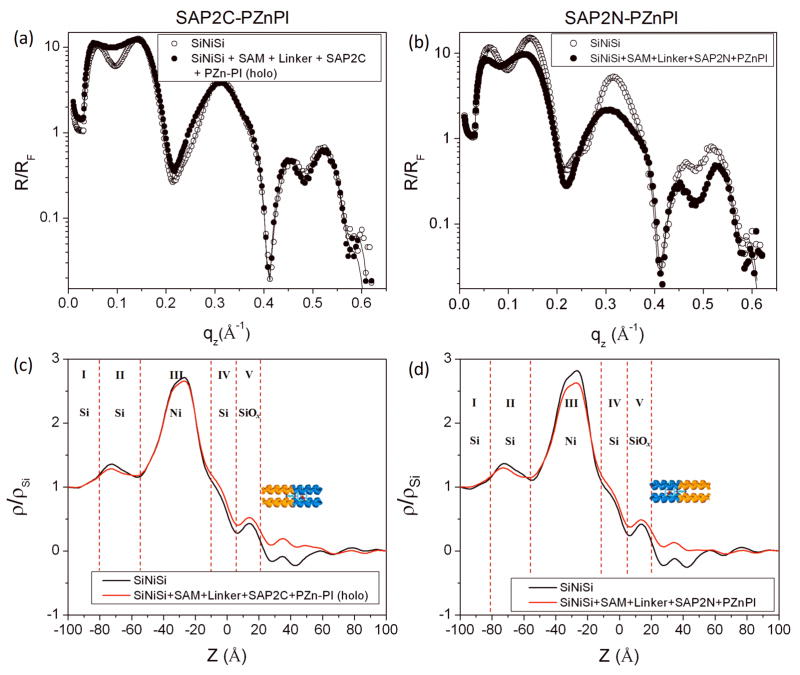
Fresnel-normalized x-ray reflectivity data (circles) and the best fits (solid curves) from the box-refinement analysis as a function of photon momentum transfer qz for (i) a Si-Ni-Si multilayer reference structure itself and (ii) (a) SAP2C and (b) SAP2N monolayers covalently attached to the surface of the Si-Ni-Si multilayer structure, followed by incubation in 30 μM solution of PZnPI solution in 2.2 wt% of OG overnight and subsequent rinsing. Corresponding electron density profiles for (i) the Si-Ni-Si multilayer reference structure and (ii) the PZnPI-bound holo- (c) SAP2C and (d) SAP2N monolayers, covalently attached to the surface of the respective alkylated Si-Ni-Si multilayer substrates.
3.5. UV-vis Absorption Spectra of SAP2N & SAP2C Peptide-Chromophore Complexes in Monolayers at the Solid-Gas Interface
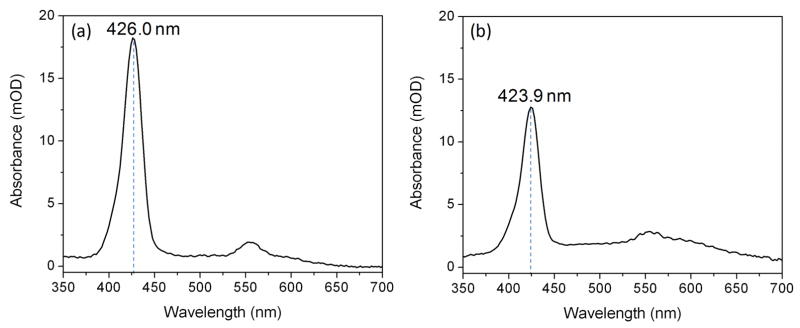
The apo SAP2C monolayer was covalently attached to the alkylated surface of the Si-Ni-Si & fused silica substrates by LSb deposition, while the apo SAP2N monolayer was covalently attached to the alkylated surface of the Si-Ni-Si & fused silica substrates by LSa deposition, these depositions performed at an area of 100 Å2 per α-helix. The linear UV-vis absorption spectra for the respective monolayers covalently attached onto the fused silica slides are shown in Figure 5, where the Soret maxima are centered at ~426 nm and 424 nm for the respective holo SAP2C and SAP2N peptides, consistent with the corresponding absorption maxima (424 nm) evident in detergent-solution. These results indicate that the PZnPI chromophores remain intercalated into the peptide bundles attached on the substrates, and strongly bound to the histidine residue positioned at a specific site along the length of the α-helix even after the multiple rinsing steps carried out with 2.2 wt% OG solution. The surface density of the chromophore bound in the monolayer was also calculated from the Soret peak absorbance, yielding 192 Å2 and 297 Å2 for the holo SAP2C and SAP2N monolayers, respectively (corresponding to an average helix/chromophore mole ratio of ~2:1 and ~3:1, respectively). This is similar to the maximal stoichiometry obtained for titration in detergent solution (namely, a peptide helix/chromophore mole ratio of 2:1).
Figure 5.
Linear UV-vis absorbance spectra of (a) SAP2C-PZnPI and (b) SAP2N-PZnPI monolayer films (holo-form) covalently attached to the surface of a fused silica substrate.
3.6. X-ray Interferometry of the SAP2N & SAP2C Peptide-Chromophore Complex in Monolayers at the Solid-Gas Interface
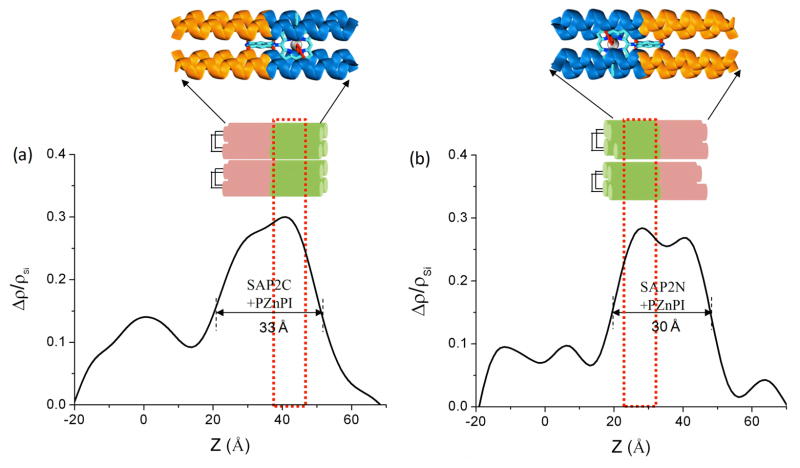
Fresnel-normalized x-ray reflectivity data enhanced by interferometry were also collected for both monolayers of holo SAP2C and SAP2N peptides incorporated with the chromophore at the silicon oxide-helium interface after incubation with the PZnPI chromophore and rinsing (Figure 6). The data for the multilayer substrate-overlayer systems for the SAP2C/PZnPI and SAP2N/PZnPI complexes, along with that for the multilayer reference structure itself, show a significant difference in the normalized reflectivity data between the reference structure itself and that with the covalently attached monolayer over the entire range of momentum transfer, and are especially evident when plotted on a semilog scale. The electron density profiles were similarly obtained (as described in section 3.4) from the normalized reflectivity via the box-refinement procedure, again assigning a total of five regions (or layers) within the reference structures based on their fabrication specifications; region I (the underlying bulk Si wafer), region II (first deposited amorphous Si layer), region III (deposited amorphous Ni layer), region IV (second deposited amorphous Si layer), and region V (amorphous SiOx layer) (see Figure 6c and d). The difference in the profiles between this reference structure and that for the peptide-chromophore monolayer on the same substrate correctly provides (as described in section 3.4) the electron density of the monolayers of the holo peptides SAP2C-PZnPI and SAP2N-PZnPI within the range of +20 Å (corresponding to the SiOx-peptide interface) to +65 Å (corresponding to the peptide-helium interface) (see Figure 7). The full-width at half-maximum (fwhm) values of the features of the peptide monolayer over this region of the profiles were found to be ~33 Å and ~30 Å for the SAP2C-PZnPI and the SAP2N-PZnPI, respectively. This is substantially shorter than the expected full-length of ~42 Å for the peptide’s 28-residue α-helix. Note that the asymmetric features of SAP2C with respect to the substrate surface in Figure 7a are highly similar to those for SAP2 in Figure 4d, while only their profile extent differs. Thus, this discrepancy can be ascribed to the tilt of the α-helices relative to the normal to the plane of the interface by approximately 37 to 44°. This is not surprising, because here the monolayer of the apo-peptide covalently attached onto the substrate was first rinsed with OG solution, then incubated with a PZnPI/OG solution, and subsequently rinsed extensively again with OG detergent solution, thereby also removing any non-covalently attached peptide in addition to excess chromophore. This would result in some degree of incomplete surface coverage, thereby allowing some tilt of the remaining peptide bundles with respect to the surface normal. We also note that the electron density features for the monolayer profiles of SAP2C-PZnPI and SAP2N-PZnPI are shown to be asymmetric, and near mirror images of each other with respect to the substrate surface (Figure 7). The difference between the SAP2C and SAP2N peptides is by design, based on the location of a cysteine residue on their peptide’s primary sequences (i.e., SAP2C has a cysteine residue at its C-terminus at the end of the hydrophilic domain while SAP2N has a cysteine residue at its N-terminus at the end of the hydrophobic domain). Hence, slightly different techniques for the monolayer deposition were applied, namely, LSb and LSa techniques for SAP2C and SAP2N, respectively (see Experimental Section for more details), providing precisely the opposite vectorial orientation of the peptide-chromophore complex for SAP2C-PZnPI versus SAP2N-PZnPI with respect to the substrate surface. Lastly, we note that the asymmetry in the profile structures of SAP2C-PZnPI and SAP2N-PZnPI is already present in the apo-forms of these peptides, each possessing somewhat higher electron density within their hydrophobic domain, where the histidine residue responsible for binding the Zn-porphyrin moiety of the chromophore is located, relative to that of their hydrophilic domain. Thus, it’s not possible to ascribe this additional holo form hydrophobic domain electron density exclusively to the presence of bound PZnPI.
Figure 7.
Difference between the electron density profile for the Si-Ni-Si reference structure and peptide/chromophore monolayer (holo form) on the Si-Ni-Si structure shown in Figure 6: (a) [SAP2C/PZnPI on Si-Ni-Si profile] minus [Si-Ni-Si profile] and (b) [SAP2N-PZnPI on Si-Ni-Si profile] minus [Si-Ni-Si profile]. The red open rectangular box (dotted line) indicates the expected position of PZn moiety of the bound PZnPI chromophore. Highly schematic representations of the SAP2C-PZnPI & SAP2N-PZnPI complexes (holo forms) covalently attached to a Si-Ni-Si surface are juxtaposed immediately above the profiles approximately to scale. Expanded scale schematic illustrations of the holo 4-helix SAP2C and SAP2N bundles are also shown above these representations.
3.7 Pump-Probe Transient Absorption Spectroscopy of SAP2N-PZnPI in Detergent Solution
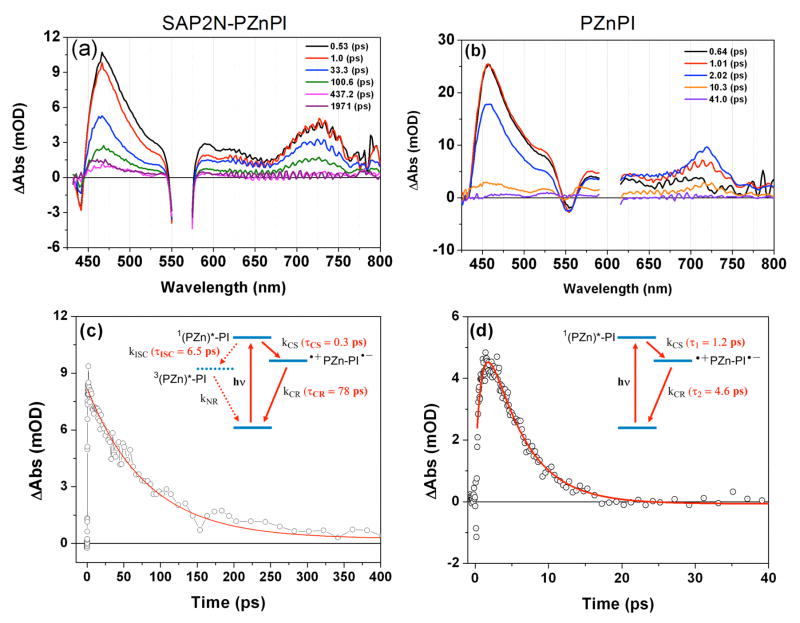
The excited state dynamics of the SAP2N peptide-chromophore complex, and PZnPI in DMSO solution, were interrogated using femtosecond transient absorption spectroscopy. Figure 8a–b displays representative transient absorption spectral data obtained for the SAP2N holo peptide in buffered detergent, and PZnPI in DMSO solvent, at multiple time delays. Note that the general features of these transient absorption spectra resemble those elucidated previously for PZnPI in CH2Cl2 solvent.13,27 Electronic excitation of PZnPI produces a porphyrin-localized singlet excited state, 1(PZn)*-PI, which in CH2Cl2 solvent undergoes a charge separation (CS) reaction characterized by a sub ps time constant (τCS = 770 fs), and a correspondingly rapid thermal charge recombination (CR) reaction (τCR = 5.2 ps).27 Similarly, the excited state dynamics evinced by PZnPI within the SAP2N peptide or in DMSO solvent display the spectroscopic hallmarks of CS state formation (PI•−, sharp absorption at ~710 nm,35 PZn•+, broad absorption at ~450 nm and ~700–750 nm).27, 36,37
Figure 8.
Transient absorption spectra of (a) the SAP2N-PZnPI peptide (chromophore/peptide helix mole ratio of 1:4 in 50 mM phosphate buffer with 2.2 wt% OG, and (b) PZnPI in DMSO solvent, recorded at the labeled time delays. Experimental conditions: temperature = 20 °C; (a) λex = 560 nm, (b) λex = 601 nm. Exemplary transient decay kinetics measured at 719 nm for the (c) SAP2N-PZnPI peptide (chromophore/peptide helix mole ratio of 1:4) and (d) PZnPI in DMSO solvent. Insets to panels (c) and (d) display summaries of the respective proposed ET dynamics determined from global fitting of transient data acquired over the vis-NIR spectral domain (SAP2N-PZnPI: τCS = 300 fs, τCR = 78 ps; PZnPI in DMSO: τCS = 1.2 ps, τCR = 4.6 ps).
The rate constants for photoinduced CS and thermal CR reactions for the SAP2N holo peptide and PZnPI in DMSO solvent, were determined from multiwavelength global fitting of the vis/NIR domain transient absorption data (Figure 8c, d). With respect to the PZnPI dynamics determined in DMSO (τCS = 1.2 ps, τCR = 4.6 ps), note that these time constants not only resemble those previously evaluated in CH2Cl2,27 but also those determined for a closely related PZnPI structure examined in THF (τCS = 2.6 ps, τCR = 9.1 ps) and DMF (τCS = 1.8 ps, τCR = 3.1 ps) solvents.38
The excited state dynamics manifest by the SAP2N holo peptide in buffered detergent (τCS = 0.3 ps, τCR = 78 ps; Figure 8a, c), however, differ markedly from those evinced by PZnPI in DMSO, CH2Cl2, THF, and DMF solvents. The CR time constant determined for the SAP2N holo peptide, interestingly, is of similar magnitude to that evaluated for PZnPI in toluene solvent (τCR = 91 ps), consistent with the typically low dielectric strength of the peptide interior (εtoluene = 2.38;39 εpeptide interior ~2 – 4),40, 41 and the expectation that a decrease in solvent polarity will augment PZn•+PI•− charge-separated lifetime, consistent with previous studies and CR thermodynamics that underscore that this process lies in the Marcus inverted region.27,38
Note that the CS time constant determined for the SAP2N holo peptide lies in the ultrafast time regime (τCS = 0.3 ps), and contrasts sharply that evaluated for PZnPI in toluene solvent (τCS = 5.9 ps).38 It is important underscore in this regard that the impact of H-bonding interactions upon PZnPI CS dynamics have been interrogated; these data demonstrate that addition of ethanol (0.1~1%, v:v) to nonpolar solvents significantly decreases the magnitude of τCS, presumably through imide-localized H-bonding interactions that augment PI electron affinity and thereby decrease ΔGCS.42 While control studies that examine PZnPI charge transfer dynamics in aqueous detergent in the absence of protein also showed an accelerated CS rate constant relative to that evinced in aprotic solvent, it is important to note that consistent with extensive previous work,43–45 the protein matrix may play additional roles that reduce reorganization free energy relative to bulk solvent. Nonetheless, in the absence of detailed structural or vibrational spectroscopic data for the α-helical bundle-based ET assembly, these pioneering dynamical experiments involving mixed nonpolar/H-bonding solvent systems offer an extremely intriguing explanation for the PZnPI ET dynamics determined within the SAP2N peptide: namely, that within the bundle interior, one or more H-bonding interactions involving the peptide or a trapped water molecule with the PI imide carbonyl oxygen serves to diminish the magnitude of ΔGCS for PZnPI, while maintaining a highly nonpolar chromophore-localized dielectric environment.
4. Conclusions
4-helix bundles of a shortened version of the amphiphilic peptide AP2 have been utilized to vectorially-orient the PZnPI Donor-bridge-Acceptor electron transfer chromophore within acentric 2-D ensembles on a planar inorganic surface via a “directed-assembly” approach, achieving in-plane chromophore densities approaching 1/200Å2. The particular vectorial orientation of the chromophore with respect to the surface normal was controlled through the utilization of inorganic surface-selective residues positioned at either end of the bundle. The excited state dynamics of the SAP2N peptide-chromophore complex determined in buffered detergent solution differ significantly from those established in all other solvent systems27,38 in that the PZnPI chromophore displays both ultrafast charge separation (τCS = 0.3 ps) and a long-lived PZn•+PI•− charge-separated state (τCR = 78 ps). Extensive benchmark data13,27,38,42 strongly suggest that the combination of one or more H-bonding interactions involving the peptide (or a trapped water molecule within the peptide assembly) and the PI imide carbonyl oxygen, and a highly nonpolar chromophore-localized dielectric environment, lie at the genesis of these electron transfer dynamics. These 4-helix bundle peptides thus not only provide the required structure to enable formation of acentric 2-D ensembles of D-br-A structures at high in-plane densities, but also afford a means to engineer unique chromophore-localized solvation environments while protecting sensitive, organic-based photo-active elements in an insulating sheath. Analogous chromophores, utilizing longer bridges, will allow the length of the Donor-bridge- Acceptor assembly to match that of the peptide bundle; such D-br-A structures, having both optimized length and appropriate CS and CR reaction thermodynamics, utilized in concert with modern peptide design, provide a new approach in the development of more efficient active layers in bilayer heterojunction photovoltaic devices.
Acknowledgments
The authors thank Paul Heiney of the Univeristy of Pennsylvania Department of Physics for use of the Triple Axis Diffractometer System and Chian Liu of Deposition laboratory of the Argonne National Laboratory, for fabrication of the reference structures used in the interferometry measurements. This work was supported primarily from a grant from the Department of Energy Biomolecular Materials program DE-FG02-04ER46156 [AT, VK, MJT & JKB]. Partial support of this work, as well as infrastructural support, was provided by the MRSEC (DMR05-20020) [JK] and NSEC (DMR-0425780) [RZ & JP] Programs of the National Science Foundation. Partial support was also provided by the National Institutes of Health R01 GM-071628 [HCF]. Use of the Advanced Photon Source was supported by the U. S. Department of Energy, Office of Science, Office of Basic Energy Sciences, under Contract No. DE-AC02-06CH11357.
Footnotes
Supporting Information Available: (1) Calculation of intersystem crossing quantum yield from transient absorption spectra; (2) UV-vis absorption spectrum of SAP2C-PZnPI complex; and (3) global analysis for the transient decay kinetics measured at the labeled wavelengths for the PZnPI chromophore incorporated into the SAP2N peptide at a chromophore/peptide helix mole ratio of 1:4. (PZnPI:SAP2C=1:4) for 100 A/helix at the air-water interface. This material is available free of charge via the internet at http://pubs.acs.org.
References and Footnotes
- 1.Marcus RA. Biochem Biophys Acta. 1985;811:265. [Google Scholar]
- 2.Closs GL, Miller JR. Science. 1988;240:440. doi: 10.1126/science.240.4851.440. [DOI] [PubMed] [Google Scholar]
- 3.Wasielewski MR. Chem Rev. 1992;92:435. [Google Scholar]
- 4.Marcus RA. Rev Mod Phys. 1993;65:599. [Google Scholar]
- 5.Paddon-Row MN. Acc Chem Res. 1994;27:18. doi: 10.1021/ar400127g. [DOI] [PubMed] [Google Scholar]
- 6.Sauvage JP, Collin JP, Chambron JC, Guillerez S, Coudret C, Balzani V, Barigelletti F, De Cola L, Flamigni L. Chem Rev. 1994;94:993. [Google Scholar]
- 7.Gust D, Moore TA, Moore AL. Acc Chem Res. 2001;34:40. doi: 10.1021/ar9801301. [DOI] [PubMed] [Google Scholar]
- 8.Verhoeven JW, van Ramesdonk HJ, Groeneveld MM, Benniston AC, Harriman A. ChemPhysChem. 2005;6:2251. doi: 10.1002/cphc.200500029. [DOI] [PubMed] [Google Scholar]
- 9.Benniston AC, Harriman A. Chem Soc Rev. 2006;35:169. doi: 10.1039/b503169a. [DOI] [PubMed] [Google Scholar]
- 10.Wasielewski MR. Acc Chem Res. 2009;42:1910. doi: 10.1021/ar9001735. [DOI] [PubMed] [Google Scholar]
- 11.Skourtis SS, Waldeck DH, Beratan DN. Annu Rev Phys Chem. 2010;61:461. doi: 10.1146/annurev.physchem.012809.103436. [DOI] [PMC free article] [PubMed] [Google Scholar]
- 12.Kang YK, Iovine PM, Therien MJ. Coord Chem Rev. 2011;255:804. [Google Scholar]
- 13.Redmore NP, Rubtsov IV, Therien MJ. J Am Chem Soc. 2003;125:8769. doi: 10.1021/ja021278p. [DOI] [PubMed] [Google Scholar]
- 14.Benanti TL, Venkataraman D. Photosynth Res. 2006;87:73. doi: 10.1007/s11120-005-6397-9. [DOI] [PubMed] [Google Scholar]
- 15.Gunes S, Neugebauer H, Sariciftci NS. Chem Rev. 2007;107:1324. doi: 10.1021/cr050149z. [DOI] [PubMed] [Google Scholar]
- 16.Kamat PV. J Phys Chem C. 2007;111:2834. [Google Scholar]
- 17.Roncali J, Leriche P, Cravino A. Adv Mater. 2007;19:2045. [Google Scholar]
- 18.Thompson BC, Frechet JMJ. Angew Chem Int Ed. 2008;47:58. doi: 10.1002/anie.200702506. [DOI] [PubMed] [Google Scholar]
- 19.Heremans P, Cheyns D, Rand BP. Acc Chem Res. 2009;42:1740. doi: 10.1021/ar9000923. [DOI] [PubMed] [Google Scholar]
- 20.Kalyanasundaram K, Graetzel M. Curr Opin Biotechnol. 2010;21:298. doi: 10.1016/j.copbio.2010.03.021. [DOI] [PubMed] [Google Scholar]
- 21.Ye SX, Discher BM, Strzalka J, Xu T, Wu SP, Noy D, Kuzmenko I, Gog T, Therien MJ, Dutton PL, Blasie JK. Nano Lett. 2005;5:1658. doi: 10.1021/nl050542k. [DOI] [PubMed] [Google Scholar]
- 22.Xu T, Wu SP, Miloradovic I, Therien MJ, Blasie JK. Nano Lett. 2006;6:2387. doi: 10.1021/nl062091p. [DOI] [PubMed] [Google Scholar]
- 23.Strzalka J, Xu T, Tronin A, Wu SP, Miloradovic I, Kuzmenko I, Gog T, Therien MJ, Blasie JK. Nano Lett. 2006;6:2395. doi: 10.1021/nl062092h. [DOI] [PubMed] [Google Scholar]
- 24.Krishnan V, Tronin A, Strzalka J, Fry HC, Therien MJ, Blasie JK. J Am Chem Soc. 2010;132:11083. doi: 10.1021/ja1010702. [DOI] [PubMed] [Google Scholar]
- 25.Gonella G, Dai HL, Fry HC, Therien MJ, Krishnan V, Tronin A, Blasie JK. J Am Chem Soc. 2010;132:9693. doi: 10.1021/ja1010724. [DOI] [PubMed] [Google Scholar]
- 26.Ye SX, Strzalka JW, Discher BM, Noy D, Zheng SY, Dutton PL, Blasie JK. Langmuir. 2006;22:512. doi: 10.1021/la0363884. [DOI] [PubMed] [Google Scholar]
- 27.Redmore NP, Rubtsov IV, Therien MJ. Inorg Chem. 2002;41:566. doi: 10.1021/ic0108641. [DOI] [PubMed] [Google Scholar]
- 28.Tronin A, Strzalka J, Krishnan V, Kuzmenko I, Fry HC, Therien MJ, Blasie JK. Rev Sci Instrum. 2009;80:033102. doi: 10.1063/1.3089807. [DOI] [PubMed] [Google Scholar]
- 29.Blasie JK, Zheng S, Strzalka J. Phys Rev B. 2003;67:224201. [Google Scholar]
- 30.Krishnan V, Strzalka J, Liu J, Liu CA, Kuzmenko I, Gog T, Blasie JK. Phys Rev E. 2010;81:021604. doi: 10.1103/PhysRevE.81.021604. [DOI] [PubMed] [Google Scholar]
- 31.Gouterman M. J Mol Spectrosc. 1961;6:138. [Google Scholar]
- 32.Gust D, Moore TA, Moore AL, Leggett L, Lin S, Degraziano JM, Hermant RM, Nicodem D, Craig P, Seely GR, Nieman RA. J Phys Chem. 1993;97:7926. [Google Scholar]
- 33.Castriciano MA, Romeo A, Villari V, Angelini N, Micali N, Scolaro LM. J Phys Chem B. 2005;109:12086. doi: 10.1021/jp0508960. [DOI] [PubMed] [Google Scholar]
- 34.Zhao LZ, Ma RJ, Li JB, Li Y, An YL, Shi LQ. Biomacromolecules. 2008;9:2601. doi: 10.1021/bm8004808. [DOI] [PubMed] [Google Scholar]
- 35.Wiederrecht GP, Niemczyk MP, Svec WA, Wasielewski MR. J Am Chem Soc. 1996;118:81. [Google Scholar]
- 36.Fajer J, Borg DC, Forman A, Dolphin D, Felton RH. J Am Chem Soc. 1970;92:3451. doi: 10.1021/ja00714a038. [DOI] [PubMed] [Google Scholar]
- 37.While the molecular factors responsible for these dynamics are at present unclear, the transient absorption spectrum obtained for the SAP2N peptide-chromophore complex at a time delay of 3 ns (Figure 8a), shows the distinctive spectroscopic signature of the PZn electronically excited triplet (3PZn*),46,47 and no spectral features associated with the PZn+PI− charge-separated state; in this regard it is noteworthy that no previous study examining PZnPI excited-state dynamics in organic solvents observed a measurable 3PZn*—PI concentration.13,27,38 The single exponential decay dynamics exhibited by PZn+PI− in the SAP2N holo peptide is consistent with the fact that 3(PZn)*—PI originates from 1(PZn)*—PI via an intersystem crossing process. Based on the acquired pump-probe transient absorption spectral data, less than 10 % of the initially prepared 1(PZn)*—PI excited state population intersystem crosses to 3(PZn)*—PI (see Supporting Information).
- 38.Yoshida N, Ishizuka T, Yofu K, Murakami M, Miyasaka H, Okada T, Nagata Y, Itaya A, Cho HS, Kim D, Osuka A. Chem Eur J. 2003;9:2854. doi: 10.1002/chem.200204588. [DOI] [PubMed] [Google Scholar]
- 39.CRC Handbook of Chemistry and Physics. 91. CRC Press; Boca Raton, FL: 2011. [Google Scholar]
- 40.Honig B, Nicholls A. Science. 1995;268:1144. doi: 10.1126/science.7761829. [DOI] [PubMed] [Google Scholar]
- 41.Wang W, Lim WA, Jakalian A, Wang J, Luo R, Bayly CI, Kollman PA. J Am Chem Soc. 2001;123:3986. doi: 10.1021/ja003164o. [DOI] [PubMed] [Google Scholar]
- 42.Mataga N, Taniguchi S, Chosrowjan H, Osuka A, Yoshida N. Chem Phys. 2003;295:215. doi: 10.1039/b300649m. [DOI] [PubMed] [Google Scholar]
- 43.Blumberger J, Klein ML. J Am Chem Soc. 2006;128:13854–13867. doi: 10.1021/ja063852t. [DOI] [PubMed] [Google Scholar]
- 44.Wang H, Lin S, Allen JP, Williams JC, Blankert S, Laser C, Woodbury NW. Science. 2007;316:747–750. doi: 10.1126/science.1140030. [DOI] [PubMed] [Google Scholar]
- 45.Tipmanee V, Oberhofer H, Park M, Kim KS, Blumberger J. J Am Chem Soc. 2010;132:17032–17040. doi: 10.1021/ja107876p. [DOI] [PubMed] [Google Scholar]
- 46.Nojiri T, Watanabe A, Ito O. J Phys Chem A. 1998;102:5215. [Google Scholar]
- 47.Pekkarinen L, Linschitz H. J Am Chem Soc. 1960;82:2407. [Google Scholar]
- 48.Gupta S, Liu J, Strzalka J, Blasie JK. Phys Rev E. 2011;84(3):031911. doi: 10.1103/PhysRevE.84.031911. [DOI] [PMC free article] [PubMed] [Google Scholar]


