

Abstract
BACKGROUND
Epidemiologic data on anesthesia-related complications occurring during labor and delivery are essential for measuring and evaluating the safety and quality of obstetric anesthesia care but are lacking. We aimed to fill this research gap by exploring the epidemiologic patterns and risk factors of anesthesia-related complications in a large sample of women giving birth in New York hospitals.
METHODS
Using the Healthcare Cost and Utilization Project State Inpatient Databases files, we identified all discharge records for labor and delivery from New York hospitals between 2002 and 2005. We then identified women who experienced any recorded anesthesia-related complication during labor and delivery as determined by International Classification of Diseases, Ninth Revision, Clinical Modification codes. The incidence of anesthesia-related complications was calculated by demographic and clinical characteristics. Multivariate logistic regression was performed to assess risk factors of anesthesia-related complications.
RESULTS
Of the 957,471 deliveries studied, 4438 (0.46%) had at least one anesthesia-related complication. The majority (55%) of anesthesia-related events occurring during labor and delivery were spinal complications, followed by systemic complications (43%) and overdose or adverse effects (2%). Multivariate logistic regression revealed five risk factors of anesthesia-related complications: cesarean delivery (odds ratio [OR] 2.51, 95% confidence interval [CI] 2.36–2.68), rural area (OR 1.33, 95% CI 1.21–1.46), Charlson-Deyo Comorbidity Index ≥1 (OR 1.47, 95% CI 1.28–1.69), Caucasian race (OR 1.37, 95% CI 1.24–1.52), and scheduled admission (OR 1.10, 95% CI 1.03–1.18). Anesthesia-related complications were associated with about a one-day increase in the average length of stay (3.89 ± 3.69 [mean ± sd] days vs 2.92 ± 2.38 days for deliveries without anesthesia-related complications, P < 0.0001) and a 22-fold increased risk of maternal mortality (OR 22.26, 95% CI 11.20–44.24).
CONCLUSION
The incidence of anesthesia-related complications during labor and delivery seems to be low but remains a cause of concern, particularly in women undergoing cesarean delivery, living in rural areas, or having preexisting medical conditions.
Anesthesia-related complications are the seventh leading cause of pregnancy-related mortality in the United States, accounting for 1.8% of all pregnancy-related deaths.1 Although there is still room for improvement, these figures represent a drastic reduction in the number of anesthesia-related deaths over the last few decades. As the overall maternal mortality has declined, maternal morbidity has become increasingly important. It has been recognized that maternal morbidity is a more appropriate and useful indicator of obstetric care quality than mortality.2 For example, investigators found that the incidence of serious complications of obstetric epidural analgesia did not change over a 17-yr study period.3 Additionally, it has been shown that the rate of pregnancy-related neurological complications has not changed substantially over the years.4 The role of anesthesia in these neurological complications is the subject of active research. Such information may lead to improved protocols for obstetric care and better clinical outcomes for patients.
There have been various studies on the complications of obstetric anesthesia and analgesia.3-14 Many of these studies are case reports and case series analyses, limited to complications of epidural and other regional anesthesia techniques, and data from hospitals in European countries. There is a paucity of epidemiologic data about complications of obstetric anesthesia from the United States. Although the closed claims data compiled by the American Society of Anesthesiologists have served as a valuable resource for understanding the medico-legal risk in anesthesia, they represent only a selected part of the “tip of the iceberg,” and thus do not shed much light on the epidemiology of anesthesia-related complications. To explore the incidence and risk factors of anesthesia-related complications during labor and delivery, we conducted an epidemiologic investigation using the Healthcare Cost and Utilization Project (HCUP) New York State (NYS) Inpatient Databases (SID) files from 2002 to 2005.
METHODS
Data Source
For this study, we used data from the HCUP SID files for NYS from 2002 to 2005 inclusive. These SID files are maintained by the Agency for Healthcare Research and Quality, contain a census of the inpatient discharge abstracts in participating states, and encompass about 90% of all US community hospital discharges. Clinical and nonclinical variables in the hospital discharge data files include, but are not limited to, principal and secondary diagnoses and procedures, admission and discharge status, patient demographics (e.g., gender, age, and race), expected payment source (e.g., Medicare, Medicaid, private insurance, and self-pay), total charges, and length of stay (LOS).*
NYS regulations require all certified hospitals to electronically submit inpatient data coded by professional medical coders in a uniform format. To ensure data quality, a number of quality control measures have been established. First, 95% of a hospital’s discharge data must be submitted within 60 days of the patient’s discharge month. Second, only specifically defined values in a record are accepted. Submissions using nonprescribed values are not accepted. Third, audit reports monitor compliance with submission regulations and noncompliant hospitals are given assistance to ensure that submission requirements are met. Fourth, the Bureau of Biometrics’ Data Quality Unit’s processing and editing programs analyze data trends and report the accuracy and completeness of hospital discharge data. In addition, periodic reviews of data quality compare inpatient hospital data with other Department of Health data to detect and resolve possible problems in data submitted by individual hospitals.
Study Subjects
The study protocol was reviewed and judged to be exempt by the Columbia University IRB. Our study sample consisted of 957,471 hospital discharges that had a diagnosis indicating labor and delivery in NYS from 2002 to 2005, as ascertained by International Classification of Diseases, Ninth Revision, Clinical Modification (ICD-9-CM) codes V27.0–V27.9 for identifying outcome of deliveries and Diagnosis-Related Group delivery codes 370–375. One study recently showed that adding these Diagnosis-Related Group delivery codes (370–375) identifies approximately 3% more in-hospital deliveries than using the ICD-9-CM codes V27.0–V27.9 alone, and thus is a more accurate method for determining deliveries.15
The HCUP Clinical Classification Software procedure code 134 was used to identify cesarean deliveries. The Clinical Classification Software for ICD-9-CM is a diagnosis and procedure categorization scheme developed as part of HCUP, which collapses diagnosis and procedure codes from ICD-9-CM, and can be used in many types of projects analyzing data on diagnoses and procedures.† We excluded hospital discharges that contained the following ICD-9-CM diagnosis codes: 630 (hydatidiform mole), 631 (other abnormal product of conception), 633 (ectopic pregnancy), 632, 634, 636–639 (abortion), and procedure codes; 69.01, 69.51, 74.91, and 75.0 (abortion).15
To identify anesthesia-related complications during labor and delivery, we screened the discharge diagnoses for the following ICD-9-CM codes: 668.00–668.94 (systemic complications due to the administration of anesthesia in labor and delivery); 3.95, 324.1, 349.0 (spinal complications); 995.4, 995.86, 995.89, 968.1–968.4, 968.7, E855.1, E876.3, and E938.1-E938.9 (overdose and adverse effects of anesthetics and analgesics). A complete list of the ICD-9-CM codes and their corresponding complications is presented in Table 1.
Table 1.
ICD-9-CM Anesthesia-Related Complication Codesa
| ICD-9-CM code | Complication |
|---|---|
| Systemic Complications | |
| 668 | Complications of the administration of anesthesia in labor and delivery |
| 668.0 | Pulmonary complications Inhalation (aspiration) of stomach contents or secretions after anesthesia or other sedation in labor and delivery |
| Mendelson syndrome after anesthesia or other sedation in labor and delivery | |
| Pressure collapse of lung after anesthesia or other sedation in labor or delivery | |
| 668.1 | Cardiac complications |
| 668.2 | Central nervous system complications |
| 668.8 | Other complications of anesthesia or other sedation in labor and delivery |
| 668.9 | Unspecified complication of anesthesia or other sedation |
| Spinal complications | |
| 349.0 | Reaction to spinal or lumbar puncture Headache after lumbar puncture |
| 324.1 | Intraspinal abscess—epidural, extradural, and subdural |
| 3.95b | Spinal blood patch |
| Overdose complications | |
| 968.1 | Poisoning by halothane |
| 968.2 | Poisoning by other gaseous anesthetics: ether, halogenated hydrocarbon derivatives, except halothane, nitrous oxide |
| 968.3 | Poisoning by IV anesthetics: ketamine, methohexital (methohexitone), thiobarbiturates, such as thiopental sodium |
| 968.4 | Poisoning by other and unspecified general anesthetics |
| 968.7 | Poisoning by spinal anesthetics |
| E855.1 | Accidental poisoning by other central nervous system depressants: ether, gaseous anesthetics, halogenated hydrocarbon derivatives, IV anesthetics, thiobarbiturates, such as thiopental sodium |
| Adverse effects | |
| E938.1–E938.9 | Adverse effects by other central nervous system depressants and anesthetics |
| 995.4 | Shock due to anesthesia |
| 995.86 | Malignant hyperthermia due to anesthesia |
| 995.89 | Other specified adverse event not elsewhere classified |
| E876.3 | Endotracheal tube wrongly placed during anesthetic procedure |
Available at: http://www.cgmh.org.tw/chldhos/intr/c4a00/academy/icd9/1tabular.html. Accessed June 15, 2008.
ICD-9 procedure code.
Statistical Analysis
The frequency distribution of anesthesia-related complications was tabulated by complication type and patient characteristics. The incidence of anesthesia-related complications and 95% confidence intervals were calculated according to demographic and clinical characteristics, such as age, race, method of payment, Charlson-Deyo Comorbidity Index,16-18 type of admission, rural/urban area, and method of delivery. Rural/urban area refers to commuting areas assigned by the US Census Bureau to ZIP codes of home addresses. Urban ZIP codes are identified by population size and rural ZIP codes by their population and the strength of their association with larger urban areas. Rural ZIP codes are differentiated by the size of their largest urban community, the proportion of that population regularly commuting to larger urban areas, and the size of the urban destinations.* Whether the admission was on a weekday (Monday to Friday) or a weekend (Saturday and Sunday) was calculated from the reported admission day of the week. New York defined a scheduled admission as one which was arranged through the hospital at least 24 h before the admission.* If the admission was an emergency or urgent, it was coded as unscheduled; if elective, it was coded as scheduled. If the admission type was unknown or newborn, a table was used to determine the appropriate coding.‡
Multivariate logistic regression was used to examine risk factors of anesthesia-related complications while adjusting for potential confounding variables. A sub-group analysis of cesarean deliveries was performed to assess potential bias resulting from differential exposure to anesthesia in the overall study sample.
To evaluate the consequences of anesthesia-related complications, we compared the mean LOS and maternal in-hospital mortality rates between deliveries with and without anesthesia-related complications. Statistical analysis was performed using the SAS version 9.1.3 (SAS Institute, Cary, NC).
RESULTS
Complication Profile
In our study of 957,471 deliveries in NYS from 2002 to 2005, we found that 4438 deliveries experienced 8597 recorded anesthesia-related complications. Spinal complications were the most common condition (55%), followed by systemic complications (43%) and overdose and adverse effects (2%; Table 2). The type of anesthesia-related complications during labor and delivery varied across racial and age groups. Specifically, anesthesia-related complications in African-American women and women aged 40–55 yr were more likely to be systemic complications, whereas spinal complications were more common in Caucasian women and women aged 30–39 yr. During the 4-yr study period, the percentage of spinal complications decreased from 57% to 54%, whereas systemic complications increased from 41% to 43% (Fig. 1).
Table 2.
Frequency Distribution of Anesthesia-Related Complications in Labor and Delivery in New York State, 2002-2005
| Complication type | ICD-9-CM code | Number of complicationsa |
% |
|---|---|---|---|
| Complications of the administration of anesthesia in labor and delivery |
668 | 3712 | 43.2 |
| Pulmonary complications | 668.0 | 177 | 2.1 |
| Cardiac complications | 668.1 | 161 | 1.9 |
| Central nervous system complications | 668.2 | 55 | 0.6 |
| Other complications | 668.8 | 3290 | 38.3 |
| Unspecified complications | 668.9 | 29 | 0.3 |
| Spinal complications | 3.95, 324.1, 349.0 | 4701 | 54.7 |
| Spinal blood patch | 3.95b | 1787 | 20.8 |
| Intraspinal abscess | 324.1 | 0 | 0 |
| Reaction to spinal or lumbar puncture | 349.0 | 2914 | 33.9 |
| Overdose complications and adverse effects |
968.1–968.4, 968.7, E855.1, and E938.1–E938.9, 995.4, 995.86, 995.89, E876.3 |
184 | 2.1 |
| Total | All of the above | 8597 | 100.0 |
A given patient may have more than one complication type.
ICD-9 procedure code.
Figure 1.
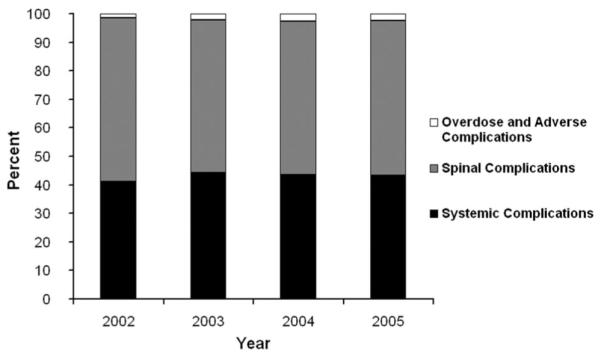
Percentage distributions of anesthesia-related complications in labor and delivery by year, New York State, 2002-2005.
Incidence and Risk Factors
The overall incidence of anesthesia-related complications in labor and delivery was 0.46%, which varied significantly by patient characteristics (Table 3) and clinical circumstances (Table 4). The incidence was higher in women who were 30 yr and older, who were Caucasian, who had private insurance, or who had a Charlson-Deyo Comorbidity Index ≥1 (Table 3). Considerably higher incidence was also found for cesarean deliveries, women living in rural areas, and women who delivered through scheduled admission (Table 4).
Table 3.
Incidence and 95% Confidence Intervals (CIs) of Anesthesia-Related Complications in Labor and Delivery by Patient Characteristics, New York State, 2002-2005
| Patient characteristics | No. of patientsa | No. of patients with complications |
Incidence (%) | 95% CI |
|---|---|---|---|---|
| Age (yr) | ||||
| 11–19 | 67,922 | 222 | 0.33 | 0.28–0.37 |
| 20–29 | 435,119 | 1838 | 0.42 | 0.40–0.44 |
| 30–39 | 416,149 | 2185 | 0.53 | 0.50–0.55 |
| 40–55 | 38,269 | 193 | 0.50 | 0.43–0.58 |
| Race | ||||
| Caucasian | 463,135 | 2531 | 0.55 | 0.53–0.57 |
| African American | 146,937 | 539 | 0.37 | 0.34–0.40 |
| Hispanic | 137,633 | 545 | 0.40 | 0.36–0.43 |
| Other | 148,488 | 590 | 0.40 | 0.37–0.43 |
| Payment type | ||||
| Medicaid and medicare | 370,972 | 1453 | 0.39 | 0.37–0.41 |
| Private insurance | 530,040 | 2783 | 0.53 | 0.51–0.54 |
| Self-pay | 38,727 | 133 | 0.34 | 0.29–0.40 |
| Other | 17,732 | 69 | 0.39 | 0.30–0.48 |
| Charlson Comorbidity Index | ||||
| 0 | 926,814 | 4215 | 0.45 | 0.44–0.47 |
| 1 + | 30,657 | 223 | 0.73 | 0.63–0.82 |
The total number of patients within variables may vary because of missing data.
Table 4.
Incidence and 95% Confidence Intervals (CIs) of Anesthesia-Related Complications in Labor and Delivery by Selected Circumstances, New York State, 2002–2005
| Circumstance | Number of patientsa |
Number of patients with complications |
Incidence (%) | 95% CI |
|---|---|---|---|---|
| Year | ||||
| 2002 | 233,502 | 1001 | 0.43 | 0.40–0.46 |
| 2003 | 239,083 | 1167 | 0.49 | 0.46–0.52 |
| 2004 | 244,784 | 1138 | 0.46 | 0.44–0.49 |
| 2005 | 240,102 | 1132 | 0.47 | 0.44–0.50 |
| Admission month | ||||
| January to March | 232,589 | 1038 | 0.45 | 0.42–0.47 |
| April to June | 241,883 | 1145 | 0.47 | 0.45–0.50 |
| July to September | 250,359 | 1171 | 0.47 | 0.44–0.49 |
| October to December | 232,640 | 1084 | 0.47 | 0.44–0.49 |
| Admission day | ||||
| Weekend | 197,527 | 839 | 0.42 | 0.40–0.45 |
| Weekday | 759,944 | 3599 | 0.47 | 0.46–0.49 |
| Scheduled admission | ||||
| Yes | 541,900 | 2774 | 0.51 | 0.49–0.53 |
| No | 415,571 | 1664 | 0.40 | 0.38–0.42 |
| Rural/urban | ||||
| Urban | 845,050 | 3771 | 0.45 | 0.43–0.46 |
| Rural | 89,481 | 568 | 0.63 | 0.58–0.69 |
| Cesarean section | ||||
| Yes | 282,556 | 2274 | 0.80 | 0.77–0.84 |
| No | 674,915 | 2164 | 0.32 | 0.31–0.33 |
The total number of patients within variables may vary because of missing data.
Of the deliveries studied, 30% were by cesarean section, which accounted for 51% of all anesthesia-related complications. The incidence of anesthesia-related complications in cesarean deliveries was 2.1–3.2 times higher than the rate in vaginal deliveries across the entire maternal age spectrum, with the greatest difference seen in the 40–55 yr age group (Fig. 2).
Figure 2.
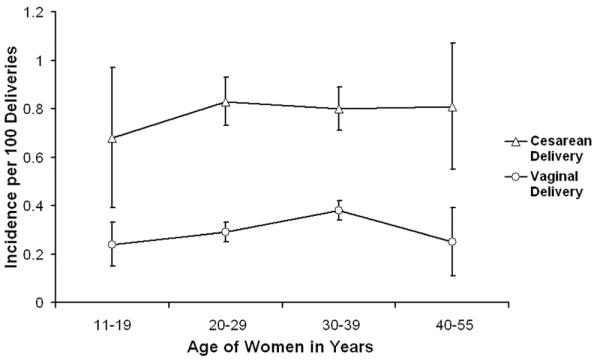
Incidence of anesthesia-related complications in labor and delivery by age and method of delivery, New York State, 2002-2005.
Multivariate logistic regression modeling confirmed the excessive risk of anesthesia-related complications in cesarean deliveries (adjusted odds ratio [OR] 2.51) (Table 5, Model 1). In addition to cesarean delivery, Charlson-Deyo Comorbidity Index ≥1, rural area, being Caucasian, and scheduled admission were each associated with a significantly increased risk of anesthesia-related complications (Table 5, Model 1). When the analysis was limited to cesarean deliveries, the estimated OR of anesthesia-related complications associated with Charlson-Deyo Comorbidity Index decreased from 1.47 to 1.28 but remained statistically significant. On the other hand, the estimated OR associated with rural area increased from 1.33 to 1.65 (Table 5, Model 2).
Table 5.
Estimated Odds Ratios (ORs) and 95% Confidence Intervals (CIs) for Anesthesia-Related Complications in Labor and Delivery for Multivariate Logistic Regression Models, New York State, 2002-2005
| Model 1a |
Model 2b |
|||
|---|---|---|---|---|
| Effect | Odds ratio | 95% CI | Odds ratio | 95% CI |
| Age (yr) | ||||
| 11–19 | 0.88 | 0.76–1.02 | 0.85 | 0.68–1.07 |
| 20–29 | 1.00 | — | 1.00 | — |
| 30–39 | 1.08 | 1.01–1.15 | 0.97 | 0.88–1.07 |
| 40–55 | 0.95 | 0.81–1.11 | 1.02 | 0.85–1.23 |
| Race | ||||
| Caucasian | 1.37 | 1.24–1.52 | 1.39 | 1.21–1.60 |
| African American | 1.00 | — | 1.00 | — |
| Hispanic | 1.11 | 0.98–1.26 | 1.09 | 0.92–1.29 |
| Other | 1.16 | 1.03–1.32 | 1.21 | 1.02–1.43 |
| Payment type | ||||
| Medicaid/medicare | 0.94 | 0.87–1.01 | 1.06 | 0.95–1.17 |
| Private insurance | 1.00 | — | 1.00 | — |
| Self-pay | 0.81 | 0.66–1.00 | 0.90 | 0.66–1.20 |
| Other | 0.87 | 0.68–1.12 | 0.77 | 0.53–1.12 |
| Charlson Comorbidity Index | ||||
| 0 | 1.00 | — | 1.00 | — |
| 1 + | 1.47 | 1.28-1.69 | 1.28 | 1.06–1.54 |
| Admission day | ||||
| Weekend | 1.01 | 0.93-1.09 | 1.10 | 0.98–1.23 |
| Weekday | 1.00 | — | 1.00 | — |
| Scheduled admission | ||||
| Yes | 1.10 | 1.03-1.18 | 1.14 | 1.03–1.25 |
| No | 1.00 | — | 1.00 | — |
| Rural/urban | ||||
| Urban | 1.00 | — | 1.00 | — |
| Rural | 1.33 | 1.21–1.46 | 1.65 | 1.46–1.87 |
| Cesarean delivery | ||||
| Yes | 2.51 | 2.36–2.68 | — | — |
| No | 1.00 | — | — | — |
Model 1 was constructed using data for all patients from 2002 to 2005.
Model 2 was constructed using data for all patients who had cesarean deliveries from 2002 to 2005.
Impact on LOS and Maternal Mortality
The average LOS for women with anesthesia-related complications (3.89 ± 3.69 days [mean ± sd]) was about one-day longer than for women without anesthesia-related complications (2.92 ± 2.38 days, P < 0.0001). Overall, 96 women died in the deliveries studied, with a mortality rate of 10.3 deaths per 100,000 deliveries. Of the 96 maternal fatalities, 9.4% had at least one recorded anesthesia-related complication. Anesthesia-related complications during labor and delivery were associated with a 22-fold increased risk of maternal mortality (OR 22.26, 95% confidence interval 11.20–44.24).
DISCUSSION
Our study indicates that the incidence of anesthesia-related complications in labor and delivery was 0.46%, which varied markedly with the type of delivery, maternal preexisting medical conditions as measured by Charlson-Deyo Comorbidity Index, rural/urban area, and race. If corroborated by other researchers, these findings may provide valuable data for understanding and reducing the risk of obstetric anesthesia care. Cesarean delivery emerged as the most important risk factor for anesthesia-related complications, increasing the risk by 151% compared with vaginal delivery. Although cesarean delivery has long been recognized as a risk factor for maternal morbidity and mortality,19,20 our study provides quantitative data on the strength of the association between cesarean delivery and anesthesia-related complication with adjustment for maternal age, comorbidity, and other confounding factors. In our study, the proportion of cesarean deliveries increased from 27.5% in 2002 to 31.5% in 2005. These results are consistent with national statistics.21,22 A survey of approximately 1300 US hospitals that provide obstetric services found that only 6%–10% of mothers had no anesthesia during labor and delivery in 2001, as opposed to 11%–33% in 1992.23 With the cesarean delivery rate continuing to increase in the United States and many other countries,21,24,25 complications in cesarean delivery are an issue of increasing importance to obstetric anesthesia care.
Rural area is another risk factor for anesthesia-related complications in labor and delivery. Approximately 25% of the American population lives in rural areas but only 12.5% of surgeons practice there. Rural residents may have transportation barriers, less health workers per capita, and may take longer to seek treatment for their illnesses. It is estimated that <5% of practicing anesthesiologists work in rural areas.§ The heightened risk of anesthesia-related complications during labor and delivery for women living in rural areas may be due in part to these structural barriers to quality obstetric care. It was reported that women in rural areas receive significantly fewer epidurals than urban women during labor,26 which implies that the estimated risk associated with rural area reported in our study might be an underestimate.
There have been various case reports and studies describing the more complicated obstetric anesthetic management of women with specific preexisting complications, such as diabetes.27 Although it is expected that women with preexisting medical conditions may be more susceptible to the adverse effects of anesthesia, there are little empiric data substantiating the role of comorbidity in anesthesia-related complications during labor and delivery. Our study reaffirms that women in labor and delivery are generally a healthy group, with 97% of them having a 0 score on the Charlson-Deyo Comorbidity Index. Those who scored 1 or more on the Charlson-Deyo Comorbidity Index had a 47% higher risk of anesthesia-related complications in labor and delivery. The most common preexisting medical condition contributing to an elevated score on the Charlson-Deyo Comorbidity Index was chronic pulmonary disease, followed by diabetes.
We found that Caucasian women had a significantly higher incidence of anesthesia-related complications in labor and delivery than women in other racial groups. The higher incidence of anesthesia-related complications in Caucasian women may have resulted from their greater exposure to anesthetics and analgesics. Studies have shown that after controlling for factors such as insurance coverage and provider practice, Caucasian women in labor are more likely than African-American and Hispanic women to receive epidural analgesia.26,28 Moreover, the excess risk of anesthesia-related complications during labor and delivery in Caucasian women might be due in part to the fact that deliveries by Caucasian women are more likely to be nulliparous because they on average have fewer children than women in other racial groups.21 Nulliparous women are at an increased risk of complications compared with multiparous women.29
The risk of anesthesia-related complications increased slightly in scheduled admissions. The elevated risk associated with scheduled admissions is likely due to unmeasured confounders. Our data indicate that women who gave birth through scheduled admissions were more likely to have preexisting medical conditions and cesarean deliveries than women in the unscheduled admission group. Scheduled admissions may also be more likely to receive inductions and epidurals than unscheduled admissions. Although we controlled for method of delivery and comorbidity in the multivariate analysis, it is possible that the adjustment was inadequate because of the limited covariates and imperfect measurement of predelivery health status.
A few factors make it difficult to compare the results of this study with those in previous studies of anesthesia-related complications in labor and delivery. First, the majority of previous studies did not report anesthesia-related complications according to ICD-9-CM codes. Rather, they categorized complications by specific clinical manifestations, such as respiratory spasms, epidural hematoma, spinal headache, and neurological injury. Second, most previous studies of anesthesia-related complications in labor and delivery were limited to specific anesthesia techniques (e.g., epidural) or surgical procedures (e.g., cesarean section).3-13 In this study, we examined anesthesia-related complications in all deliveries in a defined population and time period regardless of anesthesia type. The spinal complications documented in our study are made up of spinal headache and root injury. Lastly, most previous studies were based on small or modest sample sizes. A meta-analysis showed that the reported incidence of epidural anesthesia-related complications was dependent on the sample size of the study, with smaller studies (<10,000 women) overestimating risk by 15-fold compared with larger ones.11 Our study sample is larger than all but one previous study, which was a retrospective review of epidural anesthesia complications involving 2,580,000 deliveries in the United Kingdom.6
Our study has several notable limitations. First, the reported incidence is subject to reporting bias. Although the hospital discharge data are collected and recorded using standardized protocols, anesthesia-related complications might be susceptible to underreporting and misclassification. Therefore, the incidence of anesthesia-related complications reported in this study is likely a conservative estimate. Studies investigating the validity of discharge data against medical records for reporting of maternal medical conditions and obstetric procedure and diagnoses have found accurate reporting of some codes (for example, cesarean deliveries, perineal lacerations, and diabetes) but poor coding of other conditions, such as asthma and postpartum complications.30-32 Because administrative data are being used increasingly for health services research, more studies assessing the data quality of hospital discharge records are needed.30
Second, information about anesthesia exposure is incomplete. The variable indicating anesthesia type was of limited use because data on this variable were missing for 30% of the deliveries. It is estimated that overall about 90% of women during labor and delivery receive some form of anesthesia.23 In the absence of complete data on anesthesia exposure, we calculated the incidence based on all deliveries, which should lead to an underestimation. The estimated ORs for the identified risk factors, however, appear to be reasonably robust given the consistent findings from the analysis restricted to cesarean deliveries.
Third, our study unit was delivery, not individual women. Many women may have given birth multiple times during the 4-yr study period. Each delivery was treated as an independent event in our analysis. Because the HCUP SID data do not allow us to link individual records over time, our analysis did not consider the possible intrasubject correlation in demographic and clinical variables. To assess this possible source of bias, we stratified the data according to single calendar year of admission. Results from the stratified analysis were similar to those based on the aggregated data.
Finally, the proprietary HCUP SID data do not contain any information on hospital characteristics. As such, we did not examine anesthesia-related complications in relation to hospital characteristics. The lack of hospital-level data may introduce bias to our results due to unmeasured confounding. Moreover, it curbs our ability to interpret some of the findings. For instance, we found that the incidence of anesthesia-related complications for women from rural areas was higher than that for those living in urban areas, but we do not know to what extent the excess risk was attributable to hospital characteristics in rural communities.
Nevertheless, this study is among the largest epidemiologic investigations of anesthesia-related complications during labor and delivery. The Agency for Healthcare Research and Quality has established patient safety indicators based on pertinent ICD-9 codes.∥ Many of these patient safety indicators have been assessed using hospital discharge data.33-35 Research on anesthesia safety indicators, however, has been scant. This study demonstrates that it is feasible to examine the epidemiology of anesthesia-related complications in a defined patient population using specific ICD-9 codes and readily accessible hospital discharge data. The findings regarding the incidence and risk factors of anesthesia-related complications during labor and delivery may provide valuable empiric data for developing interventions to improve obstetric care and serve as important benchmarks for program evaluation.
Acknowledgments
Ms. Khadeen Cheesman, a medical student, was supported by a fellowship grant from the Foundation for Anesthesia Education and Research Summer Program. Dr. Guohua Li and Ms. Joanne Brady were supported in part by grants R01AG13642 and R01AA09963 from the National Institutes of Health.
Dr. Pamela Flood is the wife of Dr. Shafer, Editor-in-Chief of Anesthesia & Analgesia. This manuscript was handled by Sorin J. Brull, Section Editor of Patient Safety and Dr. Shafer was not involved in any way with the editorial process or decision.
Footnotes
Available at: www.hcup-us.ahrq.gov/sidoverview.jsp. Accessed July 1, 2008.
Available at: www.hcup-us.ahrq.gov/toolssoftware/ccs/ccs.jsp. Accessed July 1, 2008.
Available at: http://www.nhtsa-tsis.net/ems/state/NY/appendix.doc. Accessed February 15, 2008.
Available at: http://www.qualityindicators.ahrq.gov/psi_overview.htm. Accessed July 28, 2008.
Available at: http://www.asahq.org/Newsletters/2006/12-06/schweitzer12_06.html. Accessed July 18, 2008.
REFERENCES
- 1.Hawkins JL. Anesthesia-related maternal mortality. Clin Obstet Gynecol. 2003;46:679–87. doi: 10.1097/00003081-200309000-00020. [DOI] [PubMed] [Google Scholar]
- 2.Stones W, Lim W, Al-Azzawi F, Kelly M. An investigation of maternal morbidity with identification of life-threatening ‘near miss’ episodes. Health Trends. 1991;23:13–5. [PubMed] [Google Scholar]
- 3.Jenkins JG. Some immediate serious complications of obstetric epidural analgesia and anaesthesia: a prospective study of 145,550 epidurals. Int J Obstet Anesth. 2005;14:37–42. doi: 10.1016/j.ijoa.2004.07.009. [DOI] [PubMed] [Google Scholar]
- 4.Holdcroft A, Gibberd FB, Hargrove RL, Hawkins DF, Dellaportas CI. Neurological complications associated with pregnancy. Br J Anaesth. 1995;75:522–6. doi: 10.1093/bja/75.5.522. [DOI] [PubMed] [Google Scholar]
- 5.Scott DB, Tunstall ME. Serious complications associated with epidural/spinal blockade in obstetrics: a two-year prospective study. Int J Obstet Anesth. 1995;4:133–9. doi: 10.1016/0959-289x(95)82967-f. [DOI] [PubMed] [Google Scholar]
- 6.Scott DB, Hibbard BM. Serious non-fatal complications associated with extradural block in obstetric practice. Br J Anaesth. 1990;64:537–41. doi: 10.1093/bja/64.5.537. [DOI] [PubMed] [Google Scholar]
- 7.Jenkins JG. Complications of obstetric epidurals: an audit of 10,817 cases. Int J Obstet Anesth. 1998;7:280–1. doi: 10.1016/s0959-289x(98)80059-9. [DOI] [PubMed] [Google Scholar]
- 8.Paech MJ, Godkin R, Webster S. Complications of obstetric epidural analgesia and anaesthesia: a prospective analysis of 10,995 cases. Int J Obstet Anesth. 1998;7:5–11. doi: 10.1016/s0959-289x(98)80021-6. [DOI] [PubMed] [Google Scholar]
- 9.Palot M, Visseaux H, Botmans C, Pire JC. Epidemiology of complications of obstetrical epidural analgesia. Cah Anesthesiol. 1994;42:229–33. [PubMed] [Google Scholar]
- 10.Crawford JS. Some maternal complications of epidural analgesia for labour. Anaesthesia. 1985;40:1219–25. doi: 10.1111/j.1365-2044.1985.tb10664.x. [DOI] [PubMed] [Google Scholar]
- 11.Ruppen W, Derry S, McQuay H, Moore RA. Incidence of epidural hematoma, infection, and neurologic injury in obstetric patients with epidural analgesia/anesthesia. Anesthesiology. 2006;105:394–9. doi: 10.1097/00000542-200608000-00023. [DOI] [PubMed] [Google Scholar]
- 12.Holdcroft A, Morgan M. Maternal complications of obstetric epidural analgesia. Anaesth Intensive Care. 1976;4:108–12. doi: 10.1177/0310057X7600400204. [DOI] [PubMed] [Google Scholar]
- 13.Bloom SL, Spong CY, Weiner SJ, Landon MB, Rouse DJ, Varner MW, Moawad AH, Caritis SN, Harper M, Wapner RJ, Sorokin Y, Miodovnik M, O’Sullivan MJ, Sibai B, Langer O, Gabbe SG. National Institute of Child Health and Human Development Maternal-Fetal Med Units Network. Complications of anesthesia for cesarean delivery. Obstet Gynecol. 2005;106:281–7. doi: 10.1097/01.AOG.0000171105.39219.55. [DOI] [PubMed] [Google Scholar]
- 14.Chadwick HS. An analysis of obstetric anesthesia cases from the American society of anesthesiologists closed claims project database. Int J Obstet Anesth. 1996;5:258–63. doi: 10.1016/s0959-289x(96)80047-1. [DOI] [PubMed] [Google Scholar]
- 15.Kuklina EV, Whiteman MK, Hillis SD, Jamieson DJ, Meikle SF, Posner SF, Marchbanks PA. An enhanced method for identifying obstetric deliveries: implications for estimating maternal morbidity. Matern Child Health J. 2008;12:469–77. doi: 10.1007/s10995-007-0256-6. [DOI] [PubMed] [Google Scholar]
- 16.Charlson ME, Pompei P, Ales KL, MacKenzie CR. A new method of classifying prognostic comorbidity in longitudinal studies: development and validation. J Chronic Dis. 1987;40:373–83. doi: 10.1016/0021-9681(87)90171-8. [DOI] [PubMed] [Google Scholar]
- 17.Deyo RA, Cherkin DC, Ciol MA. Adapting a clinical comorbidity index for use with ICD-9-CM administrative databases. J Clin Epidemiol. 1992;45:613–9. doi: 10.1016/0895-4356(92)90133-8. [DOI] [PubMed] [Google Scholar]
- 18.Quan H, Sundararajan V, Halfon P, Fong A, Burnand B, Luthi JC, Saunders LD, Beck CA, Feasby TE, Ghali WA. Coding algorithms for defining comorbidities in ICD-9-CM and ICD-10 administrative data. Med Care. 2005;43:1130–9. doi: 10.1097/01.mlr.0000182534.19832.83. [DOI] [PubMed] [Google Scholar]
- 19.Pallasmaa N, Ekblad U, Gissler M. Severe maternal morbidity and the mode of delivery. Acta Obstet Gynecol Scand. 2008;87:662–8. doi: 10.1080/00016340802108763. [DOI] [PubMed] [Google Scholar]
- 20.Panchal S, Arria AM, Labhsetwar SA. Maternal mortality during hospital admission for delivery: a retrospective analysis using a state-maintained database. Anesth Analg. 2001;93:134–41. doi: 10.1097/00000539-200107000-00028. [DOI] [PubMed] [Google Scholar]
- 21.Martin JA, Hamilton BE, Sutton PD, Ventura SJ, Menacker F, Kirmeyer S, Munson ML. Births: final data for 2005. Natl Vital Stat Rep. 2007;56:1–104. [PubMed] [Google Scholar]
- 22.Martin JA, Hamilton BE, Ventura SJ, Menacker F, Park MM, Sutton PD. Births: final data for 2001. Natl Vital Stat Rep. 2002;51:1–103. [PubMed] [Google Scholar]
- 23.Bucklin BA, Hawkins JL, Anderson JR, Ullrich FA. Obstetric anesthesia workforce survey: twenty-year update. Anesthesiology. 2005;103:645–53. doi: 10.1097/00000542-200509000-00030. [DOI] [PubMed] [Google Scholar]
- 24.Villar J, Valladares E, Wojdyla D, Zavaleta N, Carroli G, Velazco A, Shah A, Campodónico L, Bataglia V, Faundes A, Langer A, Narváez A, Donner A, Romero M, Reynoso S, de Pádua KS, Giordano D, Kublickas M, Acosta A, WHO 2005 global survey on maternal and perinatal health research group Caesarean delivery rates and pregnancy outcomes: the 2005 WHO global survey on maternal and perinatal health in Latin America. Lancet. 2006;367:1819–29. doi: 10.1016/S0140-6736(06)68704-7. Erratum in: Lancet 2006;368:580. [DOI] [PubMed] [Google Scholar]
- 25.Betrán AP, Merialdi M, Lauer JA, Bing-Shun W, Thomas J, Van Look P, Wagner M. Rates of caesarean section: analysis of global, regional and national estimates. Paediatr Perinat Epidemiol. 2007;21:98–113. doi: 10.1111/j.1365-3016.2007.00786.x. [DOI] [PubMed] [Google Scholar]
- 26.Rust G, Nembhard WN, Nichols M, Omole F, Minor P, Barosso G, Mayberry R. Racial and ethnic disparities in the provision of epidural analgesia to Georgia Medicaid beneficiaries during labor and delivery. Am J Obstet Gynecol. 2004;191:456–62. doi: 10.1016/j.ajog.2004.03.005. [DOI] [PubMed] [Google Scholar]
- 27.Kaufman I, Bondy R, Benjamin A. Peripartum cardiomyopathy and thromboembolism; anesthetic management and clinical course of an obese, diabetic patient. Can J Anaesth. 2003;50:161–5. doi: 10.1007/BF03017850. [DOI] [PubMed] [Google Scholar]
- 28.Glance LG, Wissler R, Glantz C, Osler TM, Mukamel DB, Dick AW. Racial differences in the use of epidural analgesia for labor. Anesthesiology. 2007;106:19–25. doi: 10.1097/00000542-200701000-00008. [DOI] [PubMed] [Google Scholar]
- 29.Majoko FM, Nyström L, Munjanja SP, Mason E, Lindmark G. Relation of parity to pregnancy outcome in a rural community in Zimbabwe. Afr J Reprod Health. 2004;8:198–206. [PubMed] [Google Scholar]
- 30.Hadfield RM, Lain SJ, Cameron CA, Bell JC, Morris JM, Roberts CL. The prevalence of maternal medical conditions during pregnancy and a validation of their reporting in hospital discharge data. Aust N Z J Obstet Gynaecol. 2008;48:78–82. doi: 10.1111/j.1479-828X.2007.00818.x. [DOI] [PubMed] [Google Scholar]
- 31.Romano PS, Yasmeen S, Schembri ME, Keyzer JM, Gilbert WM. Coding of perineal lacerations and other complications of obstetric care in hospital discharge data. Obstet Gynecol. 2005;106:717–25. doi: 10.1097/01.AOG.0000179552.36108.6d. [DOI] [PubMed] [Google Scholar]
- 32.Yasmeen S, Romano PS, Schembri ME, Keyzer JM, Gilbert WM. Accuracy of obstetric diagnoses and procedures in hospital discharge data. Am J Obstet Gynecol. 2006;194:992–1001. doi: 10.1016/j.ajog.2005.08.058. [DOI] [PubMed] [Google Scholar]
- 33.Miller MR, Elixhauser A, Zhan C. Patient safety events during pediatric hospitalizations. Pediatrics. 2003;111:1358–66. doi: 10.1542/peds.111.6.1358. [DOI] [PubMed] [Google Scholar]
- 34.West AN, Weeks WB, Bagian JP. Rare adverse medical events in VA inpatient care: reliability limits to using patient safety indicators as performance measures. Health Serv Res. 2008;43:249–66. doi: 10.1111/j.1475-6773.2007.00760.x. [DOI] [PMC free article] [PubMed] [Google Scholar]
- 35.Zhan C, Miller MR. Excess length of stay, charges, and mortality attributable to medical injuries during hospitalization. JAMA. 2003;290:1868–74. doi: 10.1001/jama.290.14.1868. [DOI] [PubMed] [Google Scholar]