Abstract
Extracellular appendages of the dissimilatory metal-reducing bacterium Shewanella oneidensis MR-1 were recently shown to sustain currents of 1010 electrons per second over distances of 0.5 microns [El-Naggar et al., Proc. Natl. Acad. Sci. U. S. A., 2010, 107, 18127]. However, the identity of the charge localizing sites and their organization along the “nanowire” remain unknown. We use theory to predict redox cofactor separation distances that would permit charge flow at rates of 1010 electrons per second over 0.5 microns for voltage biases of ≤1V, using a steady-state analysis governed by a non-adiabatic electron transport mechanism. We find the observed currents necessitate a multi-step hopping transport mechanism, with charge localizing sites separated by less than 1 nm and reorganization energies that rival the lowest known in biology.
1 Introduction
Biological systems are challenged to move charge efficiently over large distances.1–3 In the crowded environment of the cell, intricate redox machines orchestrate local charge flow coupled to energy storage and release.4 Much is known about single step biological electron transfer (ET) at short distances.5–7 However, recent work on the gram negative bacterium Shewanella oneidensis MR-1 has challenged our conventional view of charge flow in biology.8
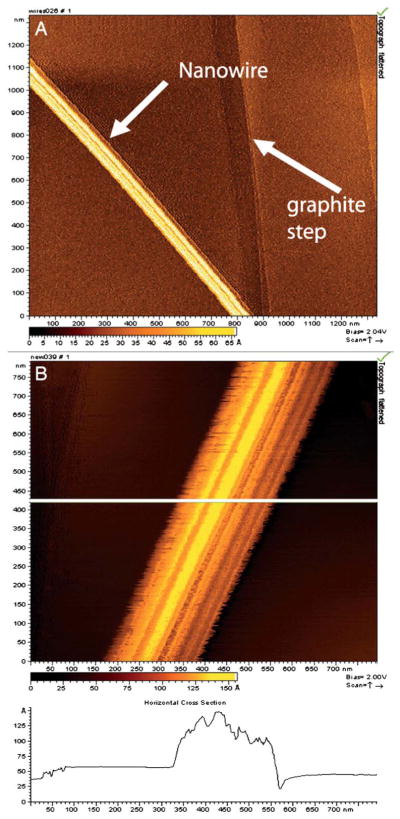
When its environment is depleted of soluble electron acceptors such as oxygen, S. oneidensis MR-1 grows long, pilus-like appendages that have been called “nano-wires” (see Fig. 1).8,9 By conductive probe atomic force microscopy (cpAFM), these pili were shown to sustain charge flow at rates of up to 1010 electrons per second over distances of 0.5 microns for low voltage biases (≤1 V).
Fig. 1.
STM images of isolated nanowires from wild-type MR-1, with a lateral diameter of 100 nm and a topographic height of between 5 and 10 nm.9 (A) Arrows indicate the location of a nanowire and a step on the graphite substrate. (B) Higher magnification showing ridges and troughs running along the long axis of the structures. Figure reproduced with permission. Copyright (2006) National Academy of Sciences, U.S.A.
What are the charge localizing sites responsible for these high currents? What is the mechanism of charge transport along a “nanowire”? Why should MR-1 be “wired” at all?
Strong arguments have been made that a ten-heme c-type cytochrome, MtrC, is the charge localizing site responsible for the observed currents.8,10 However, there is no crystal structure of MtrC available, nor is there any information concerning the packing density along the pilus.
The aim of this paper is to explore potential mechanisms that could give rise to the fast charge flow rates. Several mechanisms come to mind, ranging from fully incoherent hopping—characteristic of biological ET—to fully coherent band transport—characteristic of metals and semiconducting materials. We explore the two extremes of this spectrum. Our theoretical analysis sheds light on the physical parameters necessary to give rise to the steady-state currents observed in S. oneidensis MR-1 pili.
2 Methods
We use two approaches to model hopping transport along “nanowires”. In the first, we solve a kinetic master equation for the steady-state current. In the second, we use the Einstein–Smoluchowski formula to calculate charge mobilities based on hopping rate constants. Both models of charge hopping involve fitting a set of parameters to the experimental current–voltage measurements of El-Naggar et al.,8 an example of which is reprinted in Fig. 3. We aim to elucidate the charge hopping site distance and energetic constraints that the pili must satisfy. How far apart are the charge hopping sites? Are they localized only on the surface or found throughout the “nanowire” interior? We describe both hopping methods briefly below, but save the treatment of band transport for the results section.
Fig. 3.
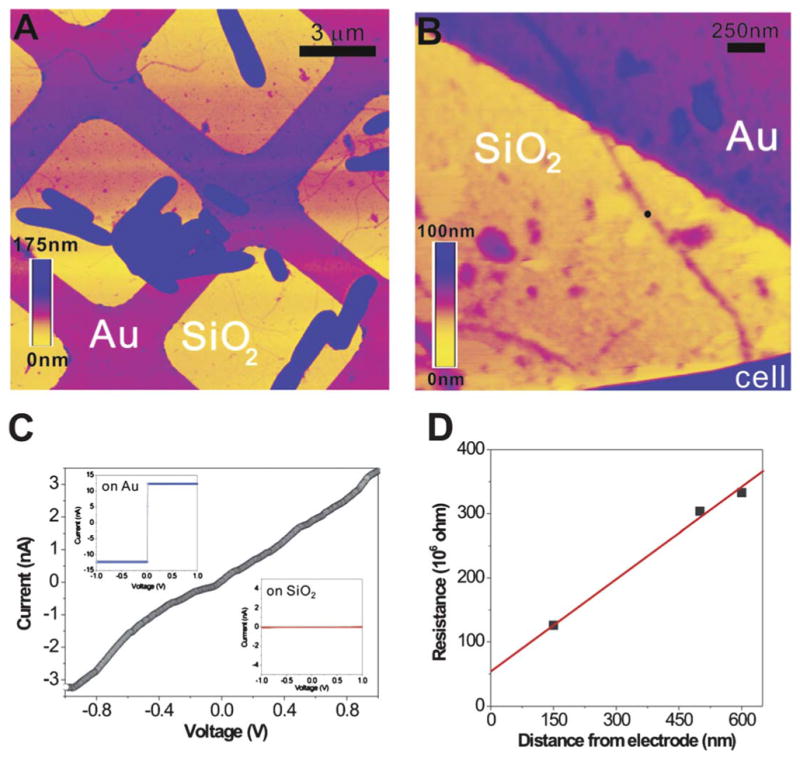
CP-AFM of a bacterial nanowire.8 (A) Topographic AFM image showing air-dried S. oneidensis MR-1 cells and extracellular appendages deposited randomly on a SiO2/Si substrate patterned with Au microgrids. (B) Contact mode AFM image showing a nanowire reaching out from a bacterial cell to the Au electrode. (C) An I–V curve obtained by probing the nanowire at a length of 600 nm away from the Au electrode (at the position marked by the black dot in B). (Inset) The I–V curves obtained on bare Au and SiO2, respectively. (D) A plot of total resistance as a function of distance between CP-AFM tip and the Au electrode. Figure reproduced with permission. Copyright (2010) National Academy of Sciences, U.S.A.
2.1 Kinetic master equation
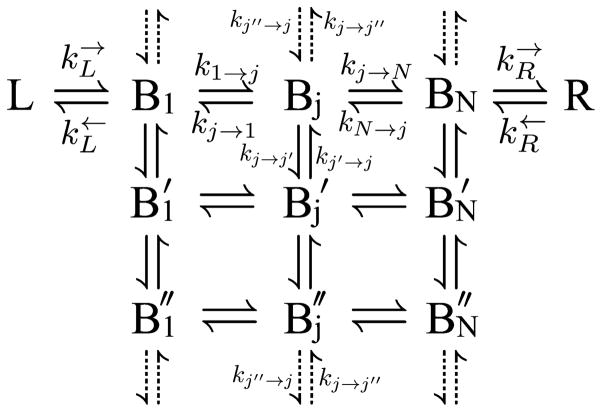
We model a donor–bridge–acceptor system, such as that shown in Fig. 2, by solving a kinetic master equation of the form
Fig. 2.
The two dimensional rate mechanism consisting of a left electrode (L), a set of bridge sites {Bj}, a right electrode (R), and the transitions between them {k}. We define a “row” as all the bridge sites with the same identifying tick mark, and the total number of “rows” as Nrow. A “column” is all the sites with the same number subscript, and the total number of “columns” is Ncol. Cylindrical boundary conditions are satisfied when the vertical transitions described by the dotted arrows are included. The dotted transitions connect the last row of bridge sites with the first row. The mechanism can be generalized to more sites coupled in from the left electrode {L} and coupled out to the right electrode {R}.
| (2.1) |
where ki→j is the rate constant for the transition from site i with time-dependent population Pi to site j with time-dependent population Pj, and η is the number of hopping sites.
Transition rates between bridge sites are given by the non-adiabatic ET rate equation11
| (2.2) |
where HDA is the charge transfer integral between donor and acceptor, λ is the reorganization free energy and ΔG is the change in free energy upon charge transfer. We use eqn (2.2) in the phenomenological form3
| (2.3) |
where rnn is the nearest neighbor hopping distance, r0 is the distance at van der Waals contact (which we take to be 0.35 nm), and 1013 s−1 is the maximum rate of activationless (λ = −ΔG) charge transfer at contact.
Both donor and acceptor in our kinetic mechanism are electrodes, which necessitates the use of the electrochemical form12 of the non-adiabatic ET rate equation for the rate constants to and from these sites (see eqns (A.5) and (A.6) in Appendix). The chemical potential difference (ΔμRL ≡ μR − μL) between the two electrodes drives charge flow explicitly via the electrochemical rate equations and through a linear potential drop along the pilus, with hopping free energies given by ΔμRL/(N + 1), where N is the number of bridge sites in one dimension between the left and right electrodes. For transitions that are transverse to the electric field between the electrodes, ΔG was taken to be zero.
If the kinetic mechanism described by the master equation ends with an irreversible step (i.e., in Fig. 2), integration of eqn (2.1) from t = 0 to t = ∞ gives the flux balance condition13
| (2.4) |
where the population on site i falls to zero at t = ∞ due to the irreversible step to the charge sink. In eqn (2.4), τi is the mean residence time at site i,13,14
| (2.5) |
The sum of all the residence times normalized by the initial populations gives the mean first passage time, 〈t〉,
| (2.6) |
which is the average time for a particle to traverse the bridge from the initially prepared state (here, an electrode) to the sinks (here, the other electrode).13–15 We define an effective rate constant through the pathway as keff ≡ 1/〈t〉.15 We note that, as a steady-state quantity, the mean first passage time does not necessitate finding and integrating the time-dependent populations from the master equation. Instead, one can work directly with the nullspace16 of the matrix of rate constants, Kss, which solves the equation Kssp⃗ss = 0, where p⃗ss is the (η − c) × 1 steady-state population vector of a system of η sites with c sinks, (see Appendix A.2).
We have written MATLAB code that solves for the effective steady-state rate constant of a particle traversing a nonequilibrium pathway from the electrode of higher chemical potential to the electrode of lower chemical potential. We define the current (I) as
| (2.7) |
where n< is the smaller of the number of sites coupled to the left or right electrode (see Appendix A.2 for more detail). We explore one and two dimensional mechanisms, including two dimensional cylindrical boundary conditions (see Fig. 2) with relevance to the charge hopping site distribution on the surface of the cylindrical pilus.
2.2 Einstein relation
MR-1 pili display ohmic currents in response to an applied voltage. We calculate this linear response by the following relationships:
| (2.8) |
where R is the resistance, I is the current, L is the length between electrodes, A is the cross-sectional area of the pilus, σ is the conductivity, e is the electron charge,
 is the charge hopping site density and V is the applied voltage. The charge mobility, μ, has units of a diffusion constant per unit of applied voltage, and can be related to a hopping rate constant (khop, eqn (2.3)) by17
| (2.9) |
where r is the distance between hopping sites. This definition of the mobility in 3D is the Einstein–Smoluchowski equation with diffusion constant . Substitution of (2.9) into (2.8) gives the ohmic hopping current:
| (2.10) |
3 Results
We aim to model a particular experiment described in Figs 3 and 4.8 S. oneidensis MR-1 cells were chemically fixed and dried onto a SiO2 substrate with a gold microgrid electrode (Fig. 3A). A Pt/Cr-coated AFM tip was used as the second electrode to probe the current response of the pilus along different lengths from the gold grid. A voltage bias between the electrodes was swept from −1 to 1 V at a rate of 0.2 Hz. The longest distance probed along the pilus was 600 nm and contact-mode AFM was used to estimate its cross-sectional area to be ~80 nm2. We use these parameters to explore the physical constraints that the pilus must satisfy to sustain nanoAmp currents. We employ a master equation (see eqn (2.1)) to elucidate 1D and 2D hopping and use the Einstein relation to explore a cylindrical shell and 3D packing.
Fig. 4.
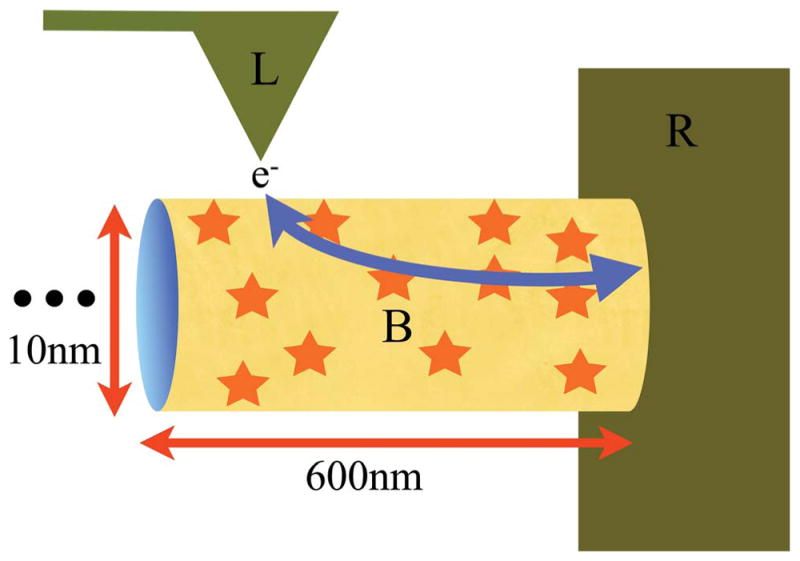
Schematic of electron flow through a bacterial nanowire. The labels L, B and R stand for Left electrode, Bridge and Right electrode, respectively. Here, L is the conductive AFM tip of the experiment, B is the bacterial pilus and R is the gold grid shown in Fig. 3. The arrow gives the path of the electrons, with direction depending on the sign of the chemical potential difference between the electrodes. The star symbols on the pilus represent charge carriers on the surface. The “…” represents the pilus extending in length far to the left. The segment length of the pilus between the electrodes is 600 nm. The height and width of the ellipsoidal pilus is approximated by a diameter of 10 nm.
3.1 Hopping currents via the master equation
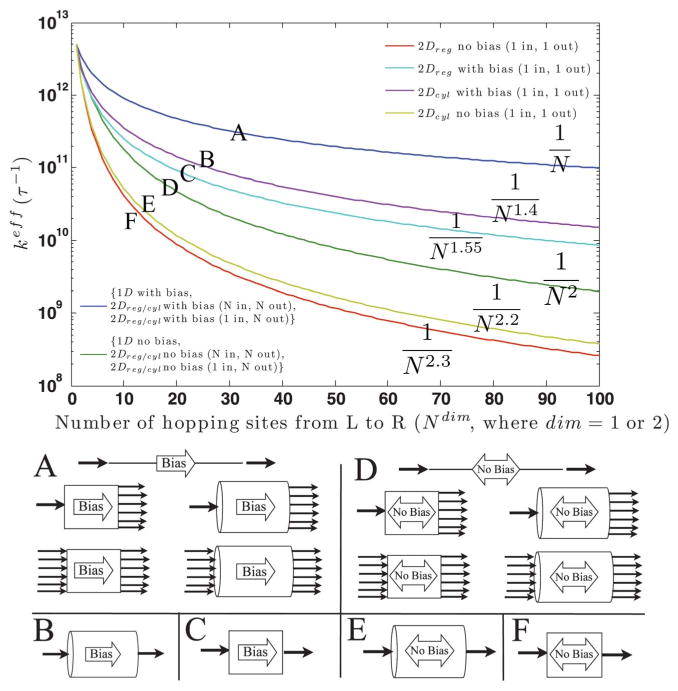
What controls the conductivity of the pili? We explored the effects of dimensionality and cylindrical boundary conditions on the effective net rate constant of charge flow between the electrodes for a given potential difference. Shown numerically in Fig. 5 (and proven analytically in the Appendix), the effective rate constant through a 1D unidirectional hopping pathway scales as 1/N, with N the number of hopping sites. For flow biased from the left to the right electrode, the 2D and 2D cylindrical mechanisms behave identically to the 1D case if each row (see Fig. 2 for nomenclature) has an irreversible exit channel to the right electrode.
Fig. 5.
The hopping number dependence of the mean rate through a 1 or 2 dimensional bridge. The injection into and ejection out of the bridge were modeled as irreversible for each scenario in order to achieve a net flux from L to R. Lines labeled “with bias” have all backward rate constants set to zero. All other rate constants were k = 1013 s−1. “No bias” means forward and backward rate constants were equal, excepting the injection and ejection rate constants which have no backward rate. 2Dreg refers to a “regular” 2D lattice of hopping sites. 2Dcyl refers to a cylindrical and therefore periodic lattice of hopping sites. From the figure, one can estimate order of magnitude drops in the effective rate constant as a function of the number of hopping steps, with the assumption that all hopping rate constants throughout the kinetic scheme are equal. The effective rate constants decay by a power law with the number of sites, N. Each line is labeled with its fitted distance dependence and a letter A through F, corresponding to its diagramatic representation below.
Diffusional transport was modeled by setting equal the forward and backward hopping rates through the bridge while keeping an irreversible step at the left and right electrodes. The 1D case (Fig. 5, green) shows a 1/N2 dependence representative of diffusion.18 Slightly higher order distance dependencies were observed for the 2D mechanisms when only one site coupled into the bridge from the left electrode and one site coupled out to the right electrode (Fig. 5, yellow and red). This can be rationalized by definition of the mean first passage time as the sum of the local residence times at each site. In a 2D mechanism on a square lattice, there are N2 − N more sites than in 1D.
Cylindrical boundary conditions slightly soften the decay with distance relative to the 2D mechanism without them, but do not contribute to any noticeable increase in transport efficiency when all rows feed into the sink. We believe that the 2D cylindrical model with a variable number of sites coupled to the AFM tip and the full cross-sectional area coupled to the gold grid (see Fig. 4) is the most appropriate to describe the experiments, but accede that the 1D case provides an indistinguishable approximation when all bridge rows couple to the electrode (Fig. 5, green).
The current will scale with the number of sites coupled to the electrode, as in eqn (2.7). The lowest current is given by the effective rate constant itself. The maximum current is this rate constant multiplied by the densest concentration of sites possible at the electrode. We estimate that an AFM tip of typical radius ~50 nm, if plunged1 nm into the pilus interior, could have a surface coverage of ~103 carriers (for a maximum carrier surface density of (1/.35 nm)2, appropriate to closely packed molecular materials). This is similar in magnitude to the number of localizing sites that could pack into the cross sectional area of a pilus approximated as a cylindrical shell of thickness 1 nm and outer radius 5 nm. At most we can scale by ~103 the magnitude of the current given by the 2D mechanism.
Assuming the applied potential varies linearly along the pilus, the energetic driving force for charge flow would be ~1/600 eV nm−1. Hopping sites separated by 1 nm would feel a driving force an order of magnitude less than thermal energy at room temperature. Therefore, the charge transport along the pilus would be dominated by diffusion and exhibit a ~1/N2 dependence on the number of hopping sites.
Through calculations governed by eqn (2.7), we identify restrictions on the charge transfer parameters given in Table 1. The effective transport rate is sensitive to the distance (rnn) between charge localizing sites. If rnn increases, Ncol, will decrease (Ncol ≡ L/rnn, where L is the distance between the electrodes), but the former gives an exponential dependence to the nearest neighbor hopping rate while the latter gives a near-inverse-quadratic dependence to the effective transport rate. Specifically, the effective rate constant for transport through the pilus was found to decrease as ~1/N1.85, different from the characteristic diffusional 1/N2 dependence due to the small but non-zero hopping bias. We note that our calculations will not yield nanoAmp currents if the pilus couples to the AFM tip by ten or even one hundred sites. In this case, we are forced to break the non-adiabatic “speed limit”3 of in order to account for the rates. For ~1000 contacts, rnn < 1 nm and λ ≤ 0.3 eV, the observed currents are described by the master equation for site to site hopping along a cylindrical shell of thickness 1 nm.
Table 1.
Constraints on the hopping distance between charge carriers and on the reorganization energy (λ) as calculated via the master equation for the 2D cylindrical mechanism, assuming ~1000 sites couple to each electrode. The parameters were fit to eqn (2.7) to give a current magnitude on the order of 1010e s−1. The length of the pilus was taken as 600 nm, kBT = 1/40 eV and β = 10 nm−1. Ncol is the number of columns in the 2D mechanism (the maximum value of a bridge site subscript in Fig. 2), with 1000 rows. k° is the heterogeneous electron transfer rate constant at zero potential bias (see Appendix A.1). λ values listed are values for charge transfers within the bridge. The electrochemical λ was taken as 1/2 the value for the bridge hops. Note that the measured current magnitude could not be achieved for n = 10 or 100 without exceeding a charge transfer kinetic limit3 of 1013 s−1
| rnn (nm) | Ncol | λ (eV) | k° (s−1) | ΔG (eV) |
|---|---|---|---|---|
| 0.35 | 1700 | ≤0.3 | ≥1010 | 0.0006 |
| 0.5 | 1200 | ≤0.21 | ≥1010 | 0.0008 |
| 0.7 | 860 | ≤0.1 | ≥1010 | 0.0012 |
| 1 | 600 | ≤0.01 | ≥1010 | 0.0017 |
3.2 Hopping mobility via the Einstein relation
From the slope of the current–voltage curve in Fig. 3C, the conductance (1/R) is approximated as ~3.2 × 10⁻⁹ C s−1 V−1. The resistance is then 3.1 × 10⁸ Ω, where Ω is the symbol for ohms, or V/Amps. A contact resistance of 5.8 × 10⁷ Ω between the pilus and electrode was estimated by El-Naggar et al. by measuring resistance as a function of distance from the cpAFM tip to the gold electrode (see Fig. 3D).8 The intrinsic resistance along the 600 nm “nanowire” is then ~2.5 × 10⁸ Ω. Any theory accounting for the magnitude of these currents must establish a resistance of this order. With R defined in this way, the resistivity (ρ) is calculated by ρ = RA/L, where A is the cross-sectional area of the pilus and L is the segment length. Using the full cross-sectional area of the pilus, a resistivity of ρ = 30 Ω cm is obtained, a value comparable to that of moderately doped silicon nanowires.8 If the charge localizing sites fill the pilus volume, the conductivity of the pilus is
| (3.1) |
where the units are given in parentheses and S is siemens (ohms−1). Substituting the value of the conductivity from (3.1) into σ =
 eμ and utilizing eqn (2.9), we discern possible restrictions on the microscopic parameters that govern charge flow, shown in Table 2. We repeat the process assuming only the outer surface of the pilus contains the charge localizing sites. In this case the cross-sectional area is that of a cylindrical shell of width ~1 nm and outer radius of 5nm. Restrictions on microscopic parameters for this case are also shown in Table 2.
Table 2.
Constraints on the hopping distance between redox sites and on the reorganization energy (λ) for an experimentally measured resistance of 250 MΩ. The parameters were fit to the equation σ =
 eμ with μ given by eqn (2.9) to give the conductivity using (1) the cross-sectional area and volume (Vfull) of the full pilus (σ = 1/30 S cm−1) and (2) the cross-sectional area and volume (Vshell) of the outer cylindrical shell of the pilus with thickness 1 nm (σ = 1/4 S cm−1). In both cases, the length of the pilus was taken as 600 nm, kBT = 1/40 eV, β = 10 nm−1, and the number density of charge carriers,
 , is given by
. Note that for carriers localized on the exterior of the pilus, the measured conductivity could not be achieved at rnn > 1 nm even if λ was set to zero
| rnn (nm) | λ for Vfull (eV) | λ for Vshell (eV) |
|---|---|---|
| 0.35 | ≤0.85 | ≤0.75 |
| 0.5 | ≤0.67 | ≤0.57 |
| 0.7 | ≤0.40 | ≤0.27 |
| 1 | ≤0.10 | ≤0.01 |
We observe that for both models (Vshell and Vfull, respectively), the pilus must be tightly packed with charge carriers that are embedded in an environment particularly suited for charge transfer. Summarizing the results obtained from the Einstein relation and from the master equation formalism of section 3.1, the large, experimentally observed currents are well described by a diffusive charge hopping model, assuming all available charge localizing sites in the pilus between the two electrodes contribute to the observed current, with λ ≤ 0.85 eV and rnn ≤1 nm.
3.3 The applicability of band theory
Charge flow in S. oneidensis MR-1 “nanowires” has been proposed to occur by band transport.19 Charge flow via band conduction is subject to the uncertainty principle constraint and the condition that carriers scatter into states with energy shifts that are small compared to the band width:17
| (3.2) |
where
 is the scattering time of the carriers and W is the width of the energy band, defined as W = 4|HDA|, with |HDA| the effective charge transfer integral between the charge localizing units.17 The mobility in band theory is17
| (3.3) |
Substitution of |HDA| given by eqn (3.3) into eqn (3.2) gives
| (3.4) |
which is the equation for the validity of band transport theory. In typical π-stacked materials and organic polymers, rnn is 0.35 nm.17 This value for rnn constrains μBT to be greater than ~1 cm2 V−1 s−1 for band theory to accurately describe the charge transport. The mobility is related to the conductivity (σ) by σ =
 eμBT, where
 is the charge carrier density. Using a number density appropriate to closely packed molecular materials (
 ≈25 nm−3) and the experimentally determined conductivity of the bacterial pilus (~1 S cm−1), one arrives at a mobility of ~10−4 cm2 V−1 s−1 for the pilus, much less than the magnitude needed for band theory to be applicable. We note that for lower carrier densities, the mobility in general will increase for a given conductivity, but so will the uncertainty principle constraint on the magnitude of μBT. For a uniform packing density equal to
, the relationship for the rnn that satisfies the uncertainty principle constraint is
| (3.5) |
and for a conductivity of σ = 1 S cm−1, rnn ≫ 103 nm. The distance between nearest neighbor sites of the pilus would need to be greater than the distance between the electrodes for band theory to accurately describe the charge transport!
4 Discussion
The measured currents through MR-1 pili challenge our traditional views of charge transfer in biology. Without a multiplicative factor of ~1000, corresponding to the number of carriers in the pilus coupled to the electrodes, a hopping model can not account for the reported currents of nanoAmps while hopping steps remain under the non-adiabatic charge transfer “speed limit.” A completely unidirectional mechanism that scales as 1/N could account for the current magnitude but not for its symmetry under sign inversion of the potential bias (see Fig. 3C). If the wire were “designed” to favor charge transfer in one direction, it would disfavor transfer in the other.
Would charge delocalization over a range of sites bolster the effective transport rate? Delocalization across n sites dilutes the wavefunction amplitude by .20 The charge transfer rate constant depends on the squared overlap of the donor and acceptor wave functions, so a delocalization over n sites must be accompanied by a dilution of the hopping rate constant by 1/n2. If the hopping distance from de-localized site to delocalized site remains the same as the distance from localized to localized, the gains from delocalization are canceled by the diffusive nature of the transport, assuming that other charge transfer parameters are weakly influenced by the delocalization. Explicitly for a non-cofacial hopping site arrangement, a reduction by n in the number of hopping sites will increase the net diffusive transport rate constant by n2 but will decrease the hopping rate constant by 1/n2.
How many redox sites couple to the cpAFM tip? For hopping governed by a master equation, ten will not suffice to describe the currents. We note that among the two hopping models, there is only limited disagreement in the parameter constraints. The master equation restricts reorganization energies to be slightly lower than those allowed by the Einstein relation. However, both formalisms agree on the maximum distance between charge carriers of ~1 nm. We conclude that the charge localizing sites must be very closely packed with reorganization energies at the lower limit of what is known in biology.21 Still, the environment probed in the experiments was not the native one. The bacteria were chemically fixed with aldehydes that cross-link proteins and then air dried. These conditions may lead to more rigid structures with lower charge transfer reorganization energies than in vivo.
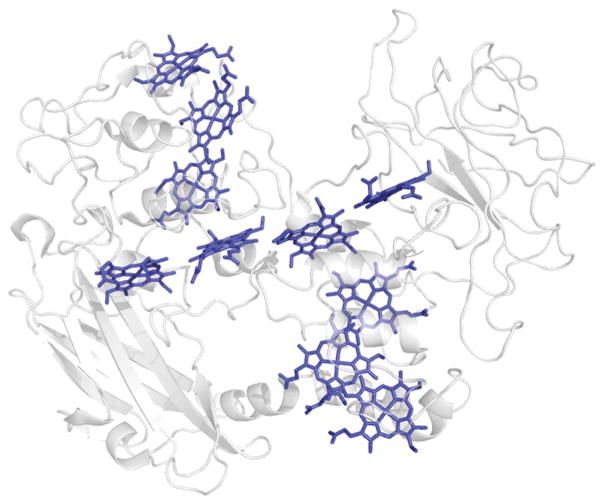
c-Type cytochromes have been strongly implicated as the charge carriers along bacterial “nanowires”.8,23,41 Indeed, a c-type cytochrome was recently shown via transmission electron microscopy to be aligned along the conductive pili of Geobacter sulfurreducens, albeit separated by distances prohibitive for interprotein charge transfer (>20 nm).22 The identity of the charge localizing site present on the pilus of Shewanella oneidensis MR-1 has yet to be conclusively shown. Recently, the crystal structure of MtrF, an important decaheme cytochrome in Shewanella oneidensis MR-1, was solved.23 The structure reveals a linear arrangement of 8 of the 10 hemes, with edge-to-edge spacings less than 0.7 nm, compatible with our modeled rnn (see Fig. 6). Could arrays of proteins such as this generate the “conductive ridges” in Fig. 1?
Fig. 6.
Decaheme cytochrome MtrF from Shewanella oneidensis MR-1. Notice the close spacing of the Fe hemes, with typical edge-to-edge distance of ≤0.7 nm. pdb: 3pmq.23
Alternate sites of conduction have also been proposed.41 Charge transfer may occur through hole hopping between stacked aromatic amino acids of the pilus protein subunit. However, the relative distances between stacked aromatic residues in the pilus remain unknown.
Our numerical finding of section 1 can be summarized by a simple, approximate equation for the current (I): I = n<keff = n<khop/N1.85, with N the number of hopping steps. To find the current, one must multiply the effective rate constant by a factor (n<) equal to the minimum number of contacts at both electrodes. Explicitly, for ΔG = 0, the relationship for the current becomes (based on the master equation results of section 1)
| (4.1) |
The relationship between n< and rnn is shown graphically for a few cases in Fig. 7. For λ = 0.2 eV, rnn = 0.35 nm, β = 10 nm−1, L = 600 nm, and kBT = 1/40 eV, about 3000 bridge contacts with each electrode must be established to achieve a nanoAmp current.
Fig. 7.
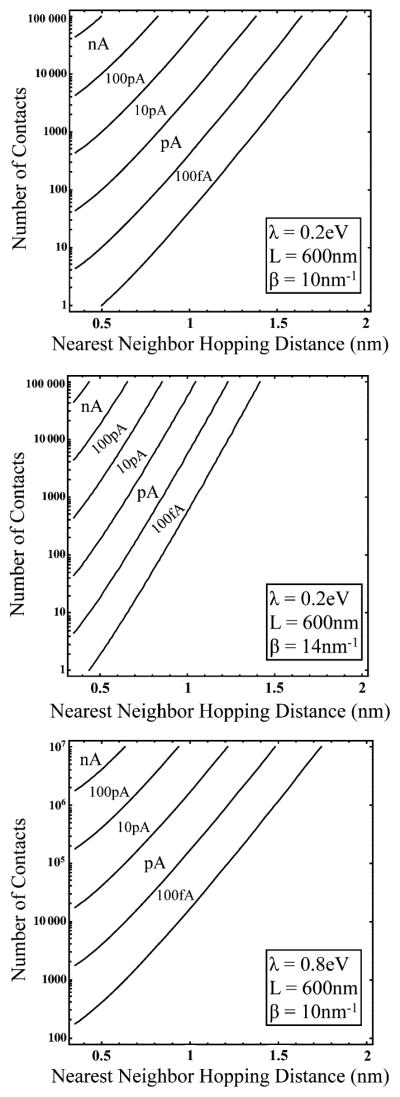
Contour plots of the current described by eqn (4.1) as a function of nearest neighbor hopping distance and number of electrode contacts. The reorganization energy, λ, the length of the bridge, L, and the exponential decay constant, β, were chosen for relevance to a bacterial pilus. For all cases, kBT was taken as 1/40 eV. The figure informs at a glance the distance and contact constraints imposed upon each 2D cylindrical system for a given magnitude of current.
We also note that a one dimensional biased mechanism is the most efficient for long-distance transport, but the most vulnerable to structural defects. Charge transfer in two or three dimensions is an effective means to avoid the issue of road blocks due to anisotropic carrier environments, even if the net effective rate constant decreases more rapidly with the length of the chain than in 1D.
Why would S. oneidensis MR-1 evolve “nanowires”? The pili may serve as biological “capacitors” waiting to be discharged upon attachment to a metal oxide or electrode surface. They may provide a “conductive matrix” that makes possible the sustained growth of bacteria far from the charge sink.24,25 The wires may constitute a conductive pathway for efficient, long-range cell-to-cell communication by electron transfer.26 Conductive pili provide only one of three mechanisms for extracellular ET found in these bacteria.27,28 Whatever their role in vivo, these conductive pili challenge our understanding of mesoscale charge flow in biological systems.
Understanding charge transfer between bacteria and metal interfaces is a grand challenge in biogeochemistry.29 Indeed, electrogenic bacteria are being engineered to produce electricity from organic waste and to store electrons from photovoltaics in chemical bonds with high efficiencies.30,31 The idea of a “living catalyst” is particularly tantalizing. Imagine the value of a catalyst such as photosystem II that will replicate, repair itself and adapt to a changing environment.
5 Concluding remarks
Our analysis of charge flow in bacterial “nanowires” has emphasized the importance of multi-step hopping. Charge localizing sites must be closely packed and reorganization energies kept small in order to move charge over long distances at the fast rates observed. Band theory can not accurately describe the current in these systems. However, quasi-incoherent regimes intermediate between thermal hopping and band transport have not been excluded by our analysis. Indeed, charge delocalization across hopping sites could account for the low reorganization energy—which inversely scales with the size of the localizing site—required by the modeling.
Several interesting issues remain. What really is the “speed limit” of charge transfer in pili? The possibility of relaxation-limited or adiabatic charge transfer could potentially give rise to hopping rates faster than 1013 s−1.32 Furthermore, the non-adiabatic rate equation assumes thermally equilibrated donor and acceptor states, which could be challenged for ultrafast hopping rates. The hopping networks described in this paper lead us to wonder if hopping pathways can be exploited for multi-carrier delivery of charges to a single site. Finally, one is left to wonder at the effectiveness of the pili compared to other quasi-1D nanostructures to transfer charge over long distances.
Acknowledgments
We thank E. J. Toone for bringing our attention to this topic. This material is based upon work supported as part of the UNC EFRC: Solar Fuels and Next Generation Photovoltaics, an Energy Frontier Research Center funded by the U.S. Department of Energy, Office of Science, Office of Basic Energy Sciences under Award Number DE-SC0001011 (to SSS and DNB) and by the National Institutes of Health grants GM-48043 and GM-71628 (to DNB and NFP). Additional support by DOE ASCR under SciDAC-e award DE-FC02-06ER25764 is gratefully acknowledged. The development of multi-step transport models was supported by the UNC EFRC, the computational methods development was supported by SciDAC-e, and the simulations of biological systems was supported by NIH.
A Appendix
A.1 Electrochemical electron transfers
The electrochemical reduction and oxidation rate constants are a sum of the individual rates for all available energy states ρ(ε) of the electrode, weighted by the Fermi–Dirac probabilities of occupancy (f+) or vacancy (f−) of those states:12
| (A.1) |
with energy states of the electrode −eε and Fermi level −eE, where E is the applied electrode potential. Starting with the high temperature molecular ET rate constant given by eqn (2.2), we make the substitution
| (A.2) |
where E°′ is the formal potential of the redox species. For an electrochemical reduction, the electrode formally plays the role of the donor, with state occupancy f+. For an oxidation, the electrode is the acceptor with state vacancies 1 − f+ = f−. The rate constants governing reduction and oxidation become
| (A.3) |
| (A.4) |
If the density of states, ρ(ε), as well as the electrode–molecule electronic interaction energy (H(ε)) are assumed to be constant in the energy region of interest, the following forms for the rate constants can then be derived with the substitutions x = e(E − ε)/kBT and y = −e(E − ε)/kBT, respectively:
| (A.5) |
| (A.6) |
where the bar indicates an energy average of these quantities, and λ, the reorganization energy, is assumed to be equal for reduction and oxidation. Upon inspection, kred and kox are equal when E = E°′, which must be so due to detailed balance. A representation of the energy levels involved in electrochemical electron transfer and the corresponding state densities is shown in Fig. 8.
Fig. 8.
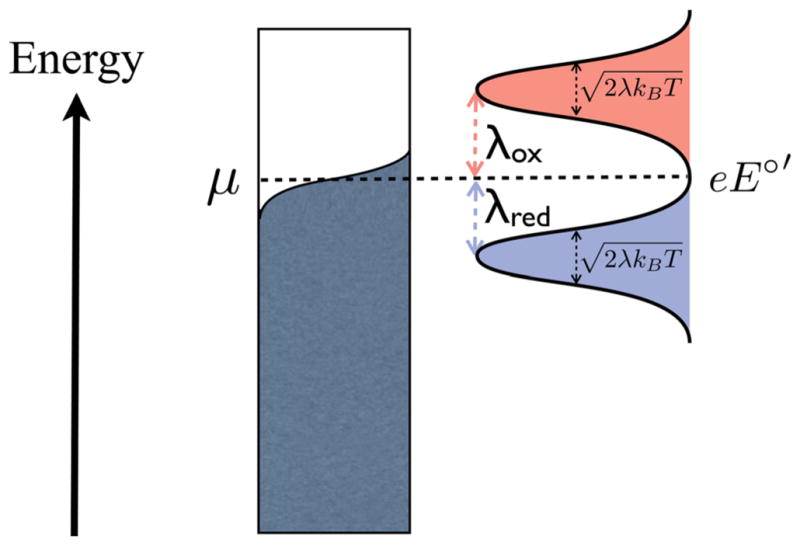
The energy picture of an electrochemical electron transfer. The molecular redox species have state densities represented by gaussians (oxidized state: red, reduced state: blue). Applying a negative potential to the electrode moves the chemical potential μ up the energy scale. The electron transfer rate is related to the overlap between the Fermi function of the electrode and the gaussian density of states of the redox molecule. Note that at very negative applied potentials, the Fermi level of the electrode is far above the (red colored) gaussian of the oxidized species and the overlap of the two functions remains constant and saturated even when more negative potentials are applied. In this way, kred plateaus and saturates. Likewise for kox at large positive potentials.
The symbol k° is given to the heterogeneous electron transfer rate constant at zero potential bias.33–36 Given an initial guess at k° and λ, c is calculated. This calculated c is then used as the prefactor in the potential-dependent rate constants (A.5) and (A.6). Programs have been developed to iteratively arrive at a k° and λ that fit electrochemical data in the form of trumpet plots.33–36
The currents through bacterial “nanowires” were modeled with electrode-bridge injection and ejection rates given by eqn (A.5) and (A.6). Because of the small value of λ needed for fast hopping rates through the bridge, the value of k° needed to be large to sustain the experimentally observed currents. We note that the measured k° of MtrC,23,37,38 the c-type cytochrome implicated as the charge carrier along the pilus, from trumpet plot analysis is orders of magnitude less (k° ≈ 200 s−1) than what is needed for the observed currents (k° ≥ 1010 s−1, Table 1). However, these discrepancies may be resolved by the vastly different experimental conditions under which these measurements were made.8,38
A.2 Steady-state kinetics
The master equation, (2.1), can be represented in matrix form as dp⃗/dt = Kp⃗, with solution
| (A.7) |
where K is the matrix of rate constants, S the matrix of the eigenvectors of K, Lambda; is the diagonal matrix of eigenvalues of k, and p⃗ is the n × 1 population vector for a system of n sites, p⃗ = [P1(t) … Pn(t)]T.
Solutions to all the time-dependent populations, p⃗(t), are not necessary at steady-state. In this case, we are interested only in the eigenvector of K with eigenvalue zero. We note that if all site-to-site transitions in the kinetic mechanism are reversible, this eigenvector has components that are the equilibrium populations at each site, which are subject to detailed balance, i.e. kj→iPj = ki→jPi. In this case there is no net flux and therefore no current. A net flux necessitates an irreversible step, which we could impose by setting equal to zero in Fig. 2. However, the following treatment makes this unnecessary.
We are interested in the nonequilibrium steady-state flux through the bridge for a given difference in chemical potential between the left and right electrodes, ΔμRL. We note that the inclusion of an irreversible step implies a net flux even for ΔμRL = 0. Subtraction of the net flux in the opposite direction will solve this problem only if the rate constants associated with the irreversible step in both directions are equal. We avoid the issue of irreversibility by working with mechanisms in the form of closed loops. The detailed balance condition for a looped mechanism is
| (A.8) |
where represents the clockwise rate constant from site i to i + 1 in the closed loop and is the counterclockwise rate constant from site i + 1 to i. For a given chemical potential difference between the left and right electrodes, eqn (A.8) becomes
| (A.9) |
which is a nonequilibrium condition imposing a net flow from L to R if ΔμRL is negative or from R to L if ΔμRL is positive.
Expanding upon the formalism of Hänngi, 39 one can identify a closed loop for the system in Fig. 2 upon replacement of the L and R electrode states with a single state (L, R), which represents the source and sink of electrons at different chemical potentials. The closed loop representation is shown schematically in Fig. 9. The population of state (L, R) represents the absence of the electron on the bridge and replaces the populations PL and PR in all the corresponding terms in the master eqn (2.1) with transitions into and out of the left and right electrodes. An electron that traverses a full loop in this cyclical reaction mechanism will have a net change in free energy equal to the difference in the chemical potential of the left and right electrodes, ΔμRL. In Fig. 9, a complete cycle is any population flowing out of (L, R) in the direction of B1 and flowing back into (L, R) from BN.
Fig. 9.
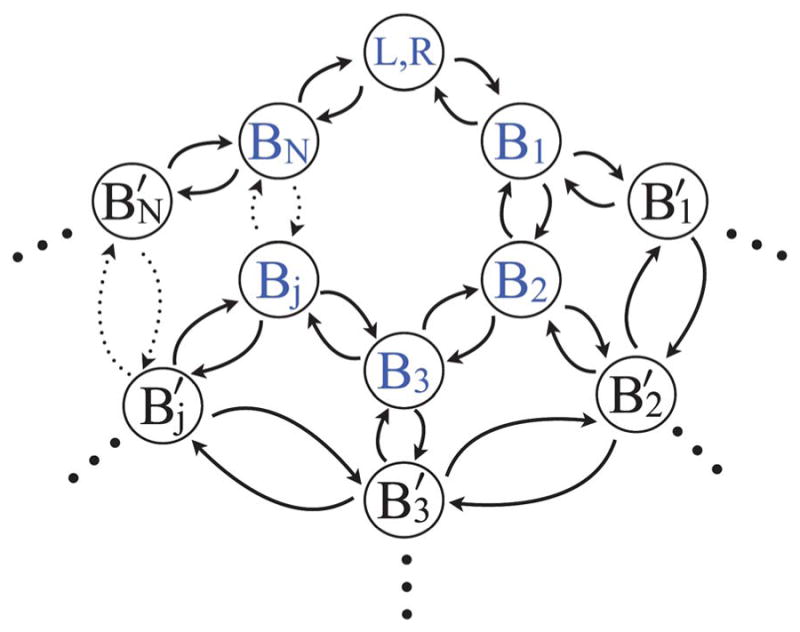
The familiar form of the rate mechanism (see Fig. 2) is recast in terms of a closed loop, where state (L, R) represents the state from where an electron is entering or exiting. The symbols highlighted in blue are those included in a one dimensional bridge of length N. Inclusion of the black states makes this mechanism two dimensional. Applying the cylindrical boundary condition as described in the text makes this mechanism two dimensional and cylindrical. The dotted arrows represent transitions between the variable number of bridge sites between Bj and BN.
The application and utility of this kinetic scheme is best illustrated by example, for which we use a two site bridge connected between two leads as shown in Fig. 10. One first writes the rate equations, setting them equal to zero at steady-state:
| (A.10) |
Fig. 10.
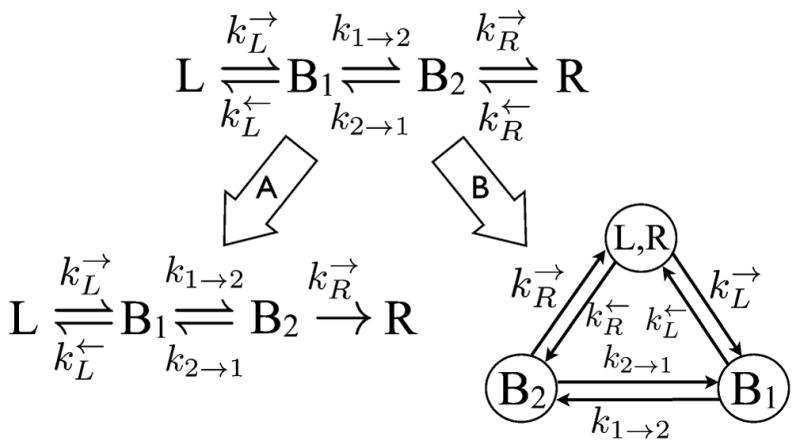
A nonequilibrium steady-state flux can be imposed on this two bridge rate mechanism (top) by either (A) making the last step irreversible, as is usually done, or (B) recasting in terms of a closed loop. In (B), the four state mechanism becomes a cyclical three state mechanism, from which the nonequilibrium steady-state flux is easily obtained without invoking irreversibility. Detailed balance dictates that when ΔμRL = 0.
Eqn (A.10) are written in the matrix form Kssp⃗ss = 0, with
| (A.11) |
and . We want solutions of ~ pss that solve the matrix equation above; that is, we are looking for the nullspace of Kss. The nullspace for these rate matrices consists of a single basis vector multiplied by an arbitrary constant, c, and in this example is
| (A.12) |
We choose c such that the steady-state populations sum to one, i.e. c = 1/Σi N(Kss)i, where the sum is over all i components of the nullspace basis vector. We are, after all, looking for the time it takes one particle on average to find its way to the sink under a constant flow. The steady-state population vector is in general
| (A.13) |
and specifically for the example
| (A.14) |
where
| (A.15) |
The effective steady-state rate constant keff is defined
| (A.16) |
where the sum is over each j of the n sites that have transitions into the left electrode. The current I is defined as the effective rate constant (A.16) multiplied by the electron charge (e) and by the lesser of the number of sites coupled into the bridge from the left or right electrode (n<):
| (A.17) |
The expression for the effective rate constant in our example is
| (A.18) |
Setting in eqn (A.18) recovers the expression given by the more familiar but less general treatment of irreversible flow from L to R.
The looped kinetic scheme is preferable for a few reasons: 1. The effective rate constant through the loop is calculated directly via eqn (A.16) and does not involve finding effective rate constants at each site as the irreversible mechanism would require. 2. There are no restrictions other than eqn (A.8) on the rate constants in order to achieve zero flux at zero chemical potential difference. 3. Integrals over the time-dependent populations are avoided by solving for the nullspace of the rate matrix.
We have written MATLAB code that generates the rate matrices for 1D, 2D and 2D cylindrical kinetic networks of any size and for any choice of rate constants. The code finds the nullspace of the rate matrix and calculates the current as defined in eqn (A.17). We use this program in section (3.1) to calculate the hopping currents through the pili subject to the parameters: V (potential bias), r (hopping distance), k° (heterogeneous charge transfer rate constant at zero applied bias), λ (reorganization energy), kBT (thermal energy), Ncol and Nrow (number of columns and rows in a 2D kinetic mechanism, respectively), Nin and Nout (number of sites that couple into and out of the 2D bridge, respectively, see Fig. 2). The results of these calculations are summarized in Table 1 of section 3.1.
A.3 Unidirectional transport
We note that for a one dimensional, unidirectional transition process
| (A.19) |
with transitions characterized by a single rate constant, Γ, the time-dependent probability of occupation at each site is known exactly.40 It is the Poisson distribution:
| (A.20) |
Defining the mean first passage time out of state m as
| (A.21) |
which is equivalent to eqn (2.6), and substituting (A.20) into (A.21) leads to
| (A.22) |
| (A.23) |
The mean first passage time, eqn (A.21), is then
| (A.24) |
which can now be seen to be directly proportional to the number of hopping sites. Defining an effective rate constant through the mechanism as 1/〈t〉, the rate decreases as 1/N for unidirectional transport, which agrees with the result found numerically in Fig. 5. A review of formulations to describe transport in kinetic networks is in preparation (Polizzi, Skourtis, Beratan).
References
- 1.Skourtis SS, Waldeck DH, Beratan DN. Annu Rev Phys Chem. 2010;61:461–485. doi: 10.1146/annurev.physchem.012809.103436. [DOI] [PMC free article] [PubMed] [Google Scholar]
- 2.Beratan DN, Skourtis SS, Balabin IA, Balaeff A, Keinan S, Venkatramani R, Xiao D. Acc Chem Res. 2009;42:1669–1678. doi: 10.1021/ar900123t. [DOI] [PMC free article] [PubMed] [Google Scholar]
- 3.Gray HB, Winkler JR. Biochim Biophys Acta, Bioenerg. 2010;1797:1563–1572. doi: 10.1016/j.bbabio.2010.05.001. [DOI] [PubMed] [Google Scholar]
- 4.Dempsey JL, Winkler JR, Gray HB. Chem Rev. 2010;110:7024–7039. doi: 10.1021/cr100182b. [DOI] [PMC free article] [PubMed] [Google Scholar]
- 5.Beratan DN, Betts JN, Onuchic JN. Science. 1991;252:1285–1288. doi: 10.1126/science.1656523. [DOI] [PubMed] [Google Scholar]
- 6.Beratan DN, Skourtis SS. Curr Opin Chem Biol. 1998;2:235–243. doi: 10.1016/s1367-5931(98)80065-3. [DOI] [PubMed] [Google Scholar]
- 7.DeVault D. Q Rev Biophys. 1980;13:387–564. doi: 10.1017/s003358350000175x. [DOI] [PubMed] [Google Scholar]
- 8.El-Naggar MY, Wanger G, Leung KM, Yuzvinsky TD, Southam G, Yang J, Lau WM, Nealson KH, Gorby YA. Proc Natl Acad Sci U S A. 2010;107:18127–18131. doi: 10.1073/pnas.1004880107. [DOI] [PMC free article] [PubMed] [Google Scholar]
- 9.Gorby YA, Yanina S, McLean JS, Rosso KM, Moyles D, Dohnalkova A, Beveridge TJ, Chang IS, Kim BH, Kim KS, Culley DE, Reed SB, Romine MF, Saffarini DA, Hill EA, Shi L, Elias DA, Kennedy DW, Pinchuk G, Watanabe K, Ishii S, Logan B, Nealson KH, Fredrickson JK. Proc Natl Acad Sci U S A. 2006;103:11358–11363. doi: 10.1073/pnas.0604517103. [DOI] [PMC free article] [PubMed] [Google Scholar]
- 10.Wigginton NS, Rosso KM, Hochella MF. J Phys Chem B. 2007;111:12857–12864. doi: 10.1021/jp0718698. [DOI] [PubMed] [Google Scholar]
- 11.Marcus RA, Sutin N. Biochim Biophys Acta. 1985;811:265–322. [Google Scholar]
- 12.Chidsey CED. Science. 1991;251:919–922. doi: 10.1126/science.251.4996.919. [DOI] [PubMed] [Google Scholar]
- 13.Cao J. J Phys Chem B. 2011;115:5493–5498. doi: 10.1021/jp110924w. [DOI] [PubMed] [Google Scholar]
- 14.Bar-Haim A, Klafter J. J Chem Phys. 1998;109:5187–5193. [Google Scholar]
- 15.Skourtis SS, Da Silva AJR, Bialek W, Onuchic JN. J Phys Chem. 1992;96:8034–8041. [Google Scholar]
- 16.Strang G. Linear Algebra and its Applications. 4. Thomson Brooks/Cole; 2006. [Google Scholar]
- 17.Grozema FC, Siebbeles LDA. Int Rev Phys Chem. 2008;27:87–138. [Google Scholar]
- 18.Nitzan A. Annu Rev Phys Chem. 2001;52:681–750. doi: 10.1146/annurev.physchem.52.1.681. [DOI] [PubMed] [Google Scholar]
- 19.El-Naggar MY, Gorby YA, Xia W, Nealson KH. Biophys J. 2008;95:L10–L12. doi: 10.1529/biophysj.108.134411. [DOI] [PMC free article] [PubMed] [Google Scholar]
- 20.Hopfield JJ. Proc Natl Acad Sci U S A. 1974;71:3640–3644. doi: 10.1073/pnas.71.9.3640. [DOI] [PMC free article] [PubMed] [Google Scholar]
- 21.Imahori H, Tkachenko NV, Vehmanen V, Tamaki K, Lemmetyinen H, Sakata Y, Fukuzumi S. J Phys Chem A. 2001;105:1750–1756. [Google Scholar]
- 22.Leang C, Qian XL, Mester T, Lovley DR. Appl Environ Microbiol. 2010;76:4080–4084. doi: 10.1128/AEM.00023-10. [DOI] [PMC free article] [PubMed] [Google Scholar]
- 23.Clarke TA, Edwards MJ, Gates AJ, Hall A, White GF, Bradley J, Reardon C, Shi L, Beliaev AS, Marshall MJ, Wang Z, Watmough NJ, Fredrickson JK, Zachara JM, Butt JN, Richardson DJ. Proc Natl Acad Sci U S A. 2011 doi: 10.1073/pnas.1017200108. [DOI] [Google Scholar]
- 24.Reguera G, Nevin KP, Nicoll JS, Covalla SF, Woodard TL, Lovley DR. Appl Environ Microbiol. 2006;72:7345–7348. doi: 10.1128/AEM.01444-06. [DOI] [PMC free article] [PubMed] [Google Scholar]
- 25.Kato Marcus A, Torres CI, Rittmann BE. Biotechnol Bioeng. 2007;98:1171–1182. doi: 10.1002/bit.21533. [DOI] [PubMed] [Google Scholar]
- 26.Summers ZM, Fogarty HE, Leang C, Franks AE, Malvankar NS, Lovley DR. Science. 2010;330:1413–1415. doi: 10.1126/science.1196526. [DOI] [PubMed] [Google Scholar]
- 27.Jiang X, Hu J, Fitzgerald LA, Biffinger JC, Xie P, Ringeisen BR, Lieber CM. Proc Natl Acad Sci U S A. 2010;107:16806–16810. doi: 10.1073/pnas.1011699107. [DOI] [PMC free article] [PubMed] [Google Scholar]
- 28.Logan BE. Nat Rev Microbiol. 2009;7:375–381. doi: 10.1038/nrmicro2113. [DOI] [PubMed] [Google Scholar]
- 29.Fredrickson JK, Zachara JM. Geobiology. 2008;6:245–253. doi: 10.1111/j.1472-4669.2008.00146.x. [DOI] [PubMed] [Google Scholar]
- 30.Jensen HM, Albers AE, Malley KR, Londer YY, Cohen BE, Helms BA, Weigele P, Groves JT, Ajo-Franklin CM. Proc Natl Acad Sci U S A. 2010;107:19213–19218. doi: 10.1073/pnas.1009645107. [DOI] [PMC free article] [PubMed] [Google Scholar]
- 31.Nevin KP, Woodard TL, Franks AE, Summers ZM, Lovley DR. mBio. 2010;1:e00103–10. doi: 10.1128/mBio.00103-10. [DOI] [PMC free article] [PubMed] [Google Scholar]
- 32.Beratan DN, Onuchic JN. J Chem Phys. 1988;89:6195–6203. [Google Scholar]
- 33.Tender L, Carter MT, Murray RW. Anal Chem. 1994;66:3173–3181. [Google Scholar]
- 34.Weber K, Creager SE. Anal Chem. 1994;66:3164–3172. [Google Scholar]
- 35.Armstrong FA, Heering HA, Hirst J. Chem Soc Rev. 1997;26:169–179. [Google Scholar]
- 36.Napper AM, Liu H, Waldeck DH. J Phys Chem B. 2001;105:7699–7707. [Google Scholar]
- 37.Hartshorne R, Jepson B, Clarke T, Field S, Fredrickson J, Zachara J, Shi L, Butt J, Richardson D. JBIC, J Biol Inorg Chem. 2007;12:1083–1094. doi: 10.1007/s00775-007-0278-y. [DOI] [PubMed] [Google Scholar]
- 38.Hartshorne RS, Reardon CL, Ross D, Nuester J, Clarke TA, Gates AJ, Mills PC, Fredrickson JK, Zachara JM, Shi L, Beliaev AS, Marshall MJ, Tien M, Brantley S, Butt JN, Richardson DJ. Proc Natl Acad Sci U S A. 2009;106:22169–22174. doi: 10.1073/pnas.0900086106. [DOI] [PMC free article] [PubMed] [Google Scholar]
- 39.Lehmann J, Ingold GL, Hänggi P. Chem Phys. 2002;281:199–209. [Google Scholar]
- 40.Wasshuber C. Computational Single-Electronics. Springer; 2001. [Google Scholar]
- 41.Malvankar NS, Vargas M, Nevin KP, Franks AE, Leang C, Kim BC, Inoue K, Mester T, Covalla SF, Johnson JP, Rotello VM, Tuominen MT, Lovley DR. Nat Nano. 2011;6:573. doi: 10.1038/nnano.2011.119. [DOI] [PubMed] [Google Scholar]


