

Abstract
Doctors prescribe drugs for indications that are not FDA approved. Research indicates that 21% of prescriptions filled are for off-label indications. Of those, more than 73% lack supporting scientific evidence. Traditional drug safety alerts may not cover usages that are not FDA approved. Therefore, analyzing patterns of off-label drug usage in the clinical setting is an important step toward reducing the incidence of adverse events and for improving patient safety. We applied term extraction tools on the clinical notes of a million patients to compile a database of statistically significant patterns of drug use. We validated some of the usage patterns learned from the data against sources of known on-label and off-label use. Given our ability to quantify adverse event risks using the clinical notes, this will enable us to address patient safety because we can now rank-order off-label drug use and prioritize the search for their adverse event profiles.
Introduction
In most cases the safety profile of a drug when used off-label is unknown. Yet, it is very common—and legal—for doctors to prescribe drugs for indications that are not on the FDA approved label. In fact, surveys have shown that off-label prescribing in ambulatory settings occurs 21% of the time, of which up to 73% lack any scientific evidence [1, 2]. At the same time, adverse events occur in over 30% of hospital stays of which 50% are drug-related events [3] that result in tens of billions of dollars in associated costs per year [4]. Therefore, research on off-label usage and the detection of adverse drug events should be studied jointly. We should focus on drugs used frequently with inadequate supporting evidence that present possible safety concerns [5].
We have a unique opportunity to profile drug usage as recorded in textual clinical notes. Research has shown that discharge codes and problem lists are often incomplete: the true richness of the patient’s electronic health record (EHR) lies in the textual clinical notes [6–8]. There are many tools available today that enable us to computationally encode and to analyze the free-text narrative automatically [9, 10]. For example, in a recent Vioxx study, we recapitulated the risk signal for suffering a myocardial infarction upon taking Vioxx as a treatment for arthritis by analyzing textual clinical notes [11, 12] (Figure 1). Interestingly, the same signal was undetectable in our data set when using structured EHR data alone (i.e., discharge diagnosis ICD9 codes).
Figure 1.

Trend lines for drug mentions in text. In 2004, Vioxx was recalled and its use declined significantly.
Our goal in this study is to find and to document prevalent drug–indications (and in particular ones that are not FDA approved) as defined in the EHR itself by extracting knowledge from clinical notes. We believe this work is significant because, given prevalent off-label drug uses, we can apply a prioritized search for adverse drug event risks to profile the safety of those off-label uses—which to our knowledge has not been done before.
We hypothesize that by examining statistically enriched co-occurrences of drug–disease mentions in the clinical notes, we can identify significant off-label usage patterns. Using the methods we describe below, we can find, for example, that Avastin (bevacizumab), a drug approved for treating several types of cancer, is also probably being used frequently to treat disorders of the eye, such as macular degeneration and retinal vascular occlusion. Using textual notes from more than a million patients, we have compiled 44,925 drug-indication associations that appear with high probability to be off-label uses. Our method shows progress toward documenting off-label uses occurring in practice, and more importantly enables us to prioritize the search for their adverse event profiles using state-of-the art statistical methods [13–15]—bringing the impossible space of combinations into the realm of tractability.
Methods
NCBO Annotator Workflow
We created a standalone Annotator Workflow (Figure 2) based upon the existing National Center for Biomedical Ontology (NCBO) Annotator Web Service [16] that annotates clinical text from electronic health record systems and to extract disease and drug mentions from the EHR. Unlike natural language processing methods that analyze grammar and syntax, the Annotator is mainly a term extraction system: it uses biomedical terms from the NCBO BioPortal library and matches them against input text. However, we have extended the Annotator Workflow by incorporating the NegEx algorithm [17] to incorporate negation detection—the ability to discern whether a term is negated within the context of the narrative. We are also extending the system to discern among different sections of clinical notes.
Figure 2.

The NCBO Annotator Workflow extracts terms from the clinical notes of patients: (1) We obtain a lexicon of over 2.8-million terms from the NCBO BioPortal library. (2) We use the NCBO Annotator to rapidly find those terms in clinical notes—which we call annotations. (3) We apply NegEx trigger rules to separate negated terms. (4) We compile terms (both positive and negative) into a temporally ordered series of sets for each patient and combine them with coded and structured data when possible. (5) We reason over the structure of the ontologies to normalize and to aggregate terms for further analysis.
One strength of the Annotator is the highly comprehensive and interlinked lexicon that it uses. It incorporates the NCBO BioPortal ontology library of over 250 ontologies to identify biomedical concepts from text using a dictionary of terms generated from those ontologies. Terms from these ontologies are linked together via mappings [18]. For this study, we specifically configured the workflow to use a subset of those ontologies that are most relevant to clinical domains, including Unified Medical Language System (UMLS) terminologies such as SNOMED-CT, the National Drug File (NDFRT) and RxNORM, as well as ontologies like the Human Disease Ontology. The resulting lexicon contains 2.8 million unique terms.
Another strength of the Annotator is its speed. We have optimized the workflow for both space and time when performing large-scale annotation runs. It takes about 7 hours and 4.5 GB of disk space to process 9 million notes from over 1 million patients. To the best of our knowledge, existing NLP tools do not function at this scale.
The output of the annotation workflow is a set of negated and non-negated terms from each note. As a result, for each patient we end up with a temporal series of terms mentioned in the notes (red denotes negated terms). We also include manually encoded ICD9 terms for each patient encounter as additional terms. Because each encounter’s date is recorded, we can order each set of terms for a patient to create a timeline view of the patient’s record. Using the terms as features, we can define patterns of interest (such as patients with severe depression, who take gabapentin and then get ataxia), which we can use in data mining applications. In the Vioxx study, for example, we looked at patients with rheumatoid arthritis, who took rofecoxib, and then got myocardial infarction.
Creating Drug–Indication Associations:
Typically, the clinical notes mention an indication before an associated drug. The temporal ordering is an important cue for discerning between, for example, a treatment versus an adverse event [19]. Thus, for every patient, we create a set of possible drug–indication associations by scanning for conditions or diseases mentioned before a drug mention. We only consider non-negated terms.
We employ a temporal sliding window technique (Figure 3), which can be configured to fine-tune an association based on “nearness in time.” A liberal temporal window (e.g., “2:1”) might allow for hospital procedures in which prescriptions are documented and time stamped asynchronously with a diagnosis transcription (e.g., a doctor’s note is transcribed on the same day of the visit and a prescription is filled and noted by a dispensing machine a day later).
Figure 3.
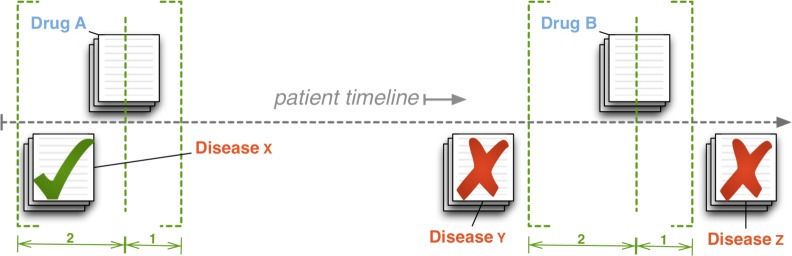
Creating drug–indication associations: for every note mentioning a drug, we scan within a temporal sliding window to associate all diseases mentioned in all notes falling within the window.
Using the 2:1 window as an illustration, we move the drug reference pointer (the dashed, vertical line in Figure 3) forward through a patient’s timeline. We note a drug mention, and then scan backward two days (the dashed bracket on the left) and associate all mentioned indications. We also scan forward one day (the dashed bracket on the right) before moving the drug reference pointer forward again and repeating the process until the drug pointer reaches the end of the timeline. Once we create an association and add it to the set of possible associations for a particular patient, we drop the temporal information. In addition to noting drug–indication associations, we also record all comorbidities (the cross product of all indications) as well as co-prescriptions. We repeat this for every patient.
In this study, we use a more conservative “1:0” configuration. Computing pairs is computationally expensive, so using small windows is more tractable. By our estimates, a 1:0 window versus a 2:1 window reduces the set of significant drug-indication pairs found by approximately 40,000 pairs and should increase precision [20].
Co-morbidity Filtering:
Employing co-morbidity based filtering allows us to remove spurious associations between drugs and diseases. It is well known that diseases co-occur (e.g. diabetes and hypertension); such co-occurrence, gives rise to “blind” associations between drugs and disease. For example, lisinopril (e.g., the blue dot in Figure 4, Step 3) is used to treat hypertension (the boldly connected red dot), while diabetes (one of the other red dots) and hypertension are known to co-occur. In this situation, lisinopril and diabetes will be strongly associated but that does not imply that diabetes is an indication for lisinopril. Therefore, we first identify co-morbidities that are common in our data by associating all diseases occurring within every temporal window (see above), and then we use known drug-indication pairs (see Data section) to remove those drug-disease pairs that contain a co-morbid disease of the known indication (e.g., we remove lisinopril–diabetes because of prior knowledge about lisinopril–hypertension).
Figure 4.
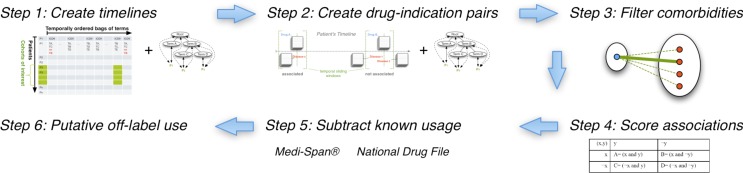
The off-label use workflow: Starting with the output of the annotation workflow (step 1) we create drug–indication associations (step 2), filter out confounding co-morbidities (step 3), score the strength of the association (step 4), validate associations against known drug–indication databases (step 5), and finally rank order the remaining drug–indication associations as putative off-label uses to investigate further (step 6).
Normalization and Aggregation:
We find that results are easier to interpret when properly normalized and aggregated. Moreover, researchers have noted that such reasoning using disease hierarchies can play a crucial role: for example, extrapolating upon the known relationship between myopathy and rhabdomyolyis could have automatically inferred the adverse relationship between myopathy and cerivastatin and prevented 2 years of unmitigated risk [21].
In Step 1 of the analysis workflow, we use the structure of the RxNORM ontology to rewrite drug-related terms into their active ingredients—e.g., Excedrin is rewritten thrice into acetaminophen, aspirin, and caffeine. In Step 2 of the workflow, we reason over diseases using hierarchies like SNOMED-CT and NDFRT when creating drug–indication pairs, expanding each pair to include all parents of a disease—e.g., if gabapentin–Amok is associated, then so is gabapentin–manic because Amok disorder is a kind of mania.
We found that applying the RxNORM rewriting, which we call normalization, actually decreases space utilization and improves tractability. On the other hand, applying the disease hierarchies, which we call aggregation, increases space utilization by a factor of 10 and makes space requirements prohibitively large (> 2Tb). Thus, we chose a more selective vocabulary to work with: we chose only those terms in common with existing drug indication databases as our target representation and aggregated all child terms to this target vocabulary (see Data section). For example, if mania is in our target vocabulary but Amok is not, then all patients coded with Amok are automatically counted as being manic, but we lose the ability to say anything specifically about Amok in our final analysis because “Amok” is not kept in our target vocabulary. The space–time tradeoff is a well-known phenomenon in automated reasoning and must be considered carefully when working with large data sets [22].
In addition to obtaining clearer signals, spurious signals can also be reduced using normalization and aggregation. Consider how aggregation works: general terms will accumulate higher frequency counts because they subsume other terms. Whereas in some cases we will strengthen signals that could have been missed, in other cases general terms accumulate an over-abundant frequency and the signal fades. Thus, by increasing the counts of general terms based on mentions of their more specific kinds, their significance is properly adjusted.
Scoring Drug–Indication Associations:
Once we have compiled all aggregated, possible drug–indication pairs for all patients, Step 4 is to determine whether the association is significant as compared with random associations. The reporting odds ratio (ROR) is one measure commonly used to estimate the relative risk of drug adverse events [21]. We adopt this same measure to infer the association strength for both drug indications as well as disease co-morbidities. The ratio gives one measure of disproportionality—the unexpectedness of a particular association occurring given the all other observations. Table 1 summarizes the method for calculating the ROR.
Table 1:
Reporting Odds Ratio: For all pairs (x,y), the reporting odds ratio provides the “unexpectedness of y, given x” via the simple calculation (AD) ÷ (BC) as defined in the contingency table below.
| y | ¬y | |
|
| ||
| x | A= (x and y) | B= (x and ¬y) |
| ¬x | C= (¬x and y) | D= (¬x and ¬y) |
To calculate the ROR for a candidate drug–indication pair (drug x, disease y), we sum over all patients to fill in the contingency table shown in Table 1, given the associations calculated in Step 2, and we apply Fisher’s exact test commonly available in most statistical packages. We do this for every pair (x,y). Since we are dealing with sets of associations, each patient contributes at most one count, even if their record contains the pair multiple times. We also calculate the RORs for co-morbidities, which we apply in Step 3.
Data
We use data from the Stanford Clinical Data Warehouse (STRIDE) to extract drug indications (and co-morbidities) from the clinical record. STRIDE contains EHRs for 1.6 million patients, 15 million encounters, 25 million coded ICD9 diagnoses, and a combination of pathology, radiology, and transcription reports totaling over 9.5 million unstructured clinical notes over a period of 17 years. After filtering out patients to satisfy HIPAA requirements (e.g., rare diseases, celebrity cases, mental health), we annotated 9,078,736 notes for 1,044,979 patients. The gender split is roughly 60% female, 40% male. Ages range from 0 to 90 (adjusted to satisfy HIPAA requirements), with an average age of 44 and standard deviation of 25.
We also use drug indication data provided by the Medi-Span® (Wolters Kluwer Health, Indianapolis, IN) Drug Indications Database™ for evaluation purposes. The Medi-Span Drug Indications Database is linked to both RxNORM and SNOMED-CT. Drug indications are classified according to its source, including: FDA approved label, accepted use, and limited evidence. We consider all of these as “known” uses. Ones classified as FDA approved are known “on-label” uses. There are 8,253 distinct on-label drug-indication pairs (normalized by ingredient), 2,944 distinct accepted uses, and 3,849 distinct uses having limited evidence.
In addition to using Medi-Span as validation data, we use the National Drug File (NDFRT) ontology, which specifies drug indications via the may_treat relation. NDFRT is also directly linked to RxNORM and SNOMED-CT via the UMLS Metathesaurus. We also consider these as “known” uses. There are 5,429 drug–indication pairs (normalized by ingredient) specified by NDFRT may_treat.
Overall, Medi-Span and NDFRT contribute 18,218 distinct drug–indication pairs constituting known usage. There are 2,004 ingredients and 2,674 indications from these pairs. In STRIDE: 145,498 distinct drug-terms normalize into 4,871 ingredients and we keep all ingredients; 281,844 disease-terms from the ontologies we use aggregate into (i.e., are subsumed by) the 2,674 indications from Medi-Span and NDFRT (e.g., Amok becomes mania) and we discard all other terms.
Results
We found that 1,853 of 2,004 (92%) ingredients appear in STRIDE in addition to 1,076 other ingredients, making a total of 2,929. We found that 2,435 of 2,674 (91%) target indications appear in STRIDE. The indications subsume 48,446 other recognized terms (out of the 281,844) that were aggregated. We would create drug–indication pairs 7,124,810 if 2,926 drugs and 2,435 indications were associated at random.
Recapitulating known use:
We found 2,865,774 distinct drug–indication pairs. These pairs cover 14,267 (78%) of the 18,218 known pairs. Of these pairs, 1,461,549 have a p-value < 0.05, which is roughly 20% of all possible (7M) pairs. Using the p-value < 0.05 cut-off, our system detects 11,420 (63%) of known drug–indication pairs. Of those pairs, 8,602 (47%) have odds ratios greater than 1.25, which we consider to demonstrate a suitably strong signal. Broken down by kind of known use (p-value < 0.05, odds ratio > 1.25), we found: 4,270 on-label (52%), 1,324 accepted (45%), 1,627 limited evidence (42%), and 2,987 may_treat (55%).
Correcting further for multiple hypothesis testing using the Bonferroni method (p-value < 3.4×10⁻⁸) reduces the numbers of pairs overall. The stricter cutoff yields 7,351 known pairs (40%) and 715,568 pairs in total.
Factoring co-morbidities:
We found 1,838,067 distinct co-morbidity pairs of which 1,186,944 have p-value < 0.05 and 719,395 have p-value < 4.2×10⁻⁸ (corrected). There are 102,644 pairs with an odds ratio greater than 2.5 (and p-value < 4.2×10⁻⁸). At this time, we do not have a gold standard for co-morbid indications to compare against. Alone, the co-morbidity data we have compiled is novel and worth further investigation, but it is not the focus of this particular study. Out of the 715,568 drug–indication pairs having p-value < 3.4×10⁻⁸, only 454,398 remain after factoring for co-morbidity by removing for every drug the cross product of all known indications and their associated co-morbidities.
Ranking putative uses:
We applied three filters to identify 44,925 drug-indication pairs that are not previously recorded in either Medi-Span or NDFRT and that should be evaluated as putative off-label uses. First, we applied a 2.5 odds ratio and the corrected p-value < 3.4×10⁻⁸ to reduce the number of drug-indication pars. Next, we used a 2.5 odds ratio and the corrected p-value < 4.2×10⁻⁸ to identify and remove co-morbid indications. Finally, we applied a threshold of 100 patients (i.e., each square of the contingency table must be >= 100). Table 2 lists a small sample from these results.
Table 2:
A sample of putative off-label use shows encouraging but mixed results. As an example of one success, Avastin (bevacizumab) treats a variety of cancers, and is used off-label for eye disorders. Also, modafinil treats sleeping disorders, but has some evidence as treatment for Parkinson’s disease. On the other hand, lisinopril treats hypertension, and premature ejaculation seems more likely as a possible side effect than a treatment. Likewise, dextromethorphan, a cough suppressant, is not likely to be a treatment for radiation sickness. Rather, it is more likely that it appears that way because it occurs with drugs (i.e., it may be confounded by co-prescriptions) like hydrobromide and hydrochloride that may.
| drug | indication | odds ratio |
|---|---|---|
| bevacizumab | macular retinal edema | 65 |
| bevacizumab | retinal vascular occlusion | 58 |
| bevacizumab | age related macular degeneration | 33 |
| bevacizumab | macular degeneration | 28 |
| bevacizumab | retinal hemorrhage | 28 |
|
| ||
|
| ||
| lisinopril | premature ejaculation | 2.6 |
| lisinopril | herpes zoster disease | 2.6 |
| lisinopril | stress | 2.5 |
| lisinopril | coughing | 2.5 |
| lisinopril | protozoan infections | 2.5 |
|
| ||
|
| ||
| modafinil | parkinson disease | 3.5 |
| modafinil | colonic diseases, functional | 3.2 |
| modafinil | irritable bowel syndrome | 3.1 |
| modafinil | brain injuries | 2.9 |
| modafinil | muscle rigidity | 2.6 |
| modafinil | muscle spasticity | 2.6 |
|
| ||
|
| ||
| dextromethorphan | radiation sickness | 13.1 |
|
| ||
|
| ||
| methylphenidate | disorder of psychological development | 20.8 |
| methylphenidate | mental disorders | 13.9 |
| methylphenidate | encephalitis | 2.9 |
| methylphenidate | brain injuries | 2.9 |
|
| ||
|
| ||
| terfenadine | asthma | 3.6 |
| nevirapine | hiv seropositivity | 662 |
| abacavir | hiv seropositivity | 642.4 |
| efavirenz | hiv seropositivity | 640 |
| stavudine | hiv seropositivity | 513.9 |
| emtricitabine | hiv seropositivity | 480.5 |
| ritonavir | hiv seropositivity | 445.8 |
| tenofovir disoproxil | hiv seropositivity | 387.2 |
| tenofovir | hiv seropositivity | 308.1 |
| lamivudine | hiv seropositivity | 181.7 |
| acyclovir | hiv seropositivity | 8.5 |
|
| ||
|
| ||
| acyclovir | abetalipoproteinemia | 8.3 |
| acyclovir | myeloid leukemia, chronic | 6.1 |
| acyclovir | disseminated intravascular coagulation | 5.9 |
| acyclovir | fluid balance finding | 4.2 |
|
| ||
|
| ||
| castor oil | major depressive disorder | 16.5 |
| benztropine | major depressive disorder | 10.4 |
| thiamine | major depressive disorder | 4.2 |
| donepezil | major depressive disorder | 4.1 |
| pramipexole | major depressive disorder | 3.8 |
| strontium | major depressive disorder | 3.3 |
| mexiletine | major depressive disorder | 3.2 |
| tizanidine | major depressive disorder | 2.8 |
| levodopa | major depressive disorder | 2.7 |
| carbidopa | major depressive disorder | 2.7 |
| sumatriptan | major depressive disorder | 2.6 |
Discussion
Our work constructs a data-driven profile for drug use by analyzing text from clinical notes, which are not affected by reporting biases inherent in other data sets. Our approach uses the temporal ordering of drug–disease mentions to help identify significant off-label drug use from over a million patient records. Our data-driven approach is complementary to survey based sources such as the National Disease and Therapeutic Index (NDTI) dataset—which provides nationally representative diagnostic and prescribing information on patients treated by U.S. office-based physicians. These complimentary datasets can be used to validate one another.
Term extraction has limitations:
Our methods produce a significant potential for erroneous association at an individual level but should provide reliable trends at the population level. For example, a drug mention does not necessarily imply a prescription. Furthermore, a condition mentioned near a drug does not necessarily mean the drug was used as a treatment. Thus, for any single patient, these methods will produce a significant degree of error. Our expectation is that over a large enough sample like one million patients these errors should largely subside.
Clearly, our results also hinge upon the efficacy of the annotation mechanism. We have conducted a comparative evaluation of two concept recognizers used in the biomedical domain—Mgrep and MetaMap—and found that Mgrep has clear advantages in large-scale, service-oriented applications specifically addressing flexibility, speed and scalability [16]. The NCBO Annotator uses Mgrep.
The precision of concept recognition varies depending on the text in each resource and type of entity being recognized: from 87% for recognizing disease terms in descriptions of clinical trials to 23% for PubMed abstracts, with an average of 68% across four different sources of text. We are currently conducting evaluations in collaboration with outside groups and early results from Richard Boyce’s group (personal communication) show that using RxNORM gives 93% recall for detecting drug mentions in clinical text. For the current work, we assume a similar level of performance. In the future we will manually examine samples of patient records to validate the ability to recognize diseases in clinical notes. We have previously employed such sampling based strategies to evaluate the accuracy of annotation workflows applied to very large datasets [23].
Future Work:
To address some of the limitations of the term extraction technique, we have recently added negation detection. We plan to further improve the precision of extraction and association by factoring in other contextual cues like section headings (e.g., family history) using tools like ConText [24]. In contrast with using a full-featured natural language processing tool, our goal is to develop simple, fast, and effective methods that can be used on very large datasets. Once NLP tools are able to function at the scale of tens of millions of records, we can use them to further improve the precision of our term association methods.
During our analysis, we compiled all co-prescriptions at the same time that we complied co-morbidities. At the time, we were not sure how beneficial this data would be so we did not use it during this first analysis. However, we plan to factor in co-prescriptions to remove pairs like dextromethorphan and radiation sickness in the future. In addition, we plan to use more advanced methods to account for confounding, such as by constructing logistic regression models on a per drug basis [13] or by using high-dimensional propensity score adjustment [25].
In a related paper [20] we demonstrate that it is possible to separate adverse drug event associations from drug indications given a drug–disease pair by using temporal ordering data in clinical notes as a key feature during classification. This technique will, first of all, help to re-classify pairs like lisinopril and premature ejaculation as a side-effect rather than an indication. More importantly, these two works make it possible to address off-label drug usage and adverse drug event detection jointly: we can separate indication from adverse event associations, prioritize significant and prevalent off-label use, and then search for their adverse event profiles exhaustively in this context. For example, we can look at Vioxx, identify tennis elbow (epicondylitis) as a significant off-label use (3.9 ROR), and confirm whether these cases have led to myocardial infarction.
Conclusion
We annotated over 9 million clinical notes to profile off-label drug usage in the EHR for over a million patients. We compiled significance measures for over 2.8 million drug–indication associations. Based on the strength of associations and by compensating for frequent co-morbidities, we have identified 44,925 putative off-label uses worth further investigation. For example, in our preliminary results, we found that bevacizumab (a cancer drug) appears to be used to treat macular degeneration and retinal vascular occlusion, and modafinil (a sleep disorder drug) appears to be used as a treatment for Parkinson’s disease. This work documents off-label uses occurring in practice, and more importantly enables us to address patient safety by prioritizing our search for the adverse event profiles of prevalent drugs having limited supporting evidence.
Acknowledgments
We acknowledge support from the NIH grant U54 HG004028 for the National Center for Biomedical Ontology. We also acknowledge Stephen Racunas and Anna Bauer-Mehren for helpful discussions.
References
- 1.Radley DC, Finkelstein SN, Stafford RS. Off-label prescribing among office-based physicians. Arch Intern Med. 2006;166(9):1021–6. doi: 10.1001/archinte.166.9.1021. [DOI] [PubMed] [Google Scholar]
- 2.Chen DT, et al. U.S. physician knowledge of the FDA-approved indications and evidence base for commonly prescribed drugs: results of a national survey. Pharmacoepidemiol Drug Saf. 2009;18(11):1094–100. doi: 10.1002/pds.1825. [DOI] [PubMed] [Google Scholar]
- 3.Classen DC, et al. ‘Global Trigger Tool’Shows That Adverse Events In Hospitals May Be Ten Times Greater Than Previously Measured. Health Affairs. 2011;30(4):581. doi: 10.1377/hlthaff.2011.0190. [DOI] [PubMed] [Google Scholar]
- 4.Bates DW, et al. The costs of adverse drug events in hospitalized patients Adverse Drug Events Prevention Study Group. JAMA : the journal of the American Medical Association. 1997;277(4):307–311. [PubMed] [Google Scholar]
- 5.Walton S, et al. Prioritizing future research on off-label prescribing: results of a quantitative evaluation. Pharmacotherapy. 2008;28(12):1443–1452. doi: 10.1592/phco.28.12.1443. [DOI] [PMC free article] [PubMed] [Google Scholar]
- 6.Poissant L, et al. Assessing the accuracy of an inter-institutional automated patient-specific health problem list. BMC Med Inform Decis Mak. 2010;10:10. doi: 10.1186/1472-6947-10-10. [DOI] [PMC free article] [PubMed] [Google Scholar]
- 7.Szeto HC, et al. Accuracy of computerized outpatient diagnoses in a Veterans Affairs general medicine clinic. Am J Manag Care. 2002;8(1):37–43. [PubMed] [Google Scholar]
- 8.Meystre SM, Haug PJ. Randomized controlled trial of an automated problem list with improved sensitivity. Int J Med Inform. 2008;77(9):602–12. doi: 10.1016/j.ijmedinf.2007.12.001. [DOI] [PubMed] [Google Scholar]
- 9.Savova GK, et al. Mayo clinical Text Analysis and Knowledge Extraction System (cTAKES): architecture, component evaluation and applications. Journal of the American Medical Informatics Association. 2010;17(5):507–513. doi: 10.1136/jamia.2009.001560. [DOI] [PMC free article] [PubMed] [Google Scholar]
- 10.Chapman WW, et al. Overcoming barriers to NLP for clinical text: the role of shared tasks and the need for additional creative solutions. Journal of the American Medical Informatics Association : JAMIA. 2011;18(5):540–3. doi: 10.1136/amiajnl-2011-000465. [DOI] [PMC free article] [PubMed] [Google Scholar]
- 11.Graham D, et al. Risk of acute myocardial infarction and sudden cardiac death in patients treated with cyclo-oxygenase 2 selective and non-selective non-steroidal anti-inflammatory drugs: nested case-control study. The Lancet. 2005;365(9458):475–481. doi: 10.1016/S0140-6736(05)17864-7. [DOI] [PubMed] [Google Scholar]
- 12.LePendu P, et al. Bio-Ontologies SIG at ISMB 2011. Viena, Austria: 2011. Annotation Analysis for Testing Drug Safety Signals. [Google Scholar]
- 13.Harpaz R, et al. Mining electronic health records for adverse drug effects using regression based methods; Proceedings of the 1st ACM International Health Informatics Symposium; 2010. pp. 100–107. [Google Scholar]
- 14.Wang X, et al. Active computerized pharmacovigilance using natural language processing, statistics, and electronic health records: a feasibility study. Journal of the American Medical Informatics Association : JAMIA. 2009;16(3):328–337. doi: 10.1197/jamia.M3028. [DOI] [PMC free article] [PubMed] [Google Scholar]
- 15.Cao H, Hripcsak G, Markatou M. A statistical methodology for analyzing co-occurrence data from a large sample. Journal of Biomedical Informatics. 2007;40(3):343–52. doi: 10.1016/j.jbi.2006.11.003. [DOI] [PMC free article] [PubMed] [Google Scholar]
- 16.Shah NH, et al. Comparison of concept recognizers for building the Open Biomedical Annotator. BMC Bioinformatics. 2009;10(Suppl 9):S14. doi: 10.1186/1471-2105-10-S9-S14. [DOI] [PMC free article] [PubMed] [Google Scholar]
- 17.Chapman WW, et al. A simple algorithm for identifying negated findings and diseases in discharge summaries. Journal of Biomedical Informatics. 2001;34(5):301–10. doi: 10.1006/jbin.2001.1029. [DOI] [PubMed] [Google Scholar]
- 18.Noy NF, et al. BioPortal: ontologies and integrated data resources at the click of a mouse. Nucleic Acids Research. 2009 doi: 10.1093/nar/gkp440. [DOI] [PMC free article] [PubMed] [Google Scholar]
- 19.Ji Y, et al. A potential causal association mining algorithm for screening adverse drug reactions in postmarketing surveillance. IEEE Trans Inf Technol Biomed. 2011;15(3):428–37. doi: 10.1109/TITB.2011.2131669. [DOI] [PubMed] [Google Scholar]
- 20.Liu Y, et al. AMIA Summit on Clinical Research Informatics. San Francisco, CA: 2012. Using Temporal Patterns in Medical Records to Discern Adverse Drug Events from Indications. [PMC free article] [PubMed] [Google Scholar]
- 21.Bate A, Evans SJW. Quantitative signal detection using spontaneous ADR reporting. Pharmacoepidemiol Drug Saf. 2009;18(6):427–36. doi: 10.1002/pds.1742. [DOI] [PubMed] [Google Scholar]
- 22.LePendu P, et al. Optimize first, buy later: analyzing metrics to ramp-up very large knowledge bases. The Semantic Web–ISWC 2010. 2010:486–501. [Google Scholar]
- 23.Shah NH, et al. Ontology-driven indexing of public datasets for translational bioinformatics. BMC Bioinformatics. 2009;10(Suppl 2):S1. doi: 10.1186/1471-2105-10-S2-S1. [DOI] [PMC free article] [PubMed] [Google Scholar]
- 24.Chapman W, Chu D, Dowling J. Proceedings of the Workshop on BioNLP 2007: Biological, Translational, and Clinical Language Processing. Prague, Czech Republic: Association for Computational Linguistics; 2007. ConText: an algorithm for identifying contextual features from clinical text. [Google Scholar]
- 25.Schneeweiss S, et al. High-dimensional propensity score adjustment in studies of treatment effects using health care claims data. Epidemiology. 2009;20(4):512–22. doi: 10.1097/EDE.0b013e3181a663cc. [DOI] [PMC free article] [PubMed] [Google Scholar]