Abstract
Previous work shows that gene associations and network properties common between pairs of diseases can provide molecular evidence of comorbidity, but relationships among diseases may extend to larger groups. Formal concept analysis allows the study of multiple diseases based on a concept lattice whose structure indicates gene set commonality. We use the concept lattice for gene associations to evaluate the complexity of the relationships among diseases, and to identify concepts whose gene sets are candidates for further functional analysis. For this, we define a heuristic on the lattice structure that allows the identification of concepts whose gene sets indicate strong relationships among the included diseases, which are distinguished from other diseases in the family. Applying this approach to a family of renal diseases we demonstrate that this approach finds gene sets that may be promising for studying common (and differing) mechanism among a family of comorbid or phenotypically related diseases.
Introduction
Understanding similarity relationships among diseases is an important problem in translational bioinformatics. Such similarities can be used in refining disease classification (e.g., molecular nosology), identifying common etiology of comorbidities in genetic studies, and drawing analogies between related diseases for the purposes of identifying common treatments. While much work has been done to identify molecular similarity to confirm statistical comorbidity1,2,3,4, our motivation here is identifying common mechanisms among related or comorbid diseases. This work follows that of Bhavnani et al.5 who used network analysis to explore commonalities among renal diseases based on a gene expression data set. We instead use analysis that considers relational structures among the diseases and genes defined by this data, and as a result identifies relationships among groups of diseases rather than the pairwise relationships possible with network analysis.
Our approach is based on Formal Concept Analysis (FCA)6, in which we identify formal concepts (also known as, biclusters7 or bicliques8) from the gene-disease associations. These formal concepts indicate relationships hidden in the data among diseases that have the same set of associated genes, and genes that are associated with the same set of diseases. Ordering by a subconcept order, we get a mathematical structure called a lattice that has useful properties in reasoning about concepts and, for our purposes, dependence/independence among sets of diseases.
FCA has three advantages over the network analysis used by most of the prior work. First, it allows representation of relationships (concepts) among several diseases, which can be subtle and difficult to see in bipartite graphs without heuristics. Second, it results in an algebraic structure that allows us to consider relationships among concepts that are difficult to identify in graphs. And, third, by adding additional gene annotations we can refine concepts to help identify functional gene relationships within disease groups.
It is important to note that, for our purposes, FCA is only useful in analysis of incidence relations (e.g., relating two types of data), which here is gene with disease, but includes relations such as SNP or structural variant with disease, gene with pathway, and gene with document. Previous work (e.g., Sam et al.9) has shown that common mechanism defined by graphs in the form of protein-protein interaction (PPI) or gene co-expression networks is important in defining similarity between diseases. And, while FCA can be used in analysis of such binary relations (relating one type of data), when applied to these networks it would identify shared neighbors of proteins or genes. The resulting concepts would focus on network hubs, rather than identifying the broader neighborhood needed to identify commonality across disease mechanism. This inability to include graph relationships in a general way poses a problem for us, but we show that we can extend the gene associations by graph neighbors to handle this case.
Our approach is a relatively straightforward application of FCA. We construct formal concepts that correspond to intersections of the disease-associated gene sets, and consider the lattice of those concepts. The structure of the lattice indicates the extent to which the gene sets overlap — the strength of disease similarity. We apply a heuristic to find substructures that indicate transition points in disease similarity, pinpointing concepts for further consideration. In the same renal data set as used by Bhavnani et al., we find 10 concepts representing different disease families, the two strongest of which help identify both known and unexpected relationships among the diseases.
In the following, we first survey the background literature on disease similarity and bioinformatics applications of FCA. We neglect the use of biclusters in bioinformatics data mining, as these approaches generally ignore the algebraic properties and lattice structure we use. In the methods, we introduce the needed aspects of FCA, and the tools and data sets used in the renal disease example. Our results include a sketch of a derivation of criteria describing common mechanism between a pair of diseases in terms of a graph representing molecular mechanism and gene sets that allows us to represent the relationship in terms of an incidence relation, the derivation of the heuristic to identify related disease families, and a demonstration of the approach on the renal disease data set.
Background
Previous work that identifies molecular relationships among diseases from gene-disease associations primarily falls into two classes. The first, uses network analysis to identify relationships among diseases based on a gene-disease incidence relation derived from experimental data5 and biomedical databases1,2,3,4,10,11. These approaches form a bipartite graph that can be analyzed for shared genes, but can also be projected to a disease (or gene) graph where two diseases are connected by an edge if they share at least one associated gene. This is the same construction used to build concept graphs such as in Molecular Concept Maps12 or ConceptGen13.
The second group approaches the problem by mapping genes into common subnetworks of a global network of gene products, such as protein-protein interactions3. These strategies both increase confidence in the biological significance of having overlapping genes between diseases, but also help identify cases where associated genes do not overlap but do impact apparent common mechanism4.
A key point that crosses the second group, encompassing the first, is that similarity of diseases can be defined in networks in terms of both overlapping gene sets, and connections between non-overlapping genes. This is the definition of the similarity measure in PhenoGO9, and also some of the papers on comorbidity3,4. This point is important enough that we reconsider its mathematical basis below. However, note that, membership in subnetworks can easily be used to define an incidence relation.
Other approaches do not quite fit into these strategies. For instance, Suthram et al.14 first finds modules in a PPI network and then scores them by gene expression to determine relationships. Also, molecular nosology does not require understanding mechanism, and instead can be approached through similarity of molecular profiles as is done by Hu and Agarwal15.
FCA is a relatively well-established field, and there have been several examples of its use for biological problems primarily for analysis of gene expression. These approaches either discretize the gene expression values to the framework we use16, or build generalized structures that allow recognition of patterns in expression values17,18. Other applications include classification of proteins by gene ontology and domain annotation19, identifying classifications of genes to recognize breast cancer biomarkers20, extending lists of genes in regulatory networks with related genes21, and capturing temporal dependencies within regulatory networks22.
As noted earlier, the formal concept corresponds to bicliques and biclusters defined in data mining strategies applied to bioinformatics. In particular, the subconcept relationship between concepts is also used in some data mining strategies (e.g., BLOSOM23, and compositional data mining7).
Methods
Formal Concept Analysis:
We use formalisms originally defined by Wille6. Our presentation is based on chapter 3 of the text by Davey and Priestly24, who use the original notation based on the German words for “concept”, “object” and “attribute”.
For each analysis, we assume a formal context 𝕂 = (G, M, I) where G is a set of objects, M is a set of attributes, and I ⊆ G × M is the incidence relations where (g, m) ∈ I if object g has attribute m. Unless otherwise indicated, G is our reference set of genes. The set M will be a set of diseases. Note that the incidence relation can be visualized as a bipartite graph as in Fig. 1.
Fig. 1.
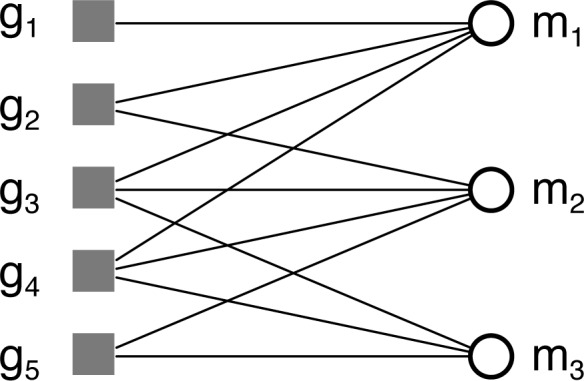
Example context with five objects and three attributes illustrated as a bipartite graph.
For sets A ⊆ G and B ⊆ M, we define the operators
whose composition yields a closure operator (e.g., A‴ = A′). A concept then is defined as a pair (A, B) of sets A ⊆ G and B ⊆ M such that A′ = B and B′ = A. It is important to note that the sets A and B in concept (A, B) are not arbitrary sets. Instead, the set A, the extent, is determined by B, the intent, and vice versa.
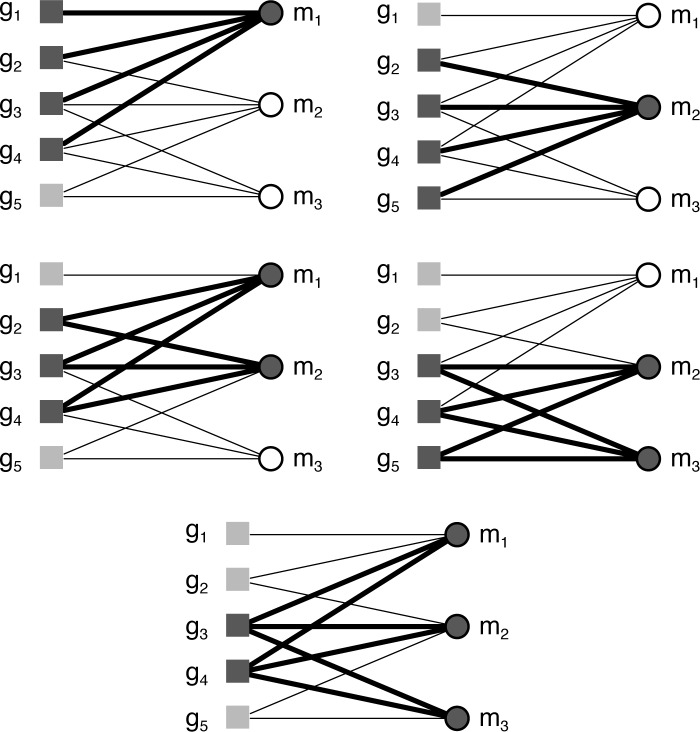
Fig. 2 uses bicliques to illustrate the formal concepts for a simple context represented as a bipartite graph. There are five non-trivial concepts for this example, two involving one attribute, two involving two attributes, and one involving three. This contrasts with the projection to a simple graph of attributes used in network analysis, which yields only three pairwise relationships (Fig. 3). Two of these relationships correspond to the concepts involving two attributes, and the other to the concept involving three attributes. Clearly, the projection loses information about the relationships in the data that are captured by definition in the formal concepts.
Fig. 2.
Bicliques illustrating non-trivial concepts for context in Fig. 1.
Fig. 3.
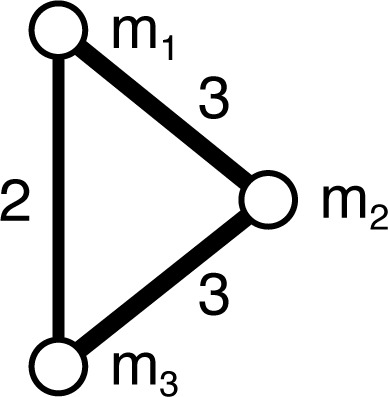
Unipartite “disease”-projection for context in Fig. 1. Edge weights indicate the number of common objects.
A concept (A1, B1) is said to be a subconcept of the concept (A2, B2) whenever A1 ⊆ A2 (or, equivalently, B1 ⊇ B2), which defines an order written (A1, B2) ≤ (A2, B2). The concept c1 covers a concept c2, written c1 ≺ c2, if there is no concept c3 such that c1 ≤ c3 ≤ c2. The order with the set of concepts for the context 𝕂 determines a structure called the concept lattice for 𝕂. Lattices are drawn as Hasse diagrams, in which two nodes are connected by an edge if the higher concept covers the lower concept. Fig. 4 illustrates the reduced lattice for the concepts of the example context in Fig. 1. The reduced representation labels a concept c by an object gi if c = ({gi}″, {gi}′) and similarly for attributes. All concepts above an object label (below an attribute label) include that object (attribute). The largest concept relative to the order is called the top, and the smallest the bottom of the lattice.
Fig. 4.
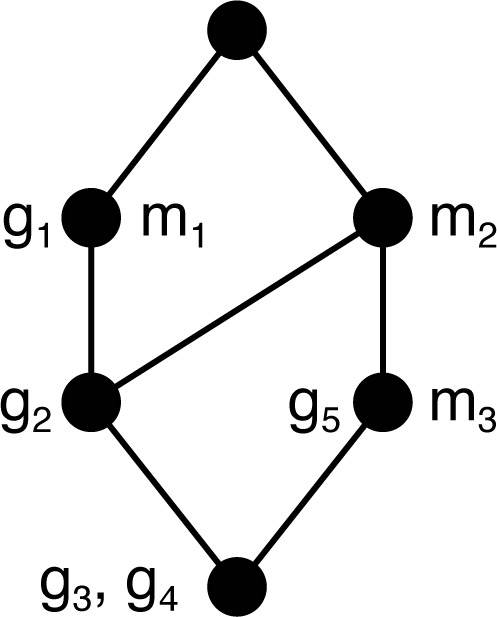
Concept lattice for context in Fig. 1.
Tools:
We compute the concept lattices using the FCA demo program included in the Colibri-Java library (code.google.com/p/colibri-java/) to produce dot format output (www.graphviz.org), which we then edit in OmniGraffle (www.omnigroup.com).
Datasets:
The data we analyze is the same as used by Bhavnani et al.5, which includes 747 genes determined to be either significantly up- or down-regulated in biopsy tissue from subjects one of seven chronic renal diseases relative to tissue from living donors (see Table 1). Three of these diseases (DN, MCD, and TMD) have small numbers of subjects, and also a relatively smaller number of associated genes. We also use the Michigan Molecular Interactions (MiMI)25 database to find genes whose protein products interact with those of the renal disease genes.
Table 1.
Diseases and number of associated up- and down-regulated genes.
| Disease | Up | Down |
|---|---|---|
| Systemic lupus erythematosus (SLE) | 325 | 114 |
| Focal & segmental glomerulosclerosis (FSGS) | 277 | 147 |
| Membranous glomerulonephritis (MGN) | 128 | 103 |
| IgA Nephropathy (IgAN) | 16 | 119 |
| Diabetic Nephropathy (DN) | 50 | 21 |
| Thin membrane disease (TMD) | 24 | 8 |
| Minimal change disease (MCD) | 1 | 2 |
Results
In the following, we outline the use of FCA to reason about similarity among a set of diseases. We start by addressing what it means for two diseases to be similar by having shared molecular mechanism, and discuss how we can approach this with FCA. Then we consider the renal disease data set from Bhavnani et al., first looking at the concept lattice to assess similarity, and, second, focusing on a sublattice indicated by the structure of the lattice to consider suitability for further analysis.
Network Dependence:
As discussed above, the definition of similarity that has been used2,3,4,9 is that either the set of genes overlap or there is some structural connection in a network (e.g., a shared edge in a PPI network, or co-occurrence in a cell-signaling feedback loop). Here we give a sketch of why this is a reasonable definition assuming that we can define a global graph showing how gene products interact in cellular systems. We let Γ = (G, E) be this (simple) graph where G is the set of all genes, and an edge indicates that gene products interact, or are closely involved in a biochemical event. In this setting, two diseases will share mechanism if the involved genes, sets A1, A2 ⊆ G, determine subgraphs Γ(A1), Γ(A2) that are non-independent. (We assume these subgraphs are connected.)
Our problem is analogous to deciding whether two vector spaces V1, V2 are independent, which is precisely when dim(V1 + V2) = dim V1 + dim V2 where the dimension of a vector space V is the number of vectors in a basis of V. The analogue of a vector space for graphs is a graphic matroid 26 of a graph, where a basis is a spanning tree of the graph. And, the analogue of vector space dimension is the matroid rank ρ, which is the number of edges in a spanning tree of the graph. For the (connected) subgraph Γ(A) determined by the gene set A ⊆ G, the rank is |A| − 1.
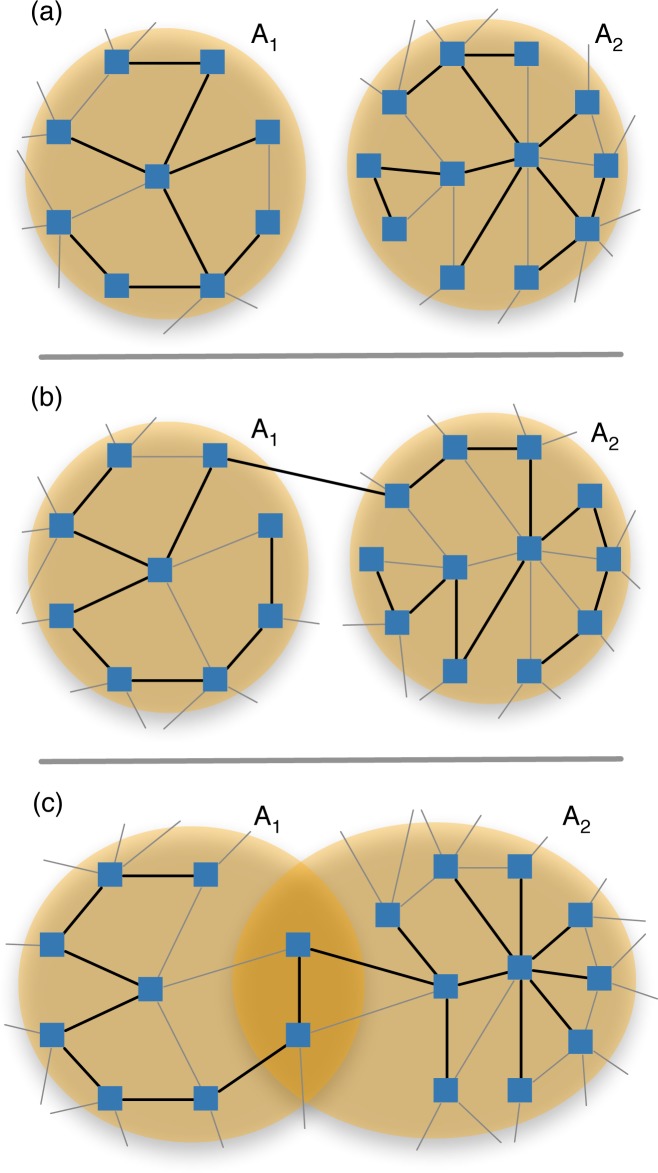
So, our problem is actually determining whether ρ (Γ(A1 ∪ A2)) = ρ (Γ(A1)) + ρ (γ(A2)). Since the righthand side is |A1| + |A2| − 2, this happens only when Γ(A1 ∪ A2) is spanned by a forest of two disconnected spanning trees (Fig. 5(a)). Otherwise, if there was a single spanning tree, the matroid rank would be either one larger (Fig. 5(b)), or at least one smaller (Fig. 5(c)). Therefore, non-independence occurs when the subgraph Γ(A1∪A2) has a connected spanning tree. This can occur because the gene sets are not disjoint A1 ∩ A2 ≠ ∅, and/or there is at least one edge (g1, g2) ∈ E where g1 ∈ A1 and g2 ∈ A2. This is precisely the condition used in the earlier papers.
Fig. 5.
Illustration of cases for subgraph Γ(A1 ∪ A2) of graph Γ induced by gene sets A1 and A2: (a) independence (ρ = 19), (b) dependent with connecting edge (ρ = 20), (c) dependent with overlapping genes (ρ = 18). Darker edges indicate spanning trees.
For us, this means that we cannot use formal concepts directly on the gene-disease associations and be sure that we have a complete picture of similarity, because we only deal with intersections of the sets of associated genes. We can handle this by extending each gene set Ai, i = 1, 2 by the genes 𝒩 (Ai) ∩ Aj, i ≠ j = 1, 2, corresponding to the overlap of the other gene set with neighbors of the gene products in some network representing molecular interactions. So, in defining our context for FCA, we can extend the annotated genes for each disease in this way. In our analysis of the renal disease example, we extend the annotated genes by neighbors in the MiMI PPI database25.
Disease Dependence:
Having reduced the problem of deciding similarity to inspecting intersections of gene sets associated with diseases, we can stay completely within the concept lattice to find relationships among them. In particular, we want to find families of diseases that are maximal in the sense that if we add another disease, the set of shared genes is relatively smaller. As an example, suppose we have three diseases m1, m2, m3 where m1 and m2 share a large proportion of their associated genes, m3 shares relatively few with each of m1 and m2, and nearly none or none with both (Fig. 6). In this scenario, the gene set cardinalities drop significantly when subconcepts involving m1 and m2 are formed by adding m3. In this sense, m3 delineates the sub-lattice of super-concepts of the concept with intent {m1, m2}.
Fig. 6.
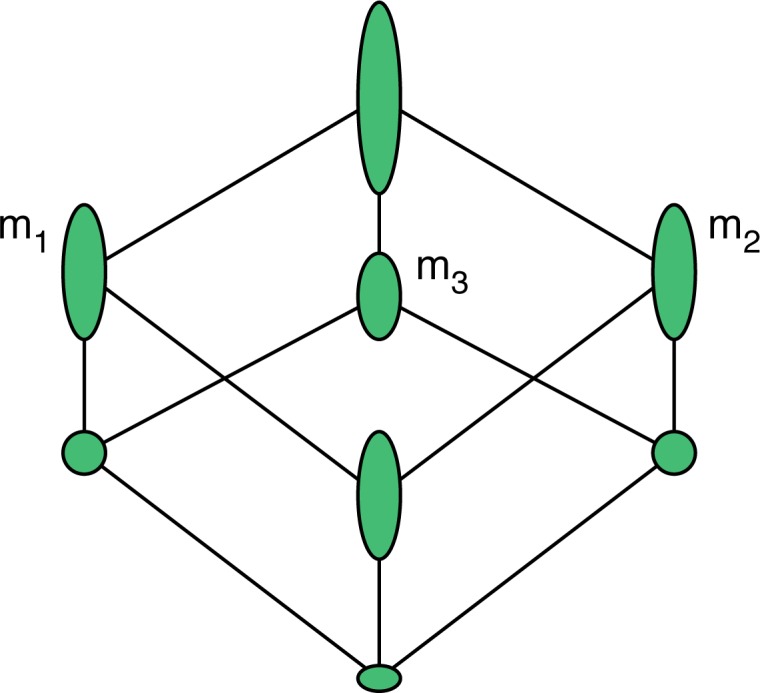
Concept lattice for diseases {m1, m2, m3} where m1 and m2 share most genes, and m3 shares some with each and few to none with both. Node height indicates cardinality of extent.
In general, if we want to identify these maximal families, we need to find the concepts that have subconcepts with dramatically smaller extent. This can be done by traversing the concept lattice from the coatoms (concepts covered by top), and visiting subconcepts with maximal extent looking for significant drops in the size of the extent. The following heuristic uses the ratio of extent size from subconcept to superconcept to identify these transitions, testing against a threshold θ.
let C ← ∅
let P ← coatoms
while P ≠ ∅︀ do
select p ∈ P
let c ← arg max(A,B)≺p |A|
if extent(c) / extent(p) ≤ θ then
let C ← C ∪ {p}
end if
let P ← P ∪ {c}
end while
When complete, the set C contains the concepts representing the strongest families in the lattice. By visiting only the largest subconcepts, the heuristic generally avoids enumerating the full lattice. We can further bound the time required by adding a condition on the minimum extent to step 9.
To quantify the similarity among the discovered families of diseases, we use the Jaccard coefficient defined as |∩A∈ℱ A| / |∪A∈ℱ A| for each family ℱ. We can also substitute the union of superconcept extents into the denominator as an alternative measure of the relationship strength.
Similarity of Renal Diseases:
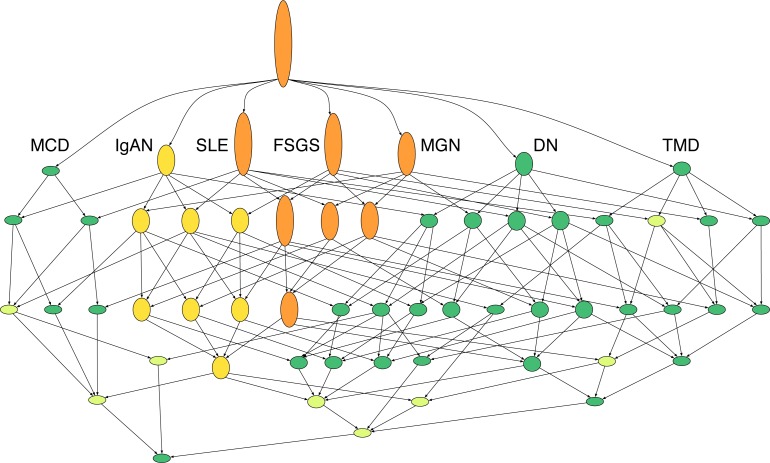
We now consider the renal disease data set from Bhavnani et al., starting with the context of all 747 genes extended by PPI neighbors as objects, the seven diseases as attributes, and the incidence relation determined by whether the gene is significantly up- or down-regulated in the disease. Applying the heuristic (with θ = 1/2) to this lattice finds ten concepts (listed in Table 2 and highlighted in Fig. 7) representing the most strongly related disease families primarily involving DN, FSGS, IgAN, MGN and SLE. The apparent relationships revealed by the lattice correspond to what we would expect based on the fact that these diseases share essential clinical and pathophysiological features (degree of tubulointerstitial damage secondary to glomerular filtration barrier failure driven proteinuria). However, as noted by Bhavnani et al., both MCD and TMD have small subject counts, and as a result have few significant regulatory associations. So, we cannot be sure that this is not the cause of their being relatively independent in the lattice.
Table 2.
Renal disease families identified by heuristic with θ = 1/2.
| Concept | Genes | Similarity |
|---|---|---|
| FSGS-MGN-SLE | 255 | 0.38 |
| FSGS-IgAN-MGN-SLE | 133 | 0.19 |
| DN-FSGS-IgAN-MGN-SLE | 35 | 0.048 |
| FSGS-TMD | 21 | 0.039 |
| FSGS-MGN-SLE-TMD | 11 | 0.016 |
| IgAN-MCD-SLE | 4 | 0.007 |
| FSGS-IgAN-MGN-SLE-TMD | 4 | 0.006 |
| DN-IgAN-MCD-SLE | 2 | 0.003 |
| DN-FSGS-IgAN-MGN-SLE-TMD | 2 | 0.003 |
| FSGS-IgAN-MCD-MGN-SLE | 2 | 0.0002 |
Fig. 7.
Concept lattice for seven renal diseases with PPI extended gene sets. Extents are hidden, but node height indicates relative cardinality of the extent. Concepts found by the heuristic are highlighted, with the sublattice for IgAN-FSGS-MGN-SLE in yellow and including the sublattice for FSGS-MGN-SLE in orange.
Focusing on a Sublattice:
The second largest concept, FSGS-IgAN-MGN-SLE, is interesting because the extent is 85% of the union of the extents of its super-concepts, meaning the associated genes are relatively well preserved in the intersection. This concept has 133 genes in its extent, while the largest extent of its subconcepts (the one with DN) has only 35 genes. Note that the sublattice above this concept represents the same data set that Bhavnani et al. focus on in their final analysis, as they drop DN, MCD and TMD for gene set size issues. In our case, the extended gene set for DN has 140 genes, and so could have a stronger overlap with these four diseases than it does. The role that DN plays in delineating this sublattice may be worth evaluating, but we will primarily study the role of IgAN.
There are a couple of things to observe about how IgAN fits within the selected sublattice. The first observation is that the concepts involving IgAN in the selected sublattice all have roughly the same number of genes. This suggests that the genes initially identified with IgAN are also common to the three other diseases, since the size of the extents only change slightly for concepts intersecting IgAN with these diseases. And, the second observation, is that MGN, FSGS and SLE have a large sets of genes in common, but this set is not common with IgAN. In this way, IgAN helps identify the concept FSGSMGN-SLE by the heuristic criteria — the concepts that include IgAN at the same level and the immediate subconcept all have more than 100 genes fewer. These observations suggest two questions: (1) what characterizes the commonality between IgAN and the other three diseases, and (2) what characterizes the genes common among FSGS, MGN and SLE, but not associated with IgAN? For these questions, we use more traditional set enrichments to help understand the constructed gene sets.
Interpreting Gene Sets:
Performing enrichment analysis using Genomatix GePS (www.genomatix.de) on the 133 genes common among FSGS, IgAN, MGN and SLE, we see that genes are enriched for the terms extracellular matrix, regulation of biological process, glomerulonephritis and mesangial and epithelial cells, fibroblasts (Tables 3–5, left column). These annotations nicely summarize the key biological processes and cell lineages known to be activated in progressive kidney disease irrespective of underlying disease categories; in other words, features shared by all of these diseases.
Table 3.
Enriched GO molecular function and cellular component categories for FSGS-IgAN-MGN-SLE and FSGS-MGN-SLE-specific gene sets.
| FSGS-IgAN-MGN-SLE | (FSGS-MGN-SLE)-specific | ||
|---|---|---|---|
| GO Molecular Function | |||
|
| |||
| GO-Term | P-value | GO-Term | P-value |
| protein binding | 4.94E-14 | protein binding | 8.10E-12 |
| transcription factor activity | 4.94E-09 | protein dimerization activity | 6.21E-07 |
| transcription regulator activity | 5.13E-08 | enzyme inhibitor activity | 1.16E-06 |
| binding | 4.31E-07 | transcription repressor activity | 3.20E-06 |
| transcription repressor activity | 3.78E-06 | MHC class II receptor activity | 1.04E-05 |
| double-stranded DNA binding | 1.78E-05 | receptor binding | 1.05E-05 |
| protein dimerization activity | 2.07E-05 | platelet-derived growth factor binding | 1.62E-05 |
| sequence-specific DNA binding | 8.33E-05 | collagen binding | 1.87E-05 |
| extracellular matrix binding | 1.08E-04 | transcription factor activity | 2.78E-05 |
| transcription factor binding | 1.14E-04 | growth factor binding | 5.12E-05 |
| GO Cellular Component | |||
| GO-Term | P-value | GO-Term | P-value |
| extracellular region part | 5.31E-11 | extracellular region part | 3.16E-16 |
| extracellular space | 3.15E-10 | extracellular space | 1.14E-15 |
| extracellular region | 7.20E-07 | MHC protein complex | 6.24E-14 |
| extracellular matrix | 4.95E-06 | extracellular region | 1.66E-12 |
| stored secretory granule | 1.34E-05 | MHC class II protein complex | 3.96E-10 |
| platelet alpha granule | 4.68E-05 | extracellular matrix | 9.26E-10 |
| platelet alpha granule lumen | 1.41E-04 | proteinaceous extracellular matrix | 7.49E-07 |
| cytoplasmic membrane-bounded vesicle lumen | 1.58E-04 | stored secretory granule | 3.60E-06 |
| vesicle lumen | 1.96E-04 | lysosomal membrane | 6.35E-06 |
| proteinaceous extracellular matrix | 6.55E-04 | platelet alpha granule | 9.65E-06 |
Table 5.
Enriched disease and tissue categories for FSGS-IgAN-MGN-SLE and FSGS-MGN-SLE-specific gene sets.
| FSGS-IgAN-MGN-SLE | (FSGS-MGN-SLE)-specific | ||
|---|---|---|---|
| Genomatix Disease Association | |||
|
| |||
| Disease | P-value | Disease | P-value |
| Glomerulonephritis | 9.97E-15 | Glomerulonephritis | 1.13E-14 |
| Nephritis | 3.87E-11 | Glomerulonephritis, Membranous | 3.91E-11 |
| Growth Retardation | 9.32E-11 | Arterial Injury | 5.77E-11 |
| Arterial Injury | 1.83E-10 | Pancreatic Neoplasms | 4.69E-10 |
| Glomerulonephritis, Membranous | 7.46E-09 | Melanoma | 7.17E-10 |
| Hypoxia | 8.21E-09 | Carcinoma, Hepatocellular | 2.04E-09 |
| Carcinoma, Hepatocellular | 1.72E-08 | Nephritis | 3.27E-09 |
| Hyperoxia | 8.31E-08 | Osteosarcoma | 6.86E-09 |
| Osteosarcoma | 8.79E-08 | Pre Eclampsia | 7.36E-09 |
| Prostate Carcinoma | 1.48E-07 | Prostate Neoplasm | 9.78E-09 |
| Glioblastoma | 1.59E-07 | Growth Retardation | 1.04E-08 |
| Leiomyoma | 1.60E-07 | Neointima | 1.86E-08 |
| Neointima | 1.73E-07 | Fibrosis | 2.35E-08 |
| Liver Cirrhosis | 1.83E-07 | Plasma Cell Myeloma | 3.76E-08 |
| Fibrosarcoma | 1.87E-07 | Liver Cirrhosis | 5.44E-08 |
| Fibrosis | 2.12E-07 | Lupus Erythematosus, Systemic | 7.53E-08 |
| Hypertrophy | 3.57E-07 | Disease Susceptibility | 7.57E-08 |
| Vascular Diseases | 4.13E-07 | Leiomyoma | 1.05E-07 |
| Blood Loss | 5.30E-07 | Neoplasm Metastasis | 1.43E-07 |
| Genomatix Tissue Association | |||
| Tissue | P-value | Tissue | P-value |
| Glomerulonephritis | 9.97E-15 | Glomerulonephritis | 1.13E-14 |
| Nephritis | 3.87E-11 | Glomerulonephritis, Membranous | 3.91E-11 |
| Growth Retardation | 9.32E-11 | Arterial Injury | 5.77E-11 |
| Arterial Injury | 1.83E-10 | Pancreatic Neoplasms | 4.69E-10 |
| Glomerulonephritis, Membranous | 7.46E-09 | Melanoma | 7.17E-10 |
| Hypoxia | 8.21E-09 | Carcinoma, Hepatocellular | 2.04E-09 |
| Carcinoma, Hepatocellular | 1.72E-08 | Nephritis | 3.27E-09 |
| Hyperoxia | 8.31E-08 | Osteosarcoma | 6.86E-09 |
| Osteosarcoma | 8.79E-08 | Pre Eclampsia | 7.36E-09 |
| Prostate Carcinoma | 1.48E-07 | Prostate Neoplasm | 9.78E-09 |
| Glioblastoma | 1.59E-07 | Growth Retardation | 1.04E-08 |
| Leiomyoma | 1.60E-07 | Neointima | 1.86E-08 |
| Neointima | 1.73E-07 | Fibrosis | 2.35E-08 |
| Liver Cirrhosis | 1.83E-07 | Plasma Cell Myeloma | 3.76E-08 |
| Fibrosarcoma | 1.87E-07 | Liver Cirrhosis | 5.44E-08 |
| Fibrosis | 2.12E-07 | Lupus Erythematosus, Systemic | 7.53E-08 |
| Hypertrophy | 3.57E-07 | Disease Susceptibility | 7.57E-08 |
| Vascular Diseases | 4.13E-07 | Leiomyoma | 1.05E-07 |
| Blood Loss | 5.30E-07 | Neoplasm Metastasis | 1.43E-07 |
On the other hand, the gene set of 120 genes specific to the FSGS-MGN-SLE concept (formed by subtracting out the gene set for the FSGS-IgANMGN-SLE concept) show a significant enrichment for MHC I and II molecules, along with terms inflammation, immune response, antigen presentation and processing (Tables 3–5, right column). This indicates a significant presence of infiltrating cells in the renal tissue (presumably from the macrophage lineage). This is a well known concept for SLE, but had not been described for MGN and FSGS in the past. Interestingly, IgAN appears to be, according to the lattice structure, not as prominently affected by these interstitial inflammatory process. This is an interesting finding, as both SLE and IgAN are diseases characterized by a primary glomerular immune process, but SLE can show aggressive interstitial infiltrates, which would explain the specific enrichment profiles observed above. Ongoing studies by our group are currently characterizing the specific expression profiles generated by intrarenal macrophages in human and mice in SLE.
Adding Regulation:
One of the nice aspects of FCA is that it allows us to add attributes to our analysis within the same framework. Since we have the direction of regulation for the renal disease associated genes, we can find the concept lattice using attributes indicating this direction: MGNup, and MGNdown. We already know from Bhavnani et al.5 that the regulatory direction partitions the genes: if a gene is up in one disease, it is up in all diseases. Though, in their case, it took some work to find this fact, it is immediate in the concept lattice, which is partitioned into disjoint lattices based on concepts where genes are up-regulated and genes that are down-regulated. It is easy to see that, if we combine this regulatory context with the context where incidence is either upor down-regulation, then the concept lattice would remain partitioned by regulation. However, since we have added PPI network neighbors to gene sets for the diseases, it is not necessarily the case that these added genes should have consistent regulation with their neighbors. So, concepts in the lattice for the combined context may have both up and down regulated genes, which would mean that PPI edges crossed regulatory classes. But, at least for the FSGS-IgAN-MGN and FSGS-IgAN-MGN-SLE concepts, the PPI edges preserve regulation: only connecting up-regulated genes to up-regulated genes.
Discussion
Though recent work has indicated that there are common molecular mechanisms underlying comorbidities between diseases, determining the molecular mechanism driving families of comorbid or phenotypically similar diseases remains a challenging problem. Getting to this mechanism requires first that we be able to identify genes that are likely involved in the commonalities and differences between diseases. Through the work of Bhavnani et al. we see that network analysis allows us to explore pairwise relationships between diseases, but that there are limitations when dealing with higher dimension relationships. We have demonstrated that FCA identifies relationships that cannot be seen without engaging in heuristic reasoning in networks, and how the lattice structure provides a picture of how strongly related the diseases are. Our analysis of the renal disease data set also shows that the concepts that we find represent unexpected relationships among diseases that are worth considering further. And, this is without employing functional categories to try to narrow the sets, which we feel is very promising.
The challenge with FCA is that many of the formal concepts may not be useful in themselves — only a few indicating relationships that may be worthy of trying to develop into systems. The renal disease data set has a relatively small lattice with 57 concepts, but a data set more representative of the DN, MCD and TMD populations would increase the gene associations for those diseases, and potentially more than double the size of the lattice. Note that we are at the limit of what is reasonable to try to visualize as a Hasse diagram, and heuristics, like the one we describe, are needed to focus on potentially interesting sublattices.
For future questions of determining mechanism, whether using FCA for further functional analysis of the identified concepts is useful is not clear. Because the concepts of a context extended by adding functional attributes are based on intersections of gene sets, this construction finds within gene-disease concepts those subconcepts with similar function. This approach is only useful while we are interested in classes of genes that somehow work together, and an alternate approach will be necessary when we are ready to consider complementary mechanistic roles.
Table 4.
Enriched GO biological process categories for FSGS-IgAN-MGN-SLE and FSGS-MGN-SLE-specific gene sets.
| FSGS-IgAN-MGN-SLE | (FSGS-MGN-SLE)-specific | ||
|---|---|---|---|
| GO Biological Process | |||
|
| |||
| GO-Term | P-value | GO-Term | P-value |
| negative regulation of biological process | 3.96E-19 | immune system process | 2.20E-20 |
| negative regulation of cellular process | 4.05E-18 | positive regulation of biological process | 3.87E-20 |
| positive regulation of biological process | 3.00E-16 | negative regulation of biological process | 3.20E-19 |
| regulation of biological process | 5.00E-16 | response to stimulus | 1.43E-18 |
| biological regulation | 5.64E-16 | immune response | 1.88E-17 |
| regulation of cellular process | 3.82E-15 | response to stress | 3.09E-16 |
| positive regulation of cellular process | 3.54E-14 | response to wounding | 3.49E-16 |
| developmental process | 6.48E-14 | negative regulation of cellular process | 3.71E-16 |
| regulation of multicellular organismal process | 7.60E-14 | positive regulation of cellular process | 8.93E-15 |
| apoptosis | 2.38E-13 | regulation of biological process | 1.08E-14 |
| response to stress | 2.77E-13 | biological regulation | 1.45E-14 |
| programmed cell death | 3.05E-13 | multi-organism process | 5.09E-14 |
| regulation of developmental process | 3.30E-13 | antigen processing and presentation | 8.62E-14 |
| multicellular organismal development | 4.11E-13 | apoptosis | 4.99E-13 |
| organ development | 1.71E-12 | programmed cell death | 6.85E-13 |
| system development | 3.03E-12 | regulation of multicellular organismal process | 2.42E-12 |
| cell death | 4.65E-12 | cell death | 6.90E-12 |
| death | 5.13E-12 | death | 7.83E-12 |
| anatomical structure development | 5.52E-12 | regulation of apoptosis | 8.16E-12 |
Acknowledgments
Thank you to the TBI reviewers whose comments helped improve the presentation of our work.
Partially supported by NIH grants
P30 DK081943-01,
R01 DK079912, and
U54 DA021519 01A1
References
- 1.Goh KI, Cusick ME, Valle D, Childs B, Vidal M, Barabási AL. The human disease network. Proc Natl Acad Sci USA. 2007 May;104(21):8685–8690. doi: 10.1073/pnas.0701361104. [DOI] [PMC free article] [PubMed] [Google Scholar]
- 2.Lee DS, Park J, Kay KA, Christakis NA, Oltvai ZN, Barabási AL. The implications of human metabolic network topology for disease comorbidity. Proc Natl Acad Sci USA. 2008 Jul;105(29):9880–9885. doi: 10.1073/pnas.0802208105. [DOI] [PMC free article] [PubMed] [Google Scholar]
- 3.Park J, Lee DS, Christakis NA, Barabási AL. The impact of cellular networks on disease comorbidity. Mol Syst Biol. 2009 Apr 5;:1–7. doi: 10.1038/msb.2009.16. [DOI] [PMC free article] [PubMed] [Google Scholar]
- 4.Le DH, Kwon YK. The effects of feedback loops on disease comorbidity in human signaling networks. Bioinformatics. 2011 Feb;:1113–1120. doi: 10.1093/bioinformatics/btr082. [DOI] [PubMed] [Google Scholar]
- 5.Bhavnani SK, Eichinger F, Martini S, Saxman P, Jagadish HV, Kretzler M. Network analysis of genes regulated in renal diseases: implications for a molecular-based classification. BMC Bioinformatics. 2009;10(Suppl 9):S3. doi: 10.1186/1471-2105-10-S9-S3. [DOI] [PMC free article] [PubMed] [Google Scholar]
- 6.Ganter B, Wille R. Formal Concept Analysis: Mathematical Foundations. Springer-Verlag; 1996. [Google Scholar]
- 7.Jin Y, Murali TM, Ramakrishnan N. Compositional mining of multirelational biological datasets. ACM Trans Knowl Discov Data. 2008 Mar 2;(1):2:1–2:35. [Google Scholar]
- 8.Dawande M, Keskinocak P, Swaminathan J. On bipartite and multipartite clique problems. J Algorithms. 2001:388–403. [Google Scholar]
- 9.Sam L, Liu Y, Li J, Friedman C, Lussier YA. Discovery of protein interaction networks shared by diseases. Pacific Symposium on Biocomputing. 2007;12:76–87. [PMC free article] [PubMed] [Google Scholar]
- 10.Bauer-Mehren A, Bundschus M, Rautschka M, Mayer MA, Sanz F, Furlong LI. Gene-disease network analysis reveals functional modules in mendelian, complex and environmental diseases. PLoS ONE. 2011;6(6):e20284. doi: 10.1371/journal.pone.0020284. [DOI] [PMC free article] [PubMed] [Google Scholar]
- 11.Barrenas F, Chavali S, Holme P, Mobini R, Benson M. Network properties of complex human disease genes identified through genome-wide association studies. PLoS ONE. 2009;4(11):e8090. doi: 10.1371/journal.pone.0008090. [DOI] [PMC free article] [PubMed] [Google Scholar]
- 12.Rhodes DR, Kalyana-Sundaram S, Tomlins SA, et al. Molecular concepts analysis links tumors, pathways, mechanisms, and drugs. Neoplasia. 2007 May;9(5):443–454. doi: 10.1593/neo.07292. [DOI] [PMC free article] [PubMed] [Google Scholar]
- 13.Sartor MA, Mahavisno V, Keshamouni VG, et al. ConceptGen: a gene set enrichment and gene set relation mapping tool. Bioinformatics. 2010 Feb;26(4):456–463. doi: 10.1093/bioinformatics/btp683. [DOI] [PMC free article] [PubMed] [Google Scholar]
- 14.Suthram S, Dudley JT, Chiang AP, Chen R, Hastie TJ, Butte AJ. Network-based elucidation of human disease similarities reveals common functional modules enriched for pluripotent drug targets. PLoS Comput Biol. 2010;6(2):e1000662. doi: 10.1371/journal.pcbi.1000662. [DOI] [PMC free article] [PubMed] [Google Scholar]
- 15.Hu G, Agarwal P. Human Disease-Drug Network Based on Genomic Expression Profiles. PLoS ONE. 2009 Aug;4(8):e6536. doi: 10.1371/journal.pone.0006536. [DOI] [PMC free article] [PubMed] [Google Scholar]
- 16.Choi V, Huang Y, Lam V, Potter D, Laubenbacher R, Duca K. Using formal concept analysis for microarray data comparison. J Bioinform Comput Biol. 2008 Feb;6(1):65–75. doi: 10.1142/s021972000800328x. [DOI] [PubMed] [Google Scholar]
- 17.Kaytoue M, Kuznetsov S, Napoli A. Mining gene expression data with pattern structures in formal concept analysis. Inf Sci. 2010:1989–2001. [Google Scholar]
- 18.González Calabozo J, Peláez-Moreno C, Valverde-Albacete F. Gene Expression Array Exploration Using 𝒦-Formal Concept Analysis. In: Valtchev P, Jäschke R, editors. Formal Concept Analysis. Berlin, Heidelberg: Springer Berlin / Heidelberg; 2011. pp. 119–134. [Google Scholar]
- 19.Han MR, Chung HJ, Kim J, Noh DY, Kim J. Protein Classification from Protein-Domain and Gene-Ontology Annotation Information Using Formal Concept Analysis. In: Shi Y, van Albada G, Dongarra J, Sloot P, editors. Computational Science – ICCS. Springer Berlin / Heidelberg; 2007. 2007. pp. 347–354. [Google Scholar]
- 20.Motameny S, Versmold B, Schmutzler R. Formal Concept Analysis for the Identification of Combinatorial Biomarkers in Breast Cancer. In: Medina R, Obiedkov S, editors. Formal Concept Analysis. Berlin, Heidelberg: Springer Berlin / Heidelberg; 2008. pp. 229–240. [Google Scholar]
- 21.Gebert J, Motameny S, Faigle U, Forst CV, Schrader R. Identifying genes of gene regulatory networks using formal concept analysis. J Comput Biol. 2008 Mar;15(2):185–194. doi: 10.1089/cmb.2007.0107. [DOI] [PubMed] [Google Scholar]
- 22.Wollbold J, Huber R, Pohlers D, et al. Adapted Boolean network models for extracellular matrix formation. BMC Syst Biol. 2009;3(1):77. doi: 10.1186/1752-0509-3-77. [DOI] [PMC free article] [PubMed] [Google Scholar]
- 23.Zhao L, Zaki M, Ramakrishnan N. BLOSOM: a framework for mining arbitrary boolean expressions. KDD ’06: Proceedings of the 12th ACM SIGKDD international conference on Knowledge discovery and data mining. 2006. pp. 827–832.
- 24.Davey B, Priestley H. Introduction to lattices and order. 2nd ed. Cambridge Univ Press; 2002. [Google Scholar]
- 25.Tarcea VG, Weymouth T, Ade A, et al. Michigan molecular interactions r2: from interacting proteins to pathways. Nucleic Acids Res. 2009 Jan;37(Database issue):D642–6. doi: 10.1093/nar/gkn722. [DOI] [PMC free article] [PubMed] [Google Scholar]
- 26.Crapo H. Examples and Basic Concepts. In: White N, editor. Theory of Matroids. Cambridge University Press; 1986. pp. 1–28. [Google Scholar]


