Abstract
Purpose
Determine if the leveling off (‘plateau/inverted-U’ phenomenon) of vertical ActiGraph activity counts during running at higher speeds is attributable to the monitor’s signal filtering and acceleration detection characteristics.
Methods
Ten endurance-trained male participants [mean (SD) age= 28.2 (4.7) yrs] walked at 3, 5 and 7 km˙hr−1, and ran at 8, 10, 12, 14, 16, 18 and 20 km˙hr−1 on a force treadmill while wearing an ActiGraph GT3X monitor at the waist. Triaxial accelerations of the body’s center of mass (CoM) and frequency content of these accelerations were computed from the force treadmill data.
Results
GT3X vertical activity counts demonstrated the expected ‘plateau/inverted-U’ phenomenon. In contrast, vertical CoM accelerations increased with increasing speed (1.32 ± 0.26 g at 10 km˙hr−1 and 1.68 ± 0.24 g at 20 km˙hr−1). The dominant frequency in the CoM acceleration signals increased with running speed (14.8 ± 3.2 Hz at 10 km˙hr−1 and 24.8 ± 3.2 Hz at 20 km˙hr−1) and lay beyond the ActiGraph bandpass filter (0.25 to 2.5 Hz) limits.
Conclusion
CoM acceleration magnitudes during walking and running lie within the ActiGraph monitor’s dynamic acceleration detecting capability. Acceleration signals of higher frequencies that are eliminated by the ActiGraph bandpass filter may be necessary to distinguish among exercise intensity at higher running speeds.
Keywords: ActiGraph, Levelling-off, Plateau, Physical Activity
1. Introduction
Uniaxial ActiGraph activity monitors (ActiGraph, Pensacola, FL) are commonly worn on the hip to quantify the duration and intensity of physical activity (PA). These include the AM7164 and the GT1M monitors, which detect vertical accelerations and provide output in the form of activity counts. Vertical activity counts among different ActiGraph monitors are similar (John et al., 2010, Kozey et al., 2010). However, these devices cannot detect acceleration above a certain threshold (Fudge et al., 2007, John et al., 2010, Rothney et al., 2008, Rowlands et al., 2007, Brage et al., 2003). This threshold is attained when running at approximately 10 to 12 km˙hr−1 (10 to 12.5 METs) or when the monitors are tested on a mechanical device at a frequency of approximately 2.5 Hz (Brage et al., 2003, Fudge et al., 2007, John et al., 2010, Rothney et al., 2008, Rowlands et al., 2007). Beyond this threshold, there is an inverse curvilinear relationship between exercise intensity and activity counts. Thus, with increasing exercise intensity, there is a decrease in activity counts (Fudge et al., 2007, John et al., 2010, Rothney et al., 2008, Rowlands et al., 2007). This decrease in activity counts has been called the ‘plateau’ or the ‘inverted-U’ phenomenon (John et al., 2010, Brage et al., 2003, Rothney et al., 2008, Rowlands et al., 2007).
The plateau/inverted-U phenomenon results in similar vertical activity counts for two very different ambulation intensities. For example, ActiGraph activity monitors produce vertical activity counts of approximately 8200 counts˙min−1 for both walking at 8 km˙hr−1 (8 METs) and running at 18 km˙hr−1(19 METs) (John et al., 2010). ActiGraph monitors have been used in studies measuring PA in highly active populations and during sports (Hoch et al., 2011, Leek et al., 2010). The inability of ActiGraph uniaxial monitors to record activity counts during high intensity activity will result in the underestimation of vigorous PA.
While we are not aware of any empirical evidence explaining the plateau/inverted-U phenomenon, two theories have been proposed to provide possible reasons. One theory proposes that activity counts level off because uniaxial ActiGraph monitors detect accelerations in only the vertical direction (Brage et al., 2003, Cavagna et al., 1976). This theory is based on observations reporting that vertical accelerations of the center of mass (CoM) are fairly constant at higher running speeds (Brage et al., 2003, Cavagna et al., 1976). There is evidence that accelerations in the antero-posterior axis continue to increase until maximum sprinting speeds (Cavagna et al., 1976, Chang and Kram, 1999). Thus, it has been suggested that measuring both vertical and antero-posterior accelerations may produce activity counts that differentiate among higher running speeds (Brage et al., 2003). If this is true, the vector magnitude (VM) activity counts from the dual axes ActiGraph GT1M and the triaxial GT3X will not level off at higher speeds.
A second theory proposes that the plateau/inverted-U phenomenon is due to limitations in the monitor’s frequency filtering characteristics (Fudge et al., 2007, Rowlands et al., 2007). ActiGraph monitors detect accelerations with frequencies between 0.25 and 2.5 Hz. These band-pass filter limits may be inadequate because the frequency content of acceleration during running at faster speeds easily exceeds 2.5 Hz (Luhtanen and Komi, 1978, Alexander and Jayes, 1980).
To date, no study has compared the patterns of simultaneously measured triaxial CoM accelerations to activity counts from a multiaxial ActiGraph activity monitor or examined the frequency content of CoM accelerations at various running speeds. Obtaining CoM accelerations from measured ground reaction forces (GRF) may help determine if the plateau/inverted-U phenomenon is indeed due to a leveling off in vertical accelerations while running above moderate speeds (7 to 10 km˙hr−1) (Brage et al., 2003, Cavagna et al., 1976, Rowlands et al., 2007). Deriving frequency content of the acceleration signal may clarify the role of the ActiGraph band-pass filter in the leveling off of activity counts. Therefore, in this study we measured triaxial CoM accelerations, frequency content of the acceleration signals, and step frequency during walking and running at various speeds. Concurrently, triaxial activity count data using the GT3X were collected. We hypothesized that: a) measured CoM accelerations in all three axes would continue to increase beyond the speed when GT3X vertical activity counts begin to level off, b) VM activity counts from the GT3X would exhibit the plateau/inverted-U phenomenon, and c) frequency content of the measured CoM acceleration would exceed the ActiGraph band-pass filter limits during running at higher speeds.
2. Methods
Ten endurance-trained male participants (mean ± SD: age= 28.2 ± 4.7 yrs, height= 180.0 ± 3.4 cm, and mass= 75.0 ± 5.7 kg) were recruited from the University of Massachusetts, Amherst and the surrounding community. The experimental protocol was approved by the University of Massachusetts, Amherst Institutional Review Board and all participants provided written informed consent.
Participants visited the biomechanics laboratory where their height and mass were measured using a stadiometer and a physician’s scale, respectively. An elastic belt with the GT3X was secured around the waist on the anterior axillary line at the iliac crest. The GT3X detects accelerations between 0.05 to 2 g with frequency content between 0.25 to 2.5 Hz, sampled 30 times per second. The activity monitor was initialized to provide output from each individual directional axis and the triaxial VM using ActiLife software v. 4.3.0. (Actigraph, Pensacola, FL). Monitor firmware (v. 2.2.0.) remained unchanged throughout the study. ActiGraph monitors are usually worn on the hip due to the proximity of the hip to the body’s CoM. Movement of the CoM is considered to be representative of whole body movement because the CoM is sensitive to the position of all body segments. Monitor placement was counterbalanced between the left and right hip among subjects to avoid confounding due to a placement effect.
A reflective marker was affixed on the participant immediately above the GT3X. Marker movement during the exercise protocol was sampled at 240 Hz using an eight-camera motion capture system (Oqus 300, Qualisys, Gothenburg, Sweden). CoM location was determined from force platform data (see details in Data Processing and Analysis). The average trajectories of the CoM and the reflective marker during the exercise protocol were analyzed to determine if accelerations of the CoM represent those detected by the hip-worn ActiGraph GT3X.
2.1. Testing Protocol
The testing protocol consisted of a brief warm up, followed by level walking and running on a calibrated force treadmill (Athletic Republic, Fargo, ND) at different speeds. The treadmill was torque-driven and contained four strain gage force transducers (MC3A, AMTI, Watertown, MA) on the corners of the belt bed. The force transducers were interfaced to a digital computer through an amplifier (MiniAmp MSA-6, AMTI, Watertown, MA). The treadmill’s natural frequency (over 200 Hz) was well above the bandwidth of CoM accelerations during locomotion and does not contaminate the GRF with vibration artifacts (Alexander and Jayes, 1980). GRF data were sampled at 1200 Hz. Participants first completed the walking stages at 3, 5 and 7 km˙hr−1 and then ran at 8, 10, 12, 14, 16, 18, and 20 km˙hr−1. Each running stage commenced with the participant walking slowly after which a researcher rapidly increased the treadmill belt speed to match the desired stage speed. Participants walked and ran for a minimum of 60 seconds during each stage, followed by approximately 30 to 180 seconds rest before the next stage. The researcher recorded start and stop times for the 60 seconds at each stage speed to enable data identification and retrieval during analyses.
2.2. Data Processing and Analysis
GT3X activity counts were downloaded using the ActiLife software v. 4.3.0. One-second ActiGraph data were summed to obtain one-minute activity counts. Data from the force treadmill consisted of three-dimensional voltage signals from each force transducer. The voltages were low-pass filtered using a digital fourth-order recursive Butterworth filter with a cutoff frequency of 50 Hz, summed across the four force transducers, and converted to Newtons of force using the manufacturer-supplied calibration matrix. A heel-strike was identified when the vertical GRF rose above 25 N. GRF were scaled by body weight and reported in multiples of gravitational acceleration (g force) (Mullineaux et al., 2006). Body-weight (1g) was subtracted from the scaled GRF to derive forces representing net acceleration of the CoM. Step frequency was calculated from the vertical GRF by counting the number of heel-strikes during each one-minute exercise stage. GRF were decomposed into frequency domain components using Fourier transformation. A frequency domain graph depicts frequencies contained within the acceleration signal on the x-axis and the amplitude of individual frequencies on the y-axis. Frequency content provides information on the bandwidth (spread) of the various frequencies contained in an acceleration signal. Frequencies with higher amplitude are considered the predominant frequencies within the signal. In this study, the predominant frequencies at each speed per participant were quantified by the median frequency among all components that accounted for 99% of the total signal power.
Changes in CoM position and velocity were calculated by integration of the CoM acceleration. GT3X marker velocity was calculated by differentiation of the hip marker position. The relationship between CoM and hip marker trajectories in all three axes and their triaxial VMs were determined by calculating zero-lag cross-correlations, which assess the temporal synchrony of paired time series (Derrick et al., 1994). A correlation of +1 or −1 indicates in-phase signals, while a correlation of 0 indicates anti-phase signals. The deviation between the hip marker and CoM velocities were calculated at each 1% of the stride cycle.
The dependent variables were the individual axis CoM accelerations obtained from the force treadmill [vertical (FTV), antero-posterior (FTH) and lateral (FTL) directions], VM of the triaxial (FTVM) accelerations, the frequency content of FTV, step frequency (steps per second), and the individual (vertical, antero-posterior, lateral) and triaxial VM GT3X activity counts. One-way analyses of variance were used to identify a main effect for speed with level of significance set at p<0.05. If a significant main effect was detected, post-hoc pair-wise comparisons with Bonferroni corrections were made to locate the differences.
3. Results
3.1. Hip Marker and CoM Trajectory
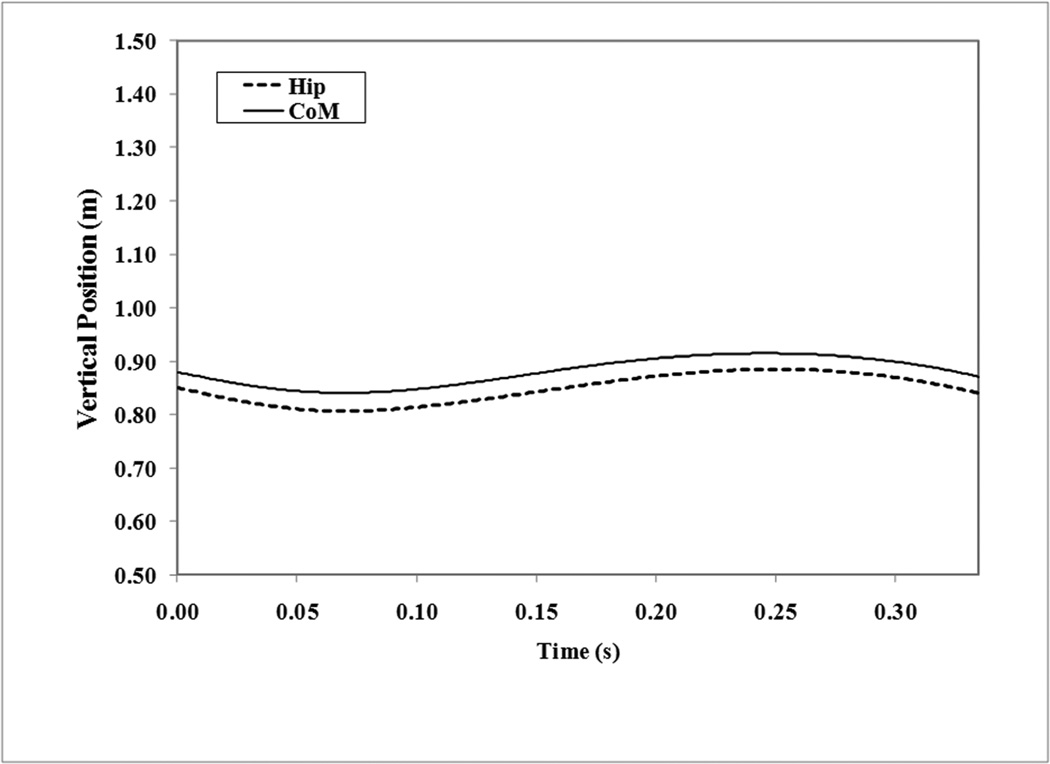
Figure 1 depicts time series data on the trajectories of the GT3X hip marker and the CoM during a single step for one subject while running at 14 km˙hr−1. The y-axis in this figure represents the varying height of the CoM and hip marker in reference to the treadmill belt. There was a close correspondence between the trajectories of the two variables. Overall, zero-lag cross-correlation between the GT3X marker and the CoM vertical velocities ranged from 0.71–0.83. During the stride cycle, the GT3X marker and CoM velocities were statistically similar to each other more than 87% in the vertical direction, 75% in the antero-posterior direction, 58% in the lateral direction, and 82% for the VM velocity. These data verify that accelerations at the CoM measured in this study represent accelerations detected by the hip-worn GT3X. Previous investigations have reported similar strong correlations between accelerations at the CoM and hip demonstrating similarity between the two variables (Breniere and Bril, 1998).
Figure 1.
Time series data on the trajectories of the CoM and hip marker during one step for one subject while running at 14 km˙hr−1. The hip marker was placed directly above the waist mounted GT3X monitor.
3.2. Force Treadmill Accelerations
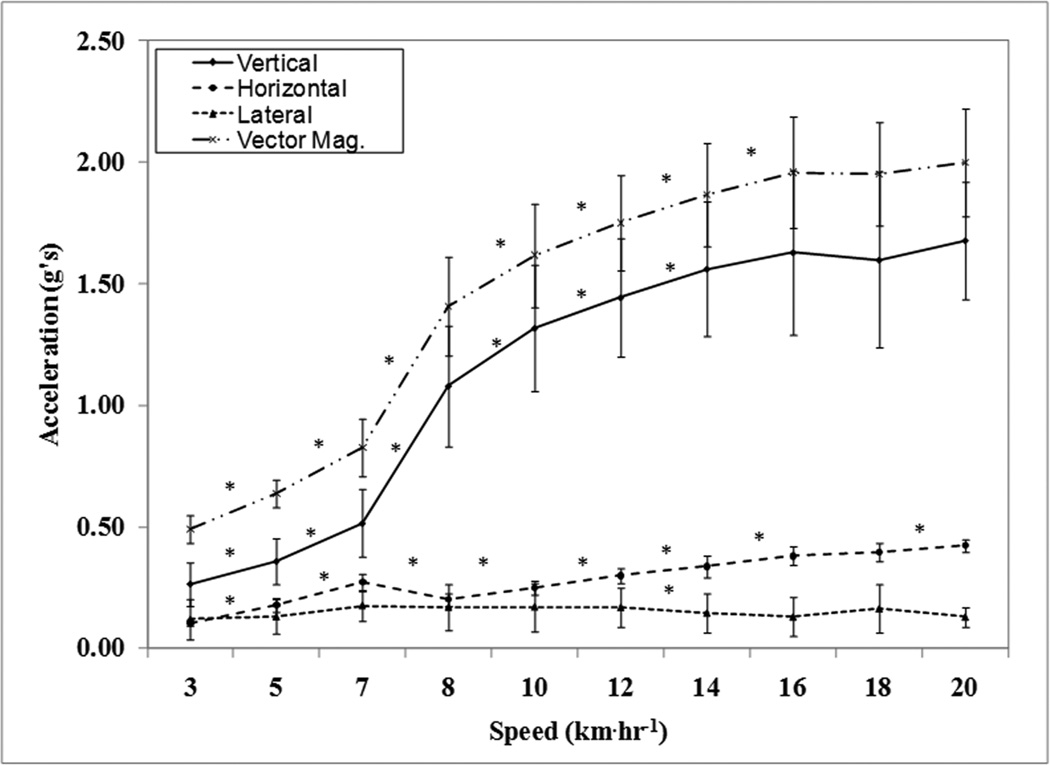
Mean force treadmill accelerations FTV, FTH, FTL, and FTVM are illustrated in Figure 2. Average FTV ranged between 0.27 ± 0.09 g (3 km˙hr−1) to 1.68 ± 0.24 g (20 km˙hr−1). Significant increases in FTV between consecutive speeds were observed from 3 to 14 km˙hr−1 (p<0.05). Interestingly, there was a significant decrease (p<0.05) in horizontal acceleration during the walk-run transition (see Figure 2). Average FTH ranged from 0.11 ± 0.01 g to 0.27 ± 0.04 g between the lowest and highest walking speeds, and from 0.20 ± 0.03 g to 0.42 ± 0.03 g across the running speeds. FTL remained relatively constant during the exercise protocol ranging between 0.12 ± 0.08 g at 3 km˙hr−1 and 0.18 ± 0.06 g at 7 km˙hr−1. A significant change between consecutive speeds in FTL was detected only between 12 and 14 km˙hr−1 (p<0.05). With increasing speed, FTVM showed a pattern similar to FTV, increasing significantly between consecutive speeds from 3 to 16 km˙hr−1 (p<0.05) and remaining relatively constant during the three fastest running speeds. Average FTVM between the lowest and highest speeds ranged from 0.49 ± 0.06 g to 2.0 ± 0.22 g.
Figure 2.
Mean (SD) of accelerations derived from the force treadmill in the vertical, antero-posterior, and lateral axes and their composite VM. * indicates significant differences between consecutive speeds.
3.3. GT3X Activity Counts
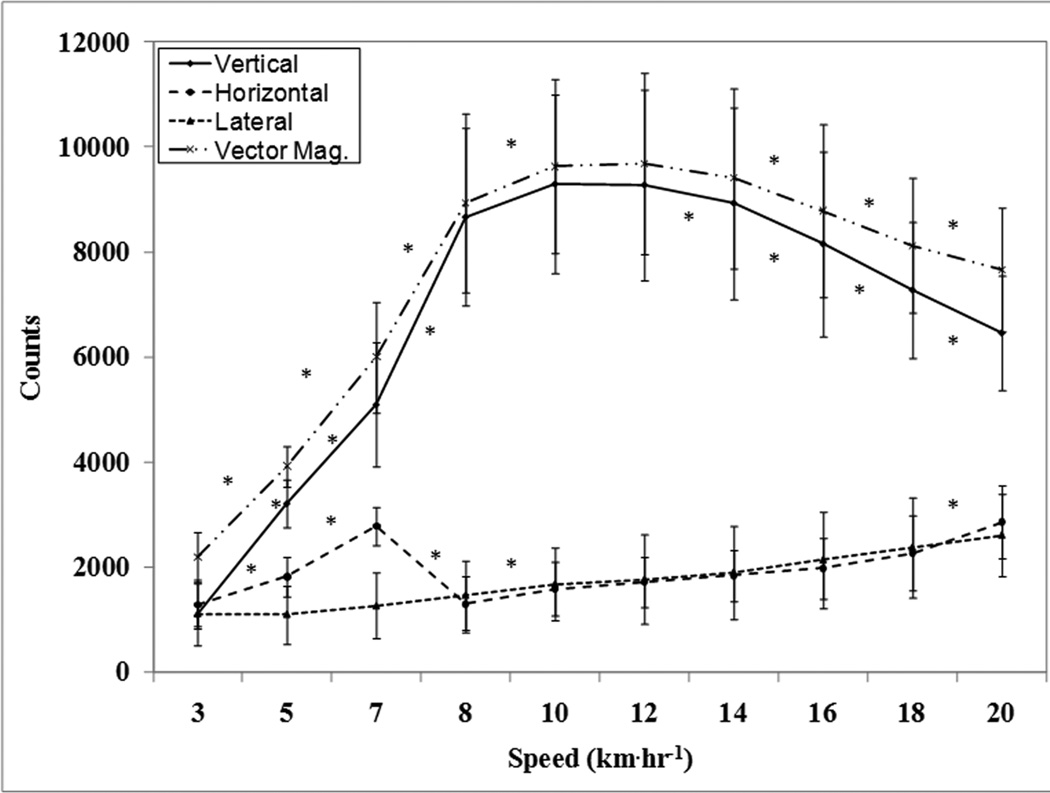
Mean GT3X activity counts in the vertical, antero-posterior, lateral axes and tri-axial VM are illustrated in Figure 3. As report previously (10, 19), vertical activity counts increased linearly with increasing speeds between 3 and 10 km˙hr−1 and then decreased curvilinearly up to the maximum running speed. Antero-posterior activity counts increased significantly during walking at increasing spreads (p<0.05). Similar to FTH, a significant decrease in activity counts (2787 ± 369 to 1304 ± 526 counts min−1 p<0.05) was observed during the walk-run transition (between 7 and 8 km˙hr−1). Mean lateral activity counts were low. With increasing speed, GT3X VM activity counts demonstrated a pattern very similar to vertical activity counts.
Figure 3.
Mean (SD) of activity counts from the ActiGraph GT3X in the vertical, antero-posterior, and lateral axes and their composite VM. * indicates significant differences between consecutive speeds.
3.4. Frequency Analyses
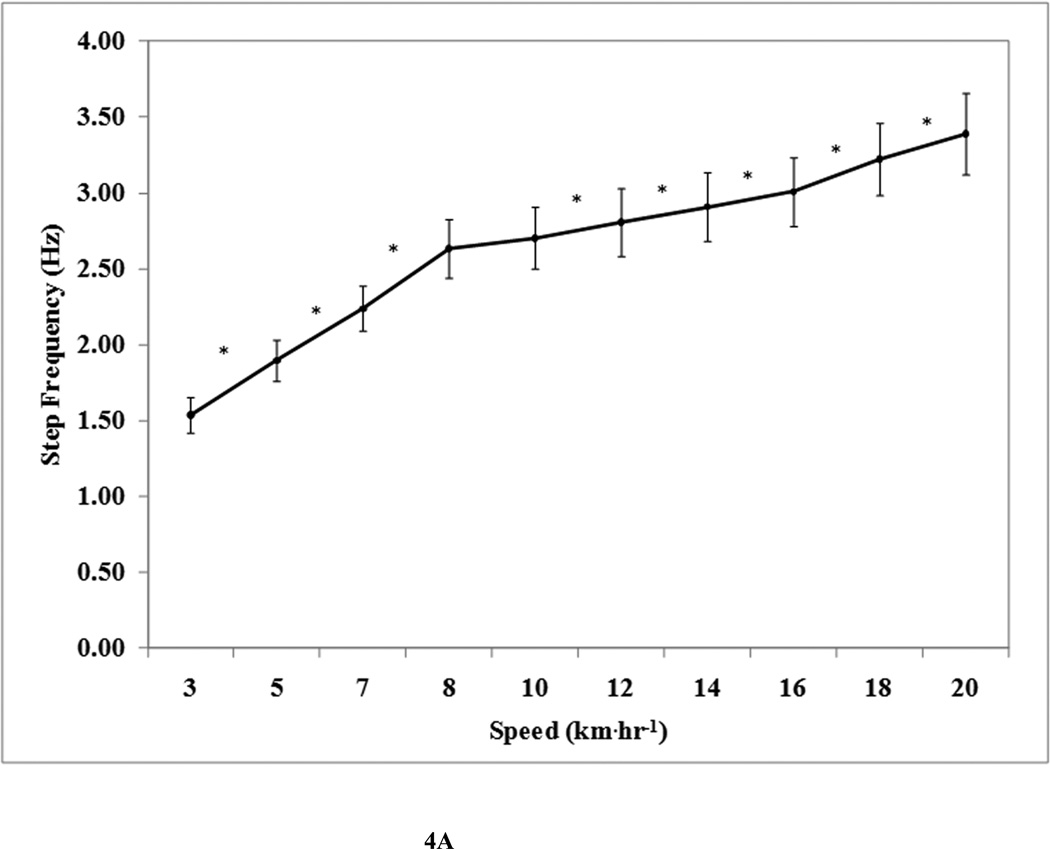
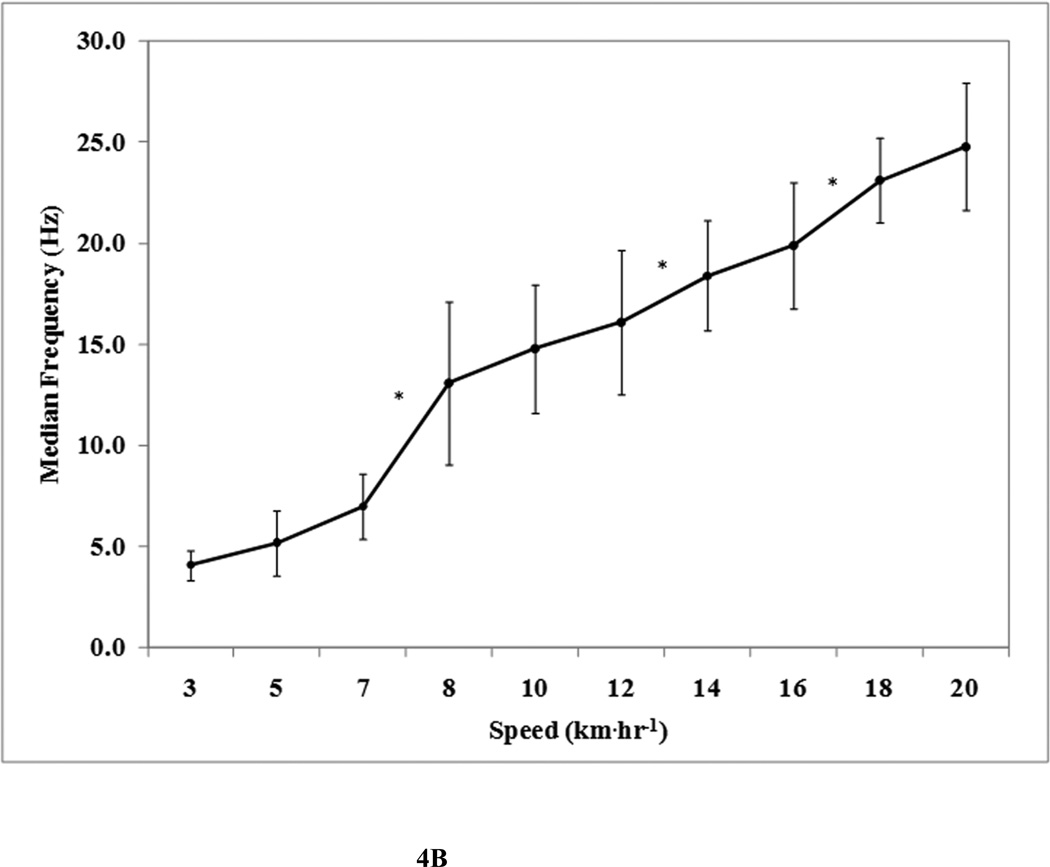
Step frequency increased linearly with increasing speed (Figure 4A). Average step frequency between the lowest and highest speed ranged from 1.54 ± 0.12 Hz to 3.39 ± 0.27 Hz. A significant increase in step frequency between 8 and 10 km˙hr−1. The median frequency of the FTV signal increased with locomotion speed (Figure 4B). Significant increases between consecutive speeds were detected between 7 and 8 km˙hr−1, 12 and 14 km˙hr−1, and 16 and 18 km˙hr−1 (p<0.05). Median frequency values ranged from 4.1 ± 0.7 Hz to 24.8 ± 3.2 Hz. between the slowest and fastest speeds
Figure 4.
(A). Mean (SD) of step frequency. * indicates significant differences between consecutive speeds. (B) Mean of the median frequency (SD) of the FTV signal. * indicates significant differences between consecutive speeds.
4. Discussion
Our study showed that the plateau/inverted-U phenomenon is not due to constant CoM vertical accelerations. Even though vertical and antero-posterior accelerations increase until running speeds of at least 16 km hr−1, the ActiGraph GT3X does not produce VM activity counts that can distinguish increasing exercise intensity during running at higher speeds. This study demonstrated that the plateau/inverted-U phenomenon is primarily attributable to ActiGraph’s band-pass filtering characteristics.
4.1. Acceleration and Activity Counts
4.1.1 Individual Axes
The plateau/inverted-U phenomenon in vertical activity counts began at approximately 10 km˙hr− 1. However, FTV continued to increase curvilinearly up to 20 km˙hr−1. FTV at 20 km˙hr−1 was greater than that at 10 km˙hr−1 by approximately 27%. In contrast, vertical activity counts at 20 km˙hr−1 were 30% lower than those at 10 km˙hr−1. These findings support our hypothesis that vertical accelerations increase beyond the speed when vertical activity counts begin to level-off. Contrary to as proposed previously (Brage et al., 2003), the plateau/inverted-U phenomenon is not due to a similar leveling-off of vertical acceleration at higher running speeds. FTV measured during running in the current study are similar to previous reports, where FTV ranged between 1.4 g (10.7 km˙hr−1) and 1.9 g (21.6 km˙hr−1) (Keller et al., 1996, Munro et al., 1987, Nilsson and Thorstensson, 1989).
The antero-posterior FTH detected in this study are similar to previous findings (Nilsson and Thorstensson, 1989, Munro et al., 1987). FTH and activity counts decreased during the walk-to-run transition (FTH by 25%; activity counts by 53%). This concurrent decrease in both variables may be due to differences in movement patterns between walking and running (Nilsson et al., 1985, Nilsson and Thorstensson, 1989), including the double support phase, a lower stride frequency, and a larger distance between the foot and the torso during foot-falls when walking as compared to running (Nilsson et al., 1985).
4.1.2. VM Comparison
FTVM and VM activity count patterns were similar to those observed in the vertical axis. These findings support our hypothesis that ActiGraph VM activity counts would demonstrate the plateau/inverted-U phenomenon. VM activity counts at 8 km˙hr−1 (8927 ± 1702 counts˙min−1) were higher than those at 18 km˙hr−1 (8122 ± 1283 counts˙min−1). Therefore, the composite VM activity counts from vertical and horizontal accelerations detected by the GT3X do not yield output that allow distinctions among exercise intensities during running at higher running speeds. The leveling-off of VM activity counts is primarily attributable to the peaking and subsequent decline in vertical activity counts. Since vertical activity counts are typically two to six times higher than those in the remaining two axes, the mathematical computation of VM (VM= √ [(vertical counts)2 + (antero-posterior counts)2 + (lateral counts)2]) is largely dominated by a contribution from vertical activity counts. The increases in antero-posterior and lateral counts are not large enough to offset the progressive decline in vertical counts during running above 10 km˙hr−1.
4.1.3. Frequency Content and GT3X Filtering Characteristics
During running, the GT3X activity monitor detects changing dynamic accelerations. These acceleration signals undergo frequency filtering before conversion to activity counts. The analog signal detected by the GT3X (and its predecessors) acceleration sensor is first low pass-filtered to eliminate higher frequencies and reduce distortion (‘aliasing’) when reconstructing the digital signal (personal communication with Jeff Miller, VP Engineering, ActiGraph, March 2011). The low-pass filter cut-off frequency is proprietary information. The filtered analog signals are sampled by a 12-bit analog-to-digital convertor at a rate of 30 Hz. The reconstructed digitized signal is then subject to band-pass filtering between 0.25 and 2.5 Hz. These limits are based on the premise that acceleration frequencies arising from most human activities fall in this range. However, Antonsson and Mann (Antonsson and Mann, 1985) demonstrated that the frequency content of walking ranges as high as 15 Hz. Further, our data illustrate that when running at speeds over 10 km˙hr−1, the median frequency of FTV signals ranged between 14.8 and 24.8 Hz, and step frequencies ranged from 2.7 to 3.4 Hz. These higher frequency signals are eliminated either during low-pass analog filtering or by the digital band-pass filter of the GT3X. These eliminated higher frequencies may be necessary to detect intensity differences at higher running speeds.
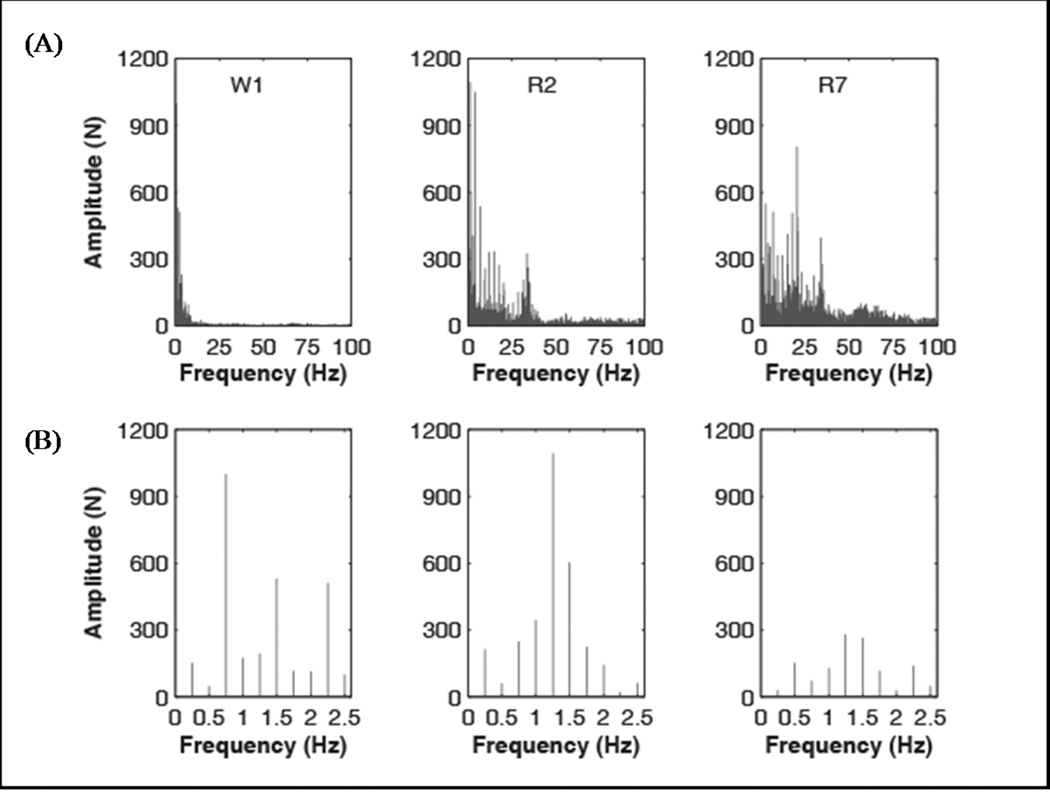
Vertical activity counts peaked during running at approximately 10 to 12 km˙hr−1. In comparison to other ambulatory speeds, the frequency content of acceleration signals between 0.25 and 2.5 Hz (the GT3X band-pass filter limits) is highest at 10 to 12 km˙hr−1. This is illustrated in Figure 5 (A and B) depicting the frequency distribution of the FTV acceleration signals for one subject while walking at 3 km˙hr−1 (W1), and running at 10 (R2) and 20 km˙hr−1 (R7). Overall, the frequency content shifts towards higher frequencies with increasing ambulatory speed (Figure 5A). However, frequency content within the ActiGraph band-pass filter limits (0.25 to 2.5 Hz) has a different pattern (Figure 5B). With increasing speed there is a shift in the amplitude of these low frequency components, particularly between R2 and R7. At R2, the dominant amplitudes lie between 0.75 to 1.5 Hz, but these amplitudes are greatly reduced at R7. From Figure 5A, it is clear that the dominant signal frequencies lie well beyond 2.5 Hz at this higher running speed. The rightward shift to higher frequencies causes most of the higher amplitude components to fall outside the band-pass limits of the ActiGraph GT3X. A previous study using a uniaxial ActiGraph monitor reported that activity counts peak between 0.5 to 1.5 Hz. during controlled mechanical testing (Tryon and Williams, 1996). Figure 5B demonstrates that the frequency content of accelerations when activity counts peak during running at R2 lie between 0.50 to 1.5 Hz.
Figure 5.
(A) Frequency content of the FTV acceleration signal during walking at 3 km˙hr−1 (W1) and running at 10 (R2) and 20 km˙hr−1 (R7) for one subject. (B) Frequency content of the FTV acceleration signal during walking at 3 km˙hr−1 and running at 10 and 20 km˙hr−1 within the GT3X band-pass filter limits of 0.25 and 2.5 Hz for the same subject from 5A.
In summary, although there was an increase in measured FTV and FTH during running at increasing speeds, the rightward shift of the frequency content curve and the filtering characteristics of the GT3X result in the ‘plateau/inverted-U phenomenon’. In this study, both step frequency and the CoM acceleration frequency increased with increasing ambulatory speed. These two variables represent fundamentally distinct aspects of the locomotion system and highlight an important finding related to the measurement of PA using accelerometer-based monitors. Activity counts from a monitor will only represent a performed PA if the true acceleration signal’s dominant frequencies lie within the measurement realm of the monitor. The ActiGraph band-pass filter seems to have been designed with ambulation and step frequency in mind because walking humans rarely exceed a step frequency of 2.5 Hz. However, the acceleration signal's frequency content is more relevant than the locomotion system's step frequency to distinguish among various physical activities performed by humans and to accurately measure the body’s acceleration behavior. Step frequency represents the cycle rate of the system, and is only equivalent to the CoM acceleration’s dominant frequencies when the CoM motion is purely sinusoidal. Comparing the mean step frequency range (2.7 to 3.4 Hz; Figure 4A) to the FTV acceleration median frequency range (14.8 and 24.8 Hz; Figure 4B) clearly demonstrates distinct differences between these variables even during a rhythmic activity like human ambulation. To obtain a complete and accurate measurement of activity behavior, it is necessary that accelerometer-based activity monitors are not limited to detecting only stepping frequency, but are designed to capture the dominant frequencies within human body acceleration signals.
4.1.4. Impact of Findings
The ActiGraph activity monitor is primarily used by researchers to quantify daily PA and energy expenditure in various populations. The linear relationship between activity intensity and activity counts breaks down during moderate-to-vigorous ambulation. This problem may not impact the measurement of PA in the general adult population because only a small segment participates in moderate-to-vigorous activity (Troiano et al., 2008). However, the plateau/inverted-U phenomenon will underestimate high intensity activities such as running and competitive sports (Leek et al., 2010). Another area of concern is the measurement of physical activity in children. Children typically perform rapid movement in short bursts that may not be entirely captured by the GT3X due to the plateau/inverted-U phenomenon and result in underestimates of PA. Researchers are now developing advanced machine learning techniques to obtain comprehensive information on physical activity including activity type and intensity from ActiGraph activity counts (Staudenmayer et al., 2009, Freedson et al., 2011). However, the monitor’s current filtering characteristics will reduce the accuracy of these techniques in detecting physical activity variables (especially activity type) for the entire range of human movement. ActiGraph should conduct experimental studies to determine a new band-pass filter for the GT3X monitor that detects higher intensity activities. ActiGraph should then modify their software and on-board monitor firmware to allow researchers to choose from either the current or the new band-pass filter during monitor initialization.
Conclusions
Previous researchers have suggested that accelerometer-based PA monitors should be able to measure accelerations with frequencies up to 20 Hz (Bouten et al., 1997). Our data provide experiential evidence to support these recommendations. Other commercially available activity monitors with wider filtering limits do not demonstrate the plateau/inverted-U phenomenon. For example, the 3dNX and Actiheart monitors detect acceleration frequencies up to 10 and 7 Hz, respectively. Outputs from these monitors do not plateau until running speeds between 16 and 20 km˙hr−1 (Fudge et al., 2007). We recommend that activity monitors utilize filtering limits that enable distinction among varying exercise intensities or running speeds and that are based on information obtained from mechanical and human testing.
Several new-generation monitors collect ‘raw-data’ sampled at higher frequencies and are not subject to manufacturer-defined signal processing parameters. We anticipate the acquisition of raw data becoming more prevalent in future activity monitors and signal processing will most likely be performed off-line by the researcher rather than in real-time by the device. End-users will consequently need to be familiar with these issues for acquiring and processing raw acceleration signals.
Acknowledgements
We would like to thank Kishore Kotteri (Electrical Engineer, Microsoft Corp.) for sharing his expertise on Digital Signal Processing and graduate students Jeffer Sasaki and Amanda Libertine (University of Massachusetts) for helping with data collection. This study did not receive any support from external funding sources.
References
- Alexander RM, Jayes AS. Fourier analysis of forces exerted in walking and running. J Biomech. 1980;13:383–390. doi: 10.1016/0021-9290(80)90019-6. [DOI] [PubMed] [Google Scholar]
- Antonsson EK, Mann RW. The frequency content of gait. J Biomech. 1985;18:39–47. doi: 10.1016/0021-9290(85)90043-0. [DOI] [PubMed] [Google Scholar]
- Bouten CV, Koekkoek KT, Verduin M, Kodde R, Janssen JD. A triaxial accelerometer and portable data processing unit for the assessment of daily physical activity. IEEE Trans Biomed Eng. 1997;44:136–147. doi: 10.1109/10.554760. [DOI] [PubMed] [Google Scholar]
- Brage S, Wedderkopp N, Franks PW, Andersen LB, Froberg K. Reexamination of validity and reliability of the CSA monitor in walking and running. Med Sci Sports Exerc. 2003;35:1447–1454. doi: 10.1249/01.MSS.0000079078.62035.EC. [DOI] [PubMed] [Google Scholar]
- Breniere Y, Bril B. Development of postural control of gravity forces in children during the first 5 years of walking. Exp Brain Res. 1998;121:255–262. doi: 10.1007/s002210050458. [DOI] [PubMed] [Google Scholar]
- Cavagna GA, Thys H, Zamboni A. The sources of external work in level walking and running. J Physiol. 1976;262:639–657. doi: 10.1113/jphysiol.1976.sp011613. [DOI] [PMC free article] [PubMed] [Google Scholar]
- Chang YH, Kram R. Metabolic cost of generating horizontal forces during human running. J Appl Physiol. 1999;86:1657–1662. doi: 10.1152/jappl.1999.86.5.1657. [DOI] [PubMed] [Google Scholar]
- Freedson PS, Lyden K, Kozey-Keadle S, Staudenmayer J. Evaluation of artificial neural network algorithms for predicting METs and activity type from accelerometer data: Validation on an independent sample. J Appl Physiol. 2011 doi: 10.1152/japplphysiol.00309.2011. [DOI] [PMC free article] [PubMed] [Google Scholar]
- Fudge BW, Wilson J, Easton C, Irwin L, Clark J, Haddow O, Kayser B, Pitsiladis YP. Estimation of oxygen uptake during fast running using accelerometry and heart rate. Med Sci Sports Exerc. 2007;39:192–198. doi: 10.1249/01.mss.0000235884.71487.21. [DOI] [PubMed] [Google Scholar]
- Hoch AZ, Papanek P, Szabo A, Widlansky ME, Schimke JE, Gutterman DD. Association Between the Female Athlete Triad and Endothelial Dysfunction in Dancers. Clinical Journal of Sport Medicine. 2011;21:119. doi: 10.1097/JSM.0b013e3182042a9a. [DOI] [PMC free article] [PubMed] [Google Scholar]
- John D, Tyo B, Bassett DR. Comparison of four ActiGraph accelerometers during walking and running. Med Sci Sports Exerc. 2010;42:368–374. doi: 10.1249/MSS.0b013e3181b3af49. [DOI] [PMC free article] [PubMed] [Google Scholar]
- Keller TS, Weisberger AM, Ray JL, Hasan SS, Shiavi RG, Spengler DM. Relationship between vertical ground reaction force and speed during walking, slow jogging, and running. Clin Biomech (Bristol, Avon) 1996;11:253–259. doi: 10.1016/0268-0033(95)00068-2. [DOI] [PubMed] [Google Scholar]
- Kozey SL, Staudenmayer JW, Troiano RP, Freedson PS. Comparison of the ActiGraph 7164 and the ActiGraph GT1M during self-paced locomotion. Med Sci Sports Exerc. 2010;42:971–976. doi: 10.1249/MSS.0b013e3181c29e90. [DOI] [PMC free article] [PubMed] [Google Scholar]
- Leek D, Carlson JA, Cain KL, Henrichon S, Rosenberg D, Patrick K, Sallis JF. Physical activity during youth sports practices. Archives of Pediatrics and Adolescent Medicine. 2010 doi: 10.1001/archpediatrics.2010.252. archpediatrics. 2010.252 v1. [DOI] [PubMed] [Google Scholar]
- Luhtanen P, Komi P. Mechanical factors influencing running speed. University Park Press; 1978. p. 23. [Google Scholar]
- Mullineaux DR, Milner CE, Davis IS, Hamill J. Normalization of ground reaction forces. Journal of applied biomechanics. 2006;22:230–233. doi: 10.1123/jab.22.3.230. [DOI] [PubMed] [Google Scholar]
- Munro CF, Miller DI, Fuglevand AJ. Ground reaction forces in running: a reexamination. J Biomech. 1987;20:147–155. doi: 10.1016/0021-9290(87)90306-x. [DOI] [PubMed] [Google Scholar]
- Nilsson J, Thorstensson A. Ground reaction forces at different speeds of human walking and running. Acta Physiol Scand. 1989;136:217–227. doi: 10.1111/j.1748-1716.1989.tb08655.x. [DOI] [PubMed] [Google Scholar]
- Nilsson J, Thorstensson A, Halbertsma J. Changes in leg movements and muscle activity with speed of locomotion and mode of progression in humans. Acta Physiol Scand. 1985;123:457–475. doi: 10.1111/j.1748-1716.1985.tb07612.x. [DOI] [PubMed] [Google Scholar]
- Rothney MP, Apker GA, Song Y, Chen KY. Comparing the performance of three generations of ActiGraph accelerometers. J Appl Physiol. 2008;105:1091–1097. doi: 10.1152/japplphysiol.90641.2008. [DOI] [PMC free article] [PubMed] [Google Scholar]
- Rowlands AV, Stone MR, Eston RG. Influence of speed and step frequency during walking and running on motion sensor output. Med Sci Sports Exerc. 2007;39:716–727. doi: 10.1249/mss.0b013e318031126c. [DOI] [PubMed] [Google Scholar]
- Staudenmayer J, Pober D, Crouter S, Bassett D, Freedson P. An artificial neural network to estimate physical activity energy expenditure and identify physical activity type from an accelerometer. J Appl Physiol. 2009;107:1300–1307. doi: 10.1152/japplphysiol.00465.2009. [DOI] [PMC free article] [PubMed] [Google Scholar]
- Troiano RP, Berrigan D, Dodd KW, Masse LC, Tilert T, Mcdowell M. Physical activity in the United States measured by accelerometer. Med Sci Sports Exerc. 2008;40:181–188. doi: 10.1249/mss.0b013e31815a51b3. [DOI] [PubMed] [Google Scholar]
- Tryon WW, Williams R. Fully proportional actigraphy: a new instrument. Behavior Research Methods. 1996;28:392–403. [Google Scholar]


