

Abstract
Disrupted-In-Schizophrenia 1 (DISC1) was identified as a risk factor for psychiatric illness through its disruption by a balanced chromosomal translocation, t(1;11)(q42.1;q14.3), that co-segregates with schizophrenia, bipolar disorder and depression. We previously reported that the translocation reduces DISC1 expression, consistent with a haploinsufficiency disease model. Here we report that, in lymphoblastoid cell lines, the translocation additionally results in the production of abnormal transcripts due to the fusion of DISC1 with a disrupted gene on chromosome 11 (DISC1FP1/Boymaw). These chimeric transcripts encode abnormal proteins, designated CP1, CP60 and CP69, consisting of DISC1 amino acids 1–597 plus 1, 60 or 69 amino acids, respectively. The novel 69 amino acids in CP69 induce increased α-helical content and formation of large stable protein assemblies. The same is predicted for CP60. Both CP60 and CP69 exhibit profoundly altered functional properties within cell lines and neurons. Both are predominantly targeted to mitochondria, where they induce clustering and loss of membrane potential, indicative of severe mitochondrial dysfunction. There is currently no access to neural material from translocation carriers to confirm these findings, but there is no reason to suppose that these chimeric transcripts will not also be expressed in the brain. There is thus potential for the production of abnormal chimeric proteins in the brains of translocation carriers, although at substantially lower levels than for native DISC1. The mechanism by which inheritance of the translocation increases risk of psychiatric illness may therefore involve both DISC1 haploinsufficiency and mitochondrial deficiency due to the effects of abnormal chimeric protein expression.
GenBank accession numbers: DISC1FP1 (EU302123), Boymaw (GU134617), der 11 chimeric transcript DISC1FP1 exon 2 to DISC1 exon 9 (JQ650115), der 1 chimeric transcript DISC1 exon 4 to DISC1FP1 exon 4 (JQ650116), der 1 chimeric transcript DISC1 exon 6 to DISC1FP1 exon 3a (JQ650117).
INTRODUCTION
We identified Disrupted-In-Schizophrenia 1 (DISC1) as a genetic risk factor for major mental illness, through study of a large Scottish family multiply affected with schizophrenia, bipolar disorder and major depressive disorder, that results from inheritance of a balanced t(1;11)(q42.1;q14.3) chromosomal translocation (1). On chromosome 1, the t(1;11) translocation directly disrupts DISC1 and its non-coding antisense partner DISC2 (2). Perturbed expression of one or both genes is therefore likely to be directly involved in disease pathogenesis. Independent genetic linkage and association data support the involvement of the DISC locus in schizophrenia, schizoaffective disorder, bipolar disorder, recurrent major depression, and most recently autism spectrum disorders, in multiple populations (3,4).
DISC1 is a scaffold protein now known to be essential for many critical brain processes, including regulation of neural precursor proliferation and differentiation (5), migration of newborn neurons within the developing cortex (6) and adult hippocampus (7), integration of newborn neurons into the existing neural circuitry (7), modulation of dendritic spines (8) and synapse formation/composition (7,9). If dysregulated by the t(1;11) translocation through the disruption of DISC1, it is conceivable that any or all of these processes could contribute to abnormal brain development and function, thereby triggering psychiatric illness.
Although we have previously provided evidence for haploinsufficiency as the disease mechanism in translocation carriers (10), we now provide evidence for an additional level of complexity. The translocation fuses DISC1 to a gene on chromosome 11, DISC1 Fusion Partner 1 (DISC1FP1), also known as Boymaw (11), resulting in the production of various aberrant chimeric transcripts with novel protein-coding potential. The proteins encoded by these transcripts consist of C-terminally truncated DISC1—in some instances fused to 1, 60 or 69 novel amino acids encoded by the DISC1FP1 sequence. The 60 and 69 additional amino acids increase the α-helical content of DISC1 in vitro, resulting in the formation of abnormally large protein assemblies that exhibit increased thermal stability. When exogenously expressed, these abnormal chimeric proteins are predominantly targeted to mitochondria, where they induce abnormal morphology and abolish mitochondrial membrane potential. Overall, our data suggest that dysregulated mitochondrial function in proliferating cells and neurons may contribute to disease pathogenesis in translocation carriers.
RESULTS
Abnormal chimeric DISC1 transcripts result from the t(1;11) translocation
A gene referred to as Boymaw has previously been noted as spanning the chromosome 11 translocation breakpoint in the t(1:11) family (11). Analysis of expressed sequence tags (ESTs) indicates that transcripts produced from this gene (Fig. 1A) are alternatively spliced, utilizing multiple alternative exons and, in exon 5, alternative splice donor sites (Fig. 1B). This gene possesses no significant open reading frames (ORFs) and is therefore most likely a non-coding RNA gene.
Figure 1.

Schematic of DISC1FP1 (not to scale). (A) DISC1FP1 genomic structure showing all known exons (numbered according to 11 and 34). Arrow indicates alternatively spliced exon 5. (B) ESTs from DISC1FP1. Asterisks mark positions of translation stop codons predicted to be utilized in chimeric transcripts arising from the der 1 chromosome. CK000409 and BU599486 encode CP60 and CP69, respectively, both terminating within exon 6. AB371558 encodes CP1, which terminates within exon 3a.
DISC1 and the chromosome 11 gene are oriented such that the translocation causes gene fusion. Consequently, in lymphoblastoid cell lines, the derived 1 and 11 chromosomes (der 1 and der 11) may give rise to chimeric transcripts consisting of DISC1 exons 1–8 fused to breakpoint distal exons of the chromosome 11 gene, or to breakpoint proximal exons of the chromosome 11 gene fused with DISC1 exons 9–13, respectively (11).
Analysis of chimeric transcript expression using lymphoblastoid cell lines derived from t(1;11) translocation carriers demonstrated that such transcripts are indeed produced (Fig. 2A). Thus, the disrupted gene on chromosome 11 has been officially named DISC1 Fusion Partner 1 (DISC1FP1) (12) to reflect this biological mechanism, although it has also been referred to using the AceView (13) name Boymaw (11). Reverse transcription PCR (RT-PCR) analysis using primer pairs designed to amplify chimeric transcripts from both the der 1 and der 11 chromosomes combined with sequencing detected the fusion of DISC1 exon 9 to DISC1FP1 exon 3a or exon 4, as well as the fusion of DISC1FP1 exon 2 to DISC1 exon 8 in cell lines carrying the translocation (Fig. 2A).
Figure 2.

Chimeric transcript expression in t(1;11) family-derived lymphoblastoid cell lines. (A) RT-PCR detects chimeric transcripts in translocation cell lines. (Left) Schema of the fused genes on each derived chromosome. Black and grey boxes represent DISC1 and DISCFP1 exons, respectively. Arrows denote primers used in this analysis. (Middle) Amplified PCR products. −VE, N and T represent negative controls, normal karyotype cell lines and translocation cell lines, respectively. The DISC1FP1 exon 2-DISC1 exon 9 primer pair generated two products corresponding to the inclusion/exclusion of the alternatively spliced DISC1FP1 exon 3. Data from the DISC1 exon 7-DISC1FP1 exon 3a primer pair are shown as three lanes spliced together from a single gel. (Right) RT-PCR products were sequenced to confirm chimeric transcript amplification. (B) Real-time PCR quantification of DISC1 expression levels. Each dot represents a single cell line. Open, black and grey circles represent no diagnosis, schizophrenia and recurrent major depression, respectively. Horizontal lines represent the mean of each group. Statistical significance was determined independently for each primer pair using a two-tailed t-test to compare the group mean expression levels.
Breakpoint proximal, but not distal, DISC1 transcript levels are reduced by the t(1;11) translocation
We have previously demonstrated that DISC1 transcription occurs from the disrupted DISC1 allele on chromosome 1, and that DISC1 transcript levels, quantified using PCR primers specific for exon 2, are reduced (10). In this extended study, we used SYBR green real-time PCR to quantify DISC1 expression in lymphoblastoid cell lines derived from t(1;11) family members, utilizing primer pairs designed proximal to the translocation breakpoint, either within exon 2 or spanning exons 4–6 (detecting wild-type DISC1 transcripts plus transcripts produced from the der 1 chromosome), or distal to the translocation breakpoint, within exon 9 (detecting wild-type DISC1 transcripts plus transcripts produced from the der 11 chromosome).
We confirmed the reduction in DISC1 transcript expression levels using primer pairs proximal to the t(1;11) breakpoint (Fig. 2B, P < 0.05 for exon 2 primers, P < 0.01 for exon 4–6 primers). In contrast, the exon 9 primers did not detect a decrease in DISC1 expression in translocation carriers compared with normal karyotype controls (Fig. 2B). Altogether, assuming that DISC1 expression from the non-disrupted allele is unaltered by the translocation, these quantitative data demonstrate that chimeric transcripts produced from the der 1, but not the der 11, chromosome are scarce. The der 1 chimeric transcripts are predicted to have splice junctions downstream of the translation stop codon (Fig. 1B), a feature of aberrant transcripts that marks them for nonsense-mediated mRNA decay (14). These transcripts may therefore be targeted and degraded by this cellular surveillance mechanism and depleted from the cell. In contrast, there are no obvious stability issues for chimeric transcripts from the der 11 chromosome. This interpretation is complicated by the theoretical possibility that the exon 9 primer pair also detects DISC2 transcripts, which overlap DISC1 exon 9, although DISC2 is expressed at unquantifiably low levels in lymphoblastoid cell lines (data not shown).
The translocation-carrying cell lines used in this analysis were derived from one unaffected carrier, and one and four carriers diagnosed with schizophrenia or severe recurrent depression, respectively. Although the sample numbers are low, it is worth pointing out that the quantitative measures gave no indication of a relationship between DISC1 transcript levels and diagnosis.
Predicted abnormal DISC1 protein species encoded by the chimeric transcripts
Transcripts fusing DISC1 exons 1–8 with DISC1FP1 exons 4-end encode abnormal proteins consisting of DISC1 amino acids 1–597 fused at the C-terminus to novel amino acids encoded by DISC1FP1. Alternative splicing of DISC1FP1 exon 5 induces a frameshift, resulting in the addition of 60 or 69 novel amino acids (Table 1). These proteins will be referred to as Chimeric Protein 60 and 69 (CP60 and CP69). Transcripts fusing DISC1 exons 1–8 with DISC1FP1 exon 3a encode DISC1 amino acids 1–597, plus a single glycine derived from the DISC1FP1 sequence (Table 1). This protein will be referred to as CP1. Since there is normally a glycine at position 598 in DISC1, CP1 essentially corresponds to DISC1 amino acids 1–598.
Table 1.
Abnormal DISC1 protein species encoded by transcripts produced from the der 1 chromosome
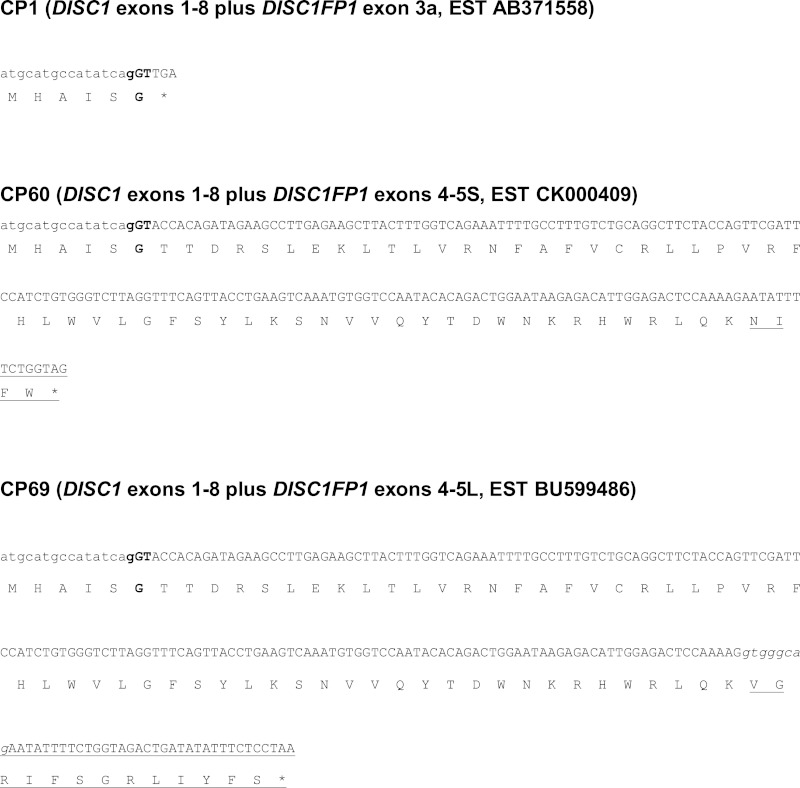 |
Nucleotide sequences are shown above, and the corresponding translated amino acid sequence below. Der 1-derived chimeric transcripts are predicted to contain DISC1 exons 1–8, encoding amino acids 1–597, but for simplicity only amino acids 593–597 are shown. DISC1-derived nucleotides are in lower case, the codon and amino acid (glycine) at the junction are in bold type, lower case italics denote the alternatively spliced region at the 3′ end of DISC1FP1 exon 5 (the short and long forms of the exon are designated 5S and 5L, respectively) and underlining marks the alternative amino acids within CP60 and CP69.
Chimeric transcripts produced from the der 11 chromosome contain an internal ORF corresponding to amino acids 669–854 of the DISC1 C-terminus. This ORF is unlikely to be translated because DISC1FP1 is apparently non-coding; therefore, the sequence upstream of the DISC1 ORF is unlikely to provide the signals necessary for translation initiation.
Fusion protein 69 exhibits altered structure and thermal stability
We speculated that the addition of 60 or 69 novel amino acids would alter the properties of the N-terminal DISC1 fragment encoded by the chimeric transcripts. We selected DISC1 amino acids 326–597 for analysis, fused to maltose-binding protein (MBP) tags, based upon considerations of domain delineation, predicted protein disorder in the N-terminus of native DISC1 and likely consequences for protein expression, purification, and finally on the assessment of secondary structure for the C-terminus of native DISC1 (15). This DISC1 region was expressed both by itself (MBP-ΔN597) or fused to the novel 69 amino acids of CP69 (MBP-ΔNCP69, Fig. 3A), selected because it is the longest of the chimeric proteins. Following purification from Escherichia coli, each product was detectable as two major species (75 and 150 kDa for MBP-ΔN597 and 80 and 160 kDa for MBP-ΔNCP69) on an SDS–PAGE gel (Fig. 3B and C). The molecular weights of these species correspond to the predicted molecular weights of the protein monomers and SDS-resistant dimers (respectively, 76.8 and 153.6 kDa for MBP-ΔN597, and 85.1 and 170.2 kDa for MBP-ΔNCP69). The identities of these species were confirmed by mass spectrometry (Supplementary Material, Figs S1 and S2).
Figure 3.

Biophysical characterization of CP69. (A) Schematic of the recombinant proteins MBP-ΔN597 and MBP-ΔNCP69, drawn to scale. (B) Following amylose affinity purification, size exclusion chromatography separates the recombinant protein (∼140 ml peak) from co-purifying contaminants (later peaks); CV: 320 ml. (C) SDS–PAGE purification gel of MBP-ΔN597 and MBP-ΔNCP69 proteins. AAP, amylose affinity purification; SEC, size exclusion chromatography. Arrows indicate monomers and dimers. (D) Mean hydrodynamic diameters of three independent protein preparations for each of MBP-ΔN597 and MBP-ΔNCP69 determined by DLS. (E) Mean melting temperatures of three independent protein preparations for each of MBP-ΔN597 and MBP-ΔNCP69 determined by DLS at increasing temperatures. (F) CD spectra of MBP-ΔN597 (0.12 mg/ml) and MBP-ΔNCP69 (0.11 mg/ml) in the far-UV range is shown, with mean residue ellipticity and wavelength (measured from 280 to 185 nm) plotted along the y-axis and x-axis, respectively. (G) Deconvolution of the CD spectra using different algorithms and data sets.
Measurement of native purified protein size (hydrodynamic diameter) using dynamic light scattering (DLS) revealed that MBP-ΔNCP69 forms larger species compared with MBP-ΔN597, although this fell just short of statistical significance (P = 0.056, Fig. 3D). In support of this, the initial size exclusion chromatography also suggests that the MBP-ΔNCP69 assembly has a larger hydrodynamic diameter (Fig. 3B). The thermal stability of each protein was then assessed by taking DLS readings at steadily increasing temperatures and measuring the point at which changes in protein structure occur. MBP-ΔNCP69 exhibits a consistently higher melting point than MBP-ΔN597 (P = 0.003, Fig. 3E). Altogether, the increased size and higher melting point of MBP-ΔNCP69 suggest that the addition of 69 novel amino acids induces the formation of larger structures with increased stability.
Far-UV circular dichroism (CD) spectra were then recorded to estimate the secondary structure content. Both MBP-ΔN597 and MBP-ΔNCP69 exhibit a pronounced double-negative minimum at ∼208 and ∼222 nm and one positive peak at ∼193 nm in the far-UV range (Fig. 3F), a characteristic of folded proteins with a high α-helical content (16). However, MBP-ΔNCP69 displays significantly more pronounced negative and positive ellipticity centred in these regions, when compared with MBP-ΔN597, implying a greater propensity towards α-helices and indicating that secondary structure variation exists as a result of the novel 69 amino acids. Indeed, upon spectral deconvolution using three combinations of algorithms and reference sets (17–21), the MBP-ΔNCP69 structure is estimated to possess ∼1.4–1.8 times greater α-helical content and lower β-strand composition compared with MBP-ΔN597 (Fig. 3G).
Analysis of the novel 60 and 69 DISC1FP1 residues shows a strong disagreement between three secondary structure prediction programs (22–24) (Fig. 4); PsiPred predicts several low-confidence β-strands for this region, whereas JPred3 and Porter predict an abundance of α-helices. The CD spectroscopy results revealing elevated α-helical content in MBP-ΔNCP69 are in agreement with the latter predictions. PCoils/Coils (25,26) did not predict any coiled-coil motifs. Although the presence of the MBP tag precludes direct comparison with other CD studies that investigated the C-terminal region of DISC1 (27), altogether these data imply an overall mixed α/β fold for this region.
Figure 4.

Secondary structure predictions for the DISC1FP1-derived amino acids of CP60 and CP69, using three prediction programs: PsiPred3, JPred3 and Porter.
Thus, it appears that the addition of 69 amino acids from DISC1FP1 introduces clear differences in secondary structure compared with the control truncated DISC1 protein, resulting in the formation of larger, more stable protein assemblies.
CP60 and CP69 are mitochondrial proteins that induce mitochondrial dysfunction
DISC1 has been detected at multiple subcellular locations, including the centrosome (28), nucleus (29), mitochondria (30), Golgi (31) and synapse (32). C-terminally truncated DISC1 (amino acids 1–597) instead adopts a predominantly diffuse cytoplasmic distribution (Fig. 5A) (6). In COS7 cells, FLAG-tagged CP1 also adopts a diffuse cytoplasmic distribution (Fig. 5A), confirming that these two proteins most likely have highly similar properties.
Figure 5.

Exogenous chimeric protein expression in COS7 cells and cultured CD1 mouse primary neurons. (A) Immunofluorescence detection of FLAG-tagged DISC1 (green), mitochondria (MitoTracker Red CMXRos) and cytochrome c (pink) in COS7 cells. Asterisks indicate cells transfected with CP60 or CP69, marking cells with low-, medium- or high-level expression. Scale bars represent 20 μm. (B) Immunofluorescence detection, as above, in primary mouse cortical neurons. Asterisks indicate cells transfected with CP60 or CP69. Scale bars represent 10 μm.
FLAG-CP60 and FLAG-CP69, however, are strongly targeted to mitochondria in COS7 cells, where they alter mitochondrial morphology from the normal extended tubular structure to abnormal perinuclear clusters (Fig. 5A). Intriguingly, the majority of these abnormal clustered mitochondria do not take up the mitochondrial membrane potential-dependent dye mitotracker (Fig. 5A), indicating that chimeric protein expression inhibits normal mitochondrial function. Importantly, this loss of membrane potential occurs even when the chimeric proteins are exogenously expressed at the lowest levels detectable using this method (Fig. 5A). However, co-staining with the mitochondrial marker cytochrome c reveals that the mitochondria remain intact (Fig. 5A). DISC1 has previously been reported to induce mitochondrial dysfunction, including altered mitochondrial NADH activity (33). This enzyme participates in oxidative phosphorylation, a process which generates and maintains the mitochondrial membrane potential, thus the loss of mitochondrial membrane potential in cells expressing CP60 or CP69 possibly indicates a deleterious effect upon mitochondrial NADH activity. In cultured primary cortical neurons from the CD1 mouse strain [days in vitro (DIV) 5], or the C57BL/6 mouse strain (DIV 11), FLAG-CP60 and FLAG-CP69 induce the same mitochondrial clustering and the loss of membrane potential (Fig. 5B and Supplementary Material, Fig. S3). Altogether, these data show that the altered biophysical properties demonstrated for CP69, and most likely possessed by CP60 also, correlate with profoundly altered function within proliferating cells and neurons.
Investigating chimeric protein expression in lymphoblastoid cell lines
Identification of DISC1 chimeric transcripts prompted us to re-examine our previous report of reduced DISC1 protein expression as a result of the t(1;11) translocation (10). We expressed untagged CP1, CP60 or CP69 in COS7 cells, and investigated isoform expression using DISC1 antibody R47, specific for the N-terminal head domain (30). This demonstrated that CP1 is abundant in soluble lysates, whereas CP60 and CP69 partition predominantly to the pellet produced during cell lysis (Fig. 6A), as has been noted previously for a related DISC1 chimeric protein (34). However, a small proportion of each chimeric protein is also detectable within the soluble lysates. In addition to full-length DISC1, R47 detects a triplet of species of ∼71–80 kDa (30). CP1 (predicted molecular weight of 64.5 kDa) migrates between the 71 and 75 kDa species, whereas CP60 and CP69 (predicted molecular weights of 71.8 and 72.8 kDa, respectively) migrate between the 75 and 80 kDa species, thus each chimeric protein is distinct from the endogenous species detected by R47 on immunoblots (Fig. 6B).
Figure 6.

Chimeric protein expression in t(1;11) family-derived lymphoblastoid cell lines. (A) Overexpressed untagged CP69 partitions predominantly to pellets from transfected COS7 cells, as detected using antibody R47. L, lysate; P, pellet; +, transfected; -, non-transfected. Arrow marks CP69. CP60 expression is indistinguishable from that of CP69 (data not shown). (B) Migration of CP1, CP60 and CP69 with respect to endogenous species expressed in COS7, as detected by R47, shown only in lysates for clarity. Endogenous species sizes are indicated. -, non-transfected. Arrows mark the positions of overexpressed chimeric proteins. (C) Detection of endogenous species by R47 in lymphoblastoid cell line pellets. N, normal karyotype. Endogenous species sizes are indicated, including full-length DISC1 at 100 kDa. T, translocation. (D) Detection of endogenous species by α-DISC1 in lymphoblastoid cell line lysates. N, normal karyotype; T, translocation. The asterisk marks the predicted size of the hypothetical translation product of chimeric transcripts arising from the der 11 chromosome.
We next examined lymphoblastoid cell lines derived from members of the t(1;11) family. Our previous analysis focused on lysates, and did not detect any abnormal species in translocation cell lines (10). In this study, we examined pellets. The same triplet of bands at 71–80 kDa is detectable in both lysates and pellets, with no additional species detectable in cell lines carrying the translocation (Fig. 6C). The chimeric proteins are thus either not expressed, or are present below the level of detection using this antibody. The latter is consistent with the production, but apparent low expression/predicted short lifespan, of chimeric transcripts from the der 1 chromosome.
We also used α-DISC1 (35), an antibody specific for a translocation breakpoint distal DISC1 epitope that should detect the C-terminal fragment, amino acids 669–854, encoded by chimeric transcripts from the der 11 chromosome. Although the antibody clearly detects full-length DISC1 in the lymphoblastoid cell lines, it failed to detect any novel species in translocation cell lines that could correspond to this fragment (predicted molecular weight of 20.9 kDa, Fig. 6D). Thus, as with the N-terminal chimeric proteins, this fragment is either not expressed, or is present but below the detection limit of the antibody.
DISCUSSION
Although the t(1;11) translocation is a unique genetic event, understanding its molecular consequences in full may help explain the very high penetrance of this mutation and inform on other clinical mutations (15). Aberrant DISC1 proteins putatively arising from the der 1 chromosome lack the final 257 amino acids, required for interaction with a number of important binding partners, including NDE1/NDEL1 (15). C-terminal truncation will thus abolish critical interactions (36), while maintaining others that require amino acids 1–597, such as GSK3β (5,36). Phosphodiesterase 4 (10) utilizes multiple contact sites within amino acids 1–597 that are sufficient for DISC1/PDE4 interaction (10), but also a C-terminal site that is abolished by the translocation (37), which may consequently dysregulate this complex and dynamic interaction. Altogether, these few examples demonstrate that expression of C-terminally truncated DISC1 is likely to have pleiotropic effects at the cellular level. The importance of this is illustrated by the demonstration that, in vivo, expression of amino acids 1–597 by in utero electroporation in mice blocks neuronal migration within the developing cortex (6), whereas its transgenic expression in mice induces phenotypes resembling characteristics of human mental illness including enlarged lateral ventricles, and various behavioural deficits (38,39). The shortest aberrant species encoded by transcripts from the der 1 chromosome is CP1, which essentially corresponds to DISC1 amino acids 1–598. CP1 localization is indistinguishable from the aberrant localization of amino acids 1–597 (6); thus, we conclude it is a comparable species that is likely to behave in a similar manner.
Over and above the multiple effects of expressing amino acids 1–597, the additional 60 or 69 novel amino acids in CP60 and CP69 alter the structure of DISC1 amino acids 326–597, leading to the production of larger, more stable protein assemblies. This is intriguing because detergent-insoluble DISC1 aggregates have been detected previously in post-mortem brain samples from psychiatric patients (40,41). Altogether these observations highlight aberrant DISC1 assembly as a possible disease mechanism in psychiatric illness (40,41). The abnormal structure of CP60 and CP69 is predicted to adversely influence protein interactions, and is most likely related to their extreme effects upon mitochondrial morphology and membrane potential, effects which are not induced by amino acids 1–597 alone. However, CP60 and CP69 are very scarce in the translocation-carrying lymphoblastoid cell lines used in this study, if indeed they are expressed at all, so these data must be interpreted with caution. That said, we have demonstrated that even expression of these chimeric proteins at the lowest detectable levels is sufficient to induce mitochondrial dysfunction; thus, it is likely that any endogenous expression of these proteins would be deleterious.
It is not possible to properly assess the contributions of CP1, CP60 and CP69 to disease pathogenesis in translocation carriers until neural material is available for analysis. Induced pluripotent stem cell technology is the most likely route to this, and will be available in the not-too-distant future. Until then, we can only speculate that, because DISC1 is expressed extensively in the developing and adult brain, and expression of CP1, CP60 and CP69 is driven by the DISC1 promoter, it is likely that at some time chimeric transcripts will be produced at some level in the brain of t(1;11) carriers. Although this specific disease mechanism is unique to translocation carriers, it is notable that C-terminal truncation, addition of GFP tags and the ‘ultra-rare’ putative causal mutation R37W, identified in a single schizophrenic patient (42), all increase DISC1 mitochondrial targeting and induce abnormal morphology (Ogawa et al., manuscript in preparation) (43), whereas the schizophrenia-associated variant L607F influences neuronal mitochondrial transport (44). The psychiatric illness suffered by translocation carriers displays no unique features, thus it likely arises from dysregulation of a pathway common to other unrelated patients. Similarly, the abnormal chimeric DISC1 species, though unique, may act through a common pathway. We propose that this common pathway involves mitochondrial dysfunction. Mitochondria are essential for multiple processes within most cells, due to their role in the provision of energy and calcium homeostasis, as well as their role in apoptosis, either for the clearance of damaged cells or in programmed cell death. In the brain, neurons are particularly sensitive to mitochondrial dysfunction, because mitochondria must be transported to distal dendrites for the supply of energy and calcium buffering to the synapse (45). DISC1 is known to be critical for neural precursor proliferation and differentiation, neuronal migration and integration and synaptic signalling within the developing and adult brain (46). It is conceivable that many, if not all, of these processes would be compromised by mitochondrial dysfunction, if the chimeric proteins CP60 and CP69 are indeed expressed in the brains of t(1;11) translocation carriers, coupled with reduced expression of DISC1 at other subcellular locations, such as the synapse, nucleus and centrosome, due to the loss of normal DISC1 expression from the translocated allele.
MATERIALS AND METHODS
Bioinformatic methods
Chromosome 11 ESTs and DISC1 sequences were examined using the UCSC genome browser (http://genome.ucsc.edu). Predicted cDNA produced by the translocation was evaluated for coding potential, using the ExPASy TRANSLATE tool (www.expasy.org). Molecular weight calculations were also carried out using the ExPASy TRANSLATE tool and the ExPASy Compute Mw tool. Protein secondary structure predictions were made by submitting amino acid sequences independently to PsiPred (23), Jpred3 (22) and Porter (24).
Cell culture and transfection
This study utilized lymphoblastoid cell lines derived from members of the t(1;11) translocation family, either with a normal karyotype or carrying the balanced translocation. Translocation carriers included unaffected family members as well as those diagnosed with either schizophrenia or severe recurrent depression. Lymphoblastoid cell lines were grown in RPMI (Gibco) supplemented with 10% fetal calf serum (Gibco) under standard conditions, with a 75% medium change every 2–3 days. Karyotypes of cell lines used in this study were confirmed by chromosome banding of metaphase spreads. All lymphoblastoid cell lines were grown and harvested concurrently to minimize any effects upon gene expression due to variable growth conditions.
COS7 cells were maintained in Dulbecco's modified Eagle's medium (Invitrogen) containing 10% fetal bovine serum at 37°C in a 5% CO2 humidified atmosphere. Cortical neuron cultures were prepared from embryonic day (E) 18 mouse fetuses (CD1 or C57BL/6) as described previously (32), grown on cover slips coated with Poly-d-lysine and maintained in Neurobasal medium supplemented with 2% of B-27 and 2 mm Glutamax (all from Invitrogen) at 37°C with 5% CO2. Transfection of cultured cells and cortical neurons at 5 or 11 DIV was conducted using Lipofectamine 2000 (Invitrogen) according to the manufacturer's instructions.
RT-PCR analysis
RNA was prepared using the Qiagen RNeasy extraction kit, and cDNA was prepared using the First Strand cDNA synthesis kit (Roche) according to the manufacturer's instructions. PCR, to detect novel DISC1 chimeric transcripts, was carried out using Thermostart Taq polymerase (Abgene). A typical reaction contains 2 μl of 10× PCR reaction buffer, 1.2 μl of 25 mm magnesium chloride, 0.5 μl of dNTPs (of a 10 mm stock), 0.25 μl of forward and reverse primers (of a 300 ng/μl stock), 0.1 μl of Taq polymerase, 2 μl of DNA template and 13.7 μl of sterile water to a final volume of 20 μl. These reactions were cycled using a touchdown PCR programme as follows: [95°C, 15min; 94°C, 1 min; 70°C, 30s (−2°C/cycle); 72°C: 30s] × 6 cycles, followed by (94°C: 1 min; 60°C: 30s; 72°C: 30s) × 34 cycles, or for amplification of transcripts encoding CP1: hot start 95°C: 2min, followed by (95°C: 30s; 60°C: 30s; 72°C: 30s) × 35 cycles. Products were resolved using standard agarose gel electrophoresis.
For quantitative measurements, DISC1 expression was measured using the SYBR Green Real-time PCR Detection System (Bio-Rad Laboratories Ltd). For the quantification of DISC1 in t(1;11) family cell lines, a single reaction contained 7.5 μl of SYBR Green 2× Master Mix (Bio-Rad Laboratories Ltd), 0.25–0.5 μl of forward and reverse primers (stock concentration of 300 ng/μl), 3 μl of template cDNA and distilled water to a final volume of 15 μl. The reactions were cycled using the MyiQ Single-Colour Real-Time PCR Detection System (Bio-Rad Laboratories Ltd) as follows: 95°C: 3 min (1 cycle); 95°C: 10s; 66°C: 30s; 72°C: 45s (40 cycles), followed by melt curve analysis: 55°C: 10s (+0.5°C per cycle for 80 cycles). Relative DISC1 expression levels were calculated using the MyiQ Gene expression macro (Bio-Rad Laboratories Ltd), which utilizes the deltaCT method and corrects for primer amplification efficiencies (http://medgen.ugent.be/~jvdesomp/genorm) (47). DISC1 expression levels were normalized using the geometric mean of Glyceraldehyde-3-phosphate dehydrogenase (Gapdh) and Phosphofructokinase (PFK), and the use of each housekeeping gene gave the same results. The same panel of 10 cell lines (four normal, six translocation) was used for each assay. Results were obtained for all cell lines in each assay, with the exception of one translocation cell line when primers specific for DISC1 exons 4 and 6 were used. This failed assay was not repeatable since the RNA sample in question was spent. Data were analysed by two-tailed t-test (GraphPad Prism).
PCR product sequencing
Single PCR products were treated with ExoSAP-IT (GE Healthcare) prior to direct sequencing. Multiple PCR products were resolved by LMP agarose gel electrophoresis and extracted using the QIAquick gel extraction kit (Qiagen) prior to direct sequencing. Alternatively, purified PCR products were cloned using the TOPO TA cloning kit (Invitrogen) according to the manufacturer's instructions. BigDye Terminator sequencing of PCR products or plasmid DNA was carried out using 1 μl of BDv3.1, 1.5 μl of 5× sequencing buffer, 1 μl of DNA template and 6 μl of dH2O. Reactions were cycled as follows: 96°C: 1 min (1 cycle); 96°C: 10s; 50°C: 5s; 60°C: 4 min (25 cycles); 4°C hold. Sequencing chromatograms were analysed using Chromas (version 1.45) (48).
Primer sequences
The primers used to detect DISC1 expression by real-time PCR in t(1;11) cell lines were as follows: Exon 2 forward 5-GAACGTGGAGAAGCAGAAGG, reverse 5-CAGAGAAC TGGAGGAGCCAG; Exons 4–6 forward 5-AGCCTGCACT TTCAACTTCC, reverse 5-AGTTGCTGCTCTTGCTCCTC; Exon 9 forward 5-AGAGAGAGAAGGGCTGGAGG, reverse 5-GTCTCCTGGTGCTCCACTTC.
The housekeeping primers used were as follows: Gapdh forward 5-GGGAGCCAAAAGGGTCATCA, reverse 5-GTG GCAGTGATGGCATGGAC; hPFK forward 5-AGAGCGTT TCGATGATGCTT, reverse 5-GTGTTCCTCCCAGTCG TCAT.
Primers used to amplify DISC1 chimeric transcripts were as follows: Derived 1 DISC1 chimeric transcript: Exon 4 DISC1 forward 5-AGCCTGCACTTTCAACTTCC, DISC1FP1 exon 4 reverse 5-AAGACCCACAGATGGAATCG; Derived 1 DISC1 chimeric transcript: Exon 6/7 DISC1 forward 5-AAG GAGCCTCCAGGAAAGAA, DISC1FP1 exon 3a reverse 5-CAAGAAATGCCAAAGTGAGTTC; Derived 11 DISC1 fusion with BU599486: exon 2 forward 5-GGGACCTGG AATTGAAGAGA, DISC1 Exon 9 reverse 5-GTCTCCTGG TGCTCCACTTC.
Primers used for the mutagenesis of recombinant DISC1/DISCFP1 chimeric transcripts: forward 5-AAATGCATGC AATTAGCTAATAAGGCACCACCGATCGTAGTCTG, reverse 5-CAGACTACGATCGGTGGTGCCTTATTAGCTA ATTGCATGCATTT.
Plasmid constructs
A pcDNA3.1 expression construct carrying full-length N-terminally FLAG-tagged DISC1 has been described previously (37). ORFs encoding human DISC1 amino acids 1–597, plus the 60 or 69 residues from DISC1FP1 (CP60 or CP69), were synthesized by GeneArt (Invitrogen) and inserted, untagged, in pcDNA3.1. To generate tagged versions of CP60 and CP69, N-terminal FLAG-tags were subsequently added. N-terminally FLAG-tagged DISC1 amino acids 1–597 and 1–598 were also in pcDNA3.1.
An ORF encoding N-terminally His-tagged human DISC1 amino acids 326–597, plus the 69 residues from DISC1FP1, was codon-optimized for expression in E. coli and synthesized by GeneArt (Invitrogen, Supplementary Material, Fig. S1). The ORF was recombined sequentially into pDONR-221 (Invitrogen) and pETG-40A (A. Geerlof, EMBL) vectors using BP and LR clonase (Invitrogen), adding an N-terminal MBP tag. This construct will be referred to as MBP-ΔNCP69. A control construct, lacking the additional 69-residues (MBP-ΔN597), was generated by the introduction of two stop codons after the final wild-type DISC1 residue, using a QuikChange II Site-Directed Mutagenesis Kit (Agilent Technology). The cloned constructs were confirmed by sequencing.
Recombinant protein production
Identical expression and purification conditions were used for MBP-ΔN597 and MBP-ΔNCP69. Constructs were first transformed into E. coli BL21 Star (DE3) (Invitrogen) and grown in 2XTY medium containing 100 µg/ml carbenicillin to an optical density of ∼0.6 at 37°C (at 600 nm). Protein expression was induced with 1 mm IPTG (isopropyl β-d-thiogalactoside) and cultures were grown at 37°C for 3h before harvesting by centrifugation (5500g, 4°C, 15 min) and pellets snap-frozen and stored at −70°C until required. For purification, bacterial pellets were spun down and resuspended in amylose-affinity purification buffer (AAP buffer: 20 mm Tris/200 mm NaCl/1 mm EDTA/1 mm DTT/10% glycerol, pH 7.4) containing Complete protease inhibitor cocktail (Roche) at 50 ml of buffer per litre of culture pellet. Cells were lysed using a TS Cell Disruptor (Constant Systems, 22 kPsi), centrifuged at 50 000g for 1h and the supernatant filtered through 0.2 µm Whatman cellulose nitrate membrane filters. The lysate was loaded onto an 8 ml amylose-sepharose affinity column (New England BioLabs), using an ÄKTApurifier (GE Healthcare). Non-specific proteins were washed out with 10 column volumes (CV) of AAP buffer and the protein (MBP-ΔN597 or MBP-ΔNCP69) eluted using 10 CV of AAP buffer containing 10 mm maltose. Eluted protein was further purified by size-based separation using a 320 ml HiLoad 26/60 Superdex 200 pg column (GE Healthcare), to which 1.5 CV of storage buffer (25 mm HEPES/200 mM NaCl/10% glycerol, pH 7.4 at 10°C) was applied. The fractions containing proteins (MBP-ΔN597 or MBP-ΔNCP69) were confirmed by SDS–PAGE, and were subsequently concentrated using 10 kDa MWCO Vivaspin Sample Concentrators (Sartorius Stedim Biotech). The identity of individual SDS–PAGE-purified protein bands (MBP-ΔN597 and MBP-ΔNCP69) was confirmed by MALDI-TOF mass spectroscopy, using a Voyager DE-STR MALDI-TOF mass spectrometer (Applied Biosystems). The spectral data were processed using Data Explorer software (Applied Biosystems) and the peptide masses searched using GPMAW 8.0 software (49), after creating a database with the specific modified sequences of MBP-ΔN597 and MBP-ΔNCP69. The identified peptides, found using GPMAW, were cross-checked with the observed peaks in the raw data in Data Explorer and found to match (Supplementary Material, Fig. S2).
Biophysical characterization
The mean hydrodynamic diameter for each protein batch was determined by DLS on a Zetasizer Auto Plate Sampler (Malvern Instruments), with percentage number used as the output format. Each DLS measurement was performed on purified protein that was initially centrifuged for 15min at 24 000g in a desk-top centrifuge and ∼100 μl aliquots loaded into a 384-well plate for analysis with the laser set at 830 nm. Size distribution of each protein construct was determined by performing three independent runs of three measurements (18 × 10s readings of each sample) at 10°C. DLS is an extremely sensitive tool for detecting the onset of aggregation resulting from protein melting and was thus used to estimate the thermal melting points of the proteins (50) by heating the sample from 10 to 80°C with 2°C increments. Results from three independent batches of each protein (MBP-ΔNCP69 and MBP-ΔN597) were compared by two-tailed, unpaired t-tests. To investigate secondary structure, protein was desalted into 10 mm phosphate buffer (8 mm Na2HPO4/2 mm NaH2PO4, pH 7.4), using pre-equilibrated PD-10 columns (GE Healthcare) and then diluted to 0.11 mg/ml (MBP-ΔNCP69) or 0.12 mg/ml (MBP-ΔN597), as measured using a V-550 UV-VIS spectrophotometer (JASCO) based on absorbance at 280 nm and the theoretical extinction coefficient of the respective protein sequences. CD analysis was performed on a J-810 spectropolarimeter (JASCO) at 25°C, using a 0.1 cm cuvette (Starna), and with wavelengths in the far UV-range of 185–280 nm. Each CD spectrum represents the average of five scans (data pitch: 0.1 nm; scan speed: 10 nm/min; response time: 2s) and was corrected by subtraction of the respective spectrum obtained for its desalted buffer solution (five-scan average accumulation). The obtained raw spectrum signal was then converted from ellipticity (millidegrees) into mean residue ellipticity (degrees cm2 per dmol per residue), to allow for concentration and protein size-independent spectrum measurement for comparison purposes, using the Spectra Manager software. The spectra were then submitted to DICHROWEB (21) for deconvolution into secondary structure components utilizing the analysis programs CDSSTR or CONTIN (18–20), with reference sets ‘Dataset 3’ or SP175 (17).
Immunocytochemistry
To visualize mitochondria, MitoTracker Red CMXRos (Invitrogen) was added to the culture medium at a concentration of 50 nm and incubated for 30 min at 37°C prior to fixation. Cells were fixed in 3.7% formalin for 10 min at room temperature, followed by permeabilization with methanol at −20°C for 5 min. Cells were then blocked in PBS containing 3% bovine serum albumin for 20 min, and incubated with primary antibodies for 2 (neurons) or 1 h (COS7) at room temperature on a platform shaker, followed by incubation with secondary antibodies for 1 h at room temperature. Dilution of primary antibodies is as follows: anti-FLAG rabbit polyclonal (1:5000; Sigma), anti-cytochrome c mouse monoclonal (1:2000–3000; Mitosciences/Abcam). Secondary antibodies were Alexa Fluor 488 goat anti-rabbit (A11008) and Alexa Fluor 647 chicken anti-mouse (1:2000; Invitrogen). Confocal images were acquired with a Zeiss LSM510 microscope, and non-confocal images (Supplementary Material, Fig. S3) were captured using a Zeiss Axioskop 2 MOT epifluorescence microscope.
Immunoblotting
Lysates were prepared in ice-cold RIPA buffer containing Complete Protease Inhibitor Cocktail (Roche). Lysates were solubilized by incubation for 1h at 4°C on a rotary wheel and centrifuged at 24 000g for 30 min. Following centrifugation, pellets were separated from supernatants and sample buffer added to each. 3–8 or 15% polyacrylamide gels were used to separate proteins for analysis with the R47 or α-DISC1 antibodies, respectively. Samples were separated at 150 V and then transferred to PVDF membranes for analysis.
DISC1 R47 (30) and α-DISC1 (35) antibodies were used to analyse DISC1 protein expression. Prior to incubation with the R47 primary antibody, membranes were blocked overnight at 4°C in PBS 0.2% Tween (PBST) containing 5% Marvel. The R47 primary antibody was incubated at a 1:100 dilution in PBST for 1h at room temperature. Prior to incubation with α-DISC1, membranes were blocked in TBS 0.1% Tween (TBST) containing 1% Marvel for 30min at room temperature. The α-DISC1 primary antibody was incubated at 1:2000 in TBST/1% Marvel overnight at 4°C. Membranes were washed with either PBST or TBST followed by secondary antibody incubation. Goat anti-rabbit secondary antibodies (HRP conjugates, DakoCytomaten) were incubated at 1:3000 (in PBST or TBST as appropriate) for 20min at room temperature. Membranes were processed using ECL Plus (GE Healthcare).
SUPPLEMENTARY MATERIAL
Supplementary Material is available at HMG online.
ACKNOWLEDGEMENTS
We thank Andrew Cronshaw for advice on mass spectroscopy, Paul Perry for advice on imaging and Professor Tetsu Akiyama for the α-DISC1 antibody.
Conflict of Interest statement. None declared.
FUNDING
This work was supported by grants from the UK Medical Research Council (G0600214, G0902166) and the Wellcome Trust (069300, WT088179MA), and by RCUK fellowship funding for J.K.M. (GR/T27983/01). Use of the Centre for Translational and Chemical Biology facilities was supported by the Wellcome Trust, the Scottish University Life Sciences Alliance and the BBSRC. Funding to pay the Open Access publication charges for this article was provided by the UK Medical Research Council (G0902166) and the Wellcome Trust (069300, WT088179MA).
REFERENCES
- 1.Blackwood D.H., Fordyce A., Walker M.T., St Clair D.M., Porteous D.J., Muir W.J. Schizophrenia and affective disorders—cosegregation with a translocation at chromosome 1q42 that directly disrupts brain-expressed genes: clinical and P300 findings in a family. Am. J. Hum. Genet. 2001;69:428–433. doi: 10.1086/321969. [DOI] [PMC free article] [PubMed] [Google Scholar]
- 2.Millar J.K., Wilson-Annan J.C., Anderson S., Christie S., Taylor M.S., Semple C.A., Devon R.S., St Clair D.M., Muir W.J., Blackwood D.H., et al. Disruption of two novel genes by a translocation co-segregating with schizophrenia. Hum. Mol. Genet. 2000;9:1415–1423. doi: 10.1093/hmg/9.9.1415. [DOI] [PubMed] [Google Scholar]
- 3.Bradshaw N.J., Porteous D.J. DISC1-binding proteins in neural development, signalling and schizophrenia. Neuropharmacology. 2012;62:1230–1241. doi: 10.1016/j.neuropharm.2010.12.027. [DOI] [PMC free article] [PubMed] [Google Scholar]
- 4.Chubb J.E., Bradshaw N.J., Soares D.C., Porteous D.J., Millar J.K. The DISC locus in psychiatric illness. Mol. Psychiatry. 2008;13:36–64. doi: 10.1038/sj.mp.4002106. [DOI] [PubMed] [Google Scholar]
- 5.Mao Y., Ge X., Frank C.L., Madison J.M., Koehler A.N., Doud M.K., Tassa C., Berry E.M., Soda T., Singh K.K., et al. Disrupted in schizophrenia 1 regulates neuronal progenitor proliferation via modulation of GSK3beta/beta-catenin signaling. Cell. 2009;136:1017–1031. doi: 10.1016/j.cell.2008.12.044. [DOI] [PMC free article] [PubMed] [Google Scholar]
- 6.Kamiya A., Kubo K., Tomoda T., Takaki M., Youn R., Ozeki Y., Sawamura N., Park U., Kudo C., Okawa M., et al. A schizophrenia-associated mutation of DISC1 perturbs cerebral cortex development. Nat. Cell Biol. 2005;7:1167–1178. doi: 10.1038/ncb1328. [DOI] [PubMed] [Google Scholar]
- 7.Duan X., Chang J.H., Ge S., Faulkner R.L., Kim J.Y., Kitabatake Y., Liu X.B., Yang C.H., Jordan J.D., Ma D.K., et al. Disrupted-In-Schizophrenia 1 regulates integration of newly generated neurons in the adult brain. Cell. 2007;130:1146–1158. doi: 10.1016/j.cell.2007.07.010. [DOI] [PMC free article] [PubMed] [Google Scholar]
- 8.Hayashi-Takagi A., Takaki M., Graziane N., Seshadri S., Murdoch H., Dunlop A.J., Makino Y., Seshadri A.J., Ishizuka K., Srivastava D.P., et al. Disrupted-in-Schizophrenia 1 (DISC1) regulates spines of the glutamate synapse via Rac1. Nat. Neurosci. 2010;13:327–332. doi: 10.1038/nn.2487. [DOI] [PMC free article] [PubMed] [Google Scholar]
- 9.Wang Q., Charych E.I., Pulito V.L., Lee J.B., Graziane N.M., Crozier R.A., Revilla-Sanchez R., Kelly M.P., Dunlop A.J., Murdoch H., et al. The psychiatric disease risk factors DISC1 and TNIK interact to regulate synapse composition and function. Mol. Psychiatry. 2011;16:1006–1023. doi: 10.1038/mp.2010.87. [DOI] [PMC free article] [PubMed] [Google Scholar]
- 10.Millar J.K., Pickard B.S., Mackie S., James R., Christie S., Buchanan S.R., Malloy M.P., Chubb J.E., Huston E., Baillie G.S., et al. DISC1 and PDE4B are interacting genetic factors in schizophrenia that regulate cAMP signaling. Science. 2005;310:1187–1191. doi: 10.1126/science.1112915. [DOI] [PubMed] [Google Scholar]
- 11.Zhou X., Geyer M.A., Kelsoe J.R. Does disrupted-in-schizophrenia (DISC1) generate fusion transcripts? Mol. Psychiatry. 2008;13:361–363. doi: 10.1038/sj.mp.4002125. [DOI] [PMC free article] [PubMed] [Google Scholar]
- 12.Seal R.L., Gordon S.M., Lush M.J., Wright M.W., Bruford E.A. genenames.org: the HGNC resources in 2011. Nucleic Acids Res. 2011;39:D514–519. doi: 10.1093/nar/gkq892. [DOI] [PMC free article] [PubMed] [Google Scholar]
- 13.Thierry-Mieg D., Thierry-Mieg J. AceView: a comprehensive cDNA-supported gene and transcripts annotation. Genome Biol. 2006;7(Suppl. 1):S12. doi: 10.1186/gb-2006-7-s1-s12. 1–14. [DOI] [PMC free article] [PubMed] [Google Scholar]
- 14.Wagner E., Lykke-Andersen J. mRNA surveillance: the perfect persist. J. Cell Sci. 2002;115:3033–3038. doi: 10.1242/jcs.115.15.3033. [DOI] [PubMed] [Google Scholar]
- 15.Soares D.C., Carlyle B.C., Bradshaw N.J., Porteous D.J. DISC1: structure, function, and therapeutic potential for major mental illness. ACS Chem. Neurosci. 2011;2:609–632. doi: 10.1021/cn200062k. [DOI] [PMC free article] [PubMed] [Google Scholar]
- 16.Greenfield N.J. Using circular dichroism spectra to estimate protein secondary structure. Nat. Protoc. 2006;1:2876–2890. doi: 10.1038/nprot.2006.202. [DOI] [PMC free article] [PubMed] [Google Scholar]
- 17.Lees J.G., Miles A.J., Wien F., Wallace B.A. A reference database for circular dichroism spectroscopy covering fold and secondary structure space. Bioinformatics. 2006;22:1955–1962. doi: 10.1093/bioinformatics/btl327. [DOI] [PubMed] [Google Scholar]
- 18.Manavalan P., Johnson W.C., Jr Variable selection method improves the prediction of protein secondary structure from circular dichroism spectra. Anal. Biochem. 1987;167:76–85. doi: 10.1016/0003-2697(87)90135-7. [DOI] [PubMed] [Google Scholar]
- 19.Provencher S.W., Glockner J. Estimation of globular protein secondary structure from circular dichroism. Biochemistry. 1981;20:33–37. doi: 10.1021/bi00504a006. [DOI] [PubMed] [Google Scholar]
- 20.van Stokkum I.H., Spoelder H.J., Bloemendal M., van Grondelle R., Groen F.C. Estimation of protein secondary structure and error analysis from circular dichroism spectra. Anal. Biochem. 1990;191:110–118. doi: 10.1016/0003-2697(90)90396-q. [DOI] [PubMed] [Google Scholar]
- 21.Whitmore L., Wallace B.A. DICHROWEB, an online server for protein secondary structure analyses from circular dichroism spectroscopic data. Nucleic Acids Res. 2004;32:W668–W673. doi: 10.1093/nar/gkh371. [DOI] [PMC free article] [PubMed] [Google Scholar]
- 22.Cole C., Barber J.D., Barton G.J. The Jpred 3 secondary structure prediction server. Nucleic Acids Res. 2008;36:W197–W201. doi: 10.1093/nar/gkn238. [DOI] [PMC free article] [PubMed] [Google Scholar]
- 23.McGuffin L.J., Bryson K., Jones D.T. The PSIPRED protein structure prediction server. Bioinformatics. 2000;16:404–405. doi: 10.1093/bioinformatics/16.4.404. [DOI] [PubMed] [Google Scholar]
- 24.Pollastri G., McLysaght A. Porter: a new, accurate server for protein secondary structure prediction. Bioinformatics. 2005;21:1719–1720. doi: 10.1093/bioinformatics/bti203. [DOI] [PubMed] [Google Scholar]
- 25.Lupas A. Prediction and analysis of coiled-coil structures. Methods Enzymol. 1996;266:513–525. doi: 10.1016/s0076-6879(96)66032-7. [DOI] [PubMed] [Google Scholar]
- 26.Lupas A., Van Dyke M., Stock J. Predicting coiled coils from protein sequences. Science. 1991;252:1162–1164. doi: 10.1126/science.252.5009.1162. [DOI] [PubMed] [Google Scholar]
- 27.Leliveld S.R., Hendriks P., Michel M., Sajnani G., Bader V., Trossbach S., Prikulis I., Hartmann R., Jonas E., Willbold D., et al. Oligomer assembly of the C-terminal DISC1 domain (640–854) is controlled by self-association motifs and disease-associated polymorphism S704C. Biochemistry. 2009;48:7746–7755. doi: 10.1021/bi900901e. [DOI] [PubMed] [Google Scholar]
- 28.Morris J.A., Kandpal G., Ma L., Austin C.P. DISC1 (Disrupted-In-Schizophrenia 1) is a centrosome-associated protein that interacts with MAP1A, MIPT3, ATF4/5 and NUDEL: regulation and loss of interaction with mutation. Hum. Mol. Genet. 2003;12:1591–1608. doi: 10.1093/hmg/ddg162. [DOI] [PubMed] [Google Scholar]
- 29.Sawamura N., Ando T., Maruyama Y., Fujimuro M., Mochizuki H., Honjo K., Shimoda M., Toda H., Sawamura-Yamamoto T., Makuch L.A., et al. Nuclear DISC1 regulates CRE-mediated gene transcription and sleep homeostasis in the fruit fly. Mol. Psychiatry. 2008;13:1138–1148. doi: 10.1038/mp.2008.101. 1069. [DOI] [PMC free article] [PubMed] [Google Scholar]
- 30.James R., Adams R.R., Christie S., Buchanan S.R., Porteous D.J., Millar J.K. Disrupted in Schizophrenia 1 (DISC1) is a multicompartmentalized protein that predominantly localizes to mitochondria. Mol. Cell. Neurosci. 2004;26:112–122. doi: 10.1016/j.mcn.2004.01.013. [DOI] [PubMed] [Google Scholar]
- 31.Kuroda K., Yamada S., Tanaka M., Iizuka M., Yano H., Mori D., Tsuboi D., Nishioka T., Namba T., Iizuka Y., et al. Behavioral alterations associated with targeted disruption of exons 2 and 3 of the Disc1 gene in the mouse. Hum. Mol. Genet. 2011;20:4666–4683. doi: 10.1093/hmg/ddr400. [DOI] [PubMed] [Google Scholar]
- 32.Bradshaw N.J., Ogawa F., Antolin-Fontes B., Chubb J.E., Carlyle B.C., Christie S., Claessens A., Porteous D.J., Millar J.K. DISC1, PDE4B, and NDE1 at the centrosome and synapse. Biochem. Biophys. Res. Commun. 2008;377:1091–1096. doi: 10.1016/j.bbrc.2008.10.120. [DOI] [PubMed] [Google Scholar]
- 33.Park Y.U., Jeong J., Lee H., Mun J.Y., Kim J.H., Lee J.S., Nguyen M.D., Han S.S., Suh P.G., Park S.K. Disrupted-in-schizophrenia 1 (DISC1) plays essential roles in mitochondria in collaboration with Mitofilin. Proc. Natl Acad. Sci. USA. 2010;107:17785–17790. doi: 10.1073/pnas.1004361107. [DOI] [PMC free article] [PubMed] [Google Scholar]
- 34.Zhou X., Chen Q., Schaukowitch K., Kelsoe J.R., Geyer M.A. Insoluble DISC1-Boymaw fusion proteins generated by DISC1 translocation. Mol. Psychiatry. 2010;15:669–672. doi: 10.1038/mp.2009.127. [DOI] [PMC free article] [PubMed] [Google Scholar]
- 35.Ogawa F., Kasai M., Akiyama T. A functional link between Disrupted-In-Schizophrenia 1 and the eukaryotic translation initiation factor 3. Biochem. Biophys. Res. Commun. 2005;338:771–776. doi: 10.1016/j.bbrc.2005.10.013. [DOI] [PubMed] [Google Scholar]
- 36.Newburn E.N., Hyde T.M., Ye T., Morita Y., Weinberger D.R., Kleinman J.E., Lipska B.K. Interactions of human truncated DISC1 proteins: implications for schizophrenia. Transl. Psychiatry. 2011;1:e30. doi: 10.1038/tp.2011.31. [DOI] [PMC free article] [PubMed] [Google Scholar]
- 37.Murdoch H., Mackie S., Collins D.M., Hill E.V., Bolger G.B., Klussmann E., Porteous D.J., Millar J.K., Houslay M.D. Isoform-selective susceptibility of DISC1/phosphodiesterase-4 complexes to dissociation by elevated intracellular cAMP levels. J. Neurosci. 2007;27:9513–9524. doi: 10.1523/JNEUROSCI.1493-07.2007. [DOI] [PMC free article] [PubMed] [Google Scholar]
- 38.Hikida T., Jaaro-Peled H., Seshadri S., Oishi K., Hookway C., Kong S., Wu D., Xue R., Andrade M., Tankou S., et al. Dominant-negative DISC1 transgenic mice display schizophrenia-associated phenotypes detected by measures translatable to humans. Proc. Natl Acad. Sci. USA. 2007;104:14501–14506. doi: 10.1073/pnas.0704774104. [DOI] [PMC free article] [PubMed] [Google Scholar]
- 39.Pletnikov M.V., Ayhan Y., Nikolskaia O., Xu Y., Ovanesov M.V., Huang H., Mori S., Moran T.H., Ross C.A. Inducible expression of mutant human DISC1 in mice is associated with brain and behavioral abnormalities reminiscent of schizophrenia. Mol. Psychiatry. 2008;13:115. doi: 10.1038/sj.mp.4002079. [DOI] [PubMed] [Google Scholar]
- 40.Korth C. DISCopathies: brain disorders related to DISC1 dysfunction. Rev. Neurosci. 2009;20:321–330. doi: 10.1515/revneuro.2009.20.5-6.321. [DOI] [PubMed] [Google Scholar]
- 41.Leliveld S.R., Bader V., Hendriks P., Prikulis I., Sajnani G., Requena J.R., Korth C. Insolubility of disrupted-in-schizophrenia 1 disrupts oligomer-dependent interactions with nuclear distribution element 1 and is associated with sporadic mental disease. J. Neurosci. 2008;28:3839–3845. doi: 10.1523/JNEUROSCI.5389-07.2008. [DOI] [PMC free article] [PubMed] [Google Scholar]
- 42.Song W., Li W., Feng J., Heston L.L., Scaringe W.A., Sommer S.S. Identification of high risk DISC1 structural variants with a 2% attributable risk for schizophrenia. Biochem. Biophys. Res. Commun. 2008;367:700–706. doi: 10.1016/j.bbrc.2007.12.117. [DOI] [PubMed] [Google Scholar]
- 43.Millar J.K., James R., Christie S., Porteous D.J. Disrupted in schizophrenia 1 (DISC1): subcellular targeting and induction of ring mitochondria. Mol. Cell. Neurosci. 2005;30:477–484. doi: 10.1016/j.mcn.2005.08.021. [DOI] [PubMed] [Google Scholar]
- 44.Atkin T.A., MacAskill A.F., Brandon N.J., Kittler J.T. Disrupted in Schizophrenia-1 regulates intracellular trafficking of mitochondria in neurons. Mol. Psychiatry. 2011;16:121. doi: 10.1038/mp.2010.110. [DOI] [PubMed] [Google Scholar]
- 45.Han X.J., Tomizawa K., Fujimura A., Ohmori I., Nishiki T., Matsushita M., Matsui H. Regulation of mitochondrial dynamics and neurodegenerative diseases. Acta Med. Okayama. 2011;65:1–10. doi: 10.18926/AMO/43824. [DOI] [PubMed] [Google Scholar]
- 46.Brandon N.J., Sawa A. Linking neurodevelopmental and synaptic theories of mental illness through DISC1. Nat. Rev. Neurosci. 2011;12:707–722. doi: 10.1038/nrn3120. [DOI] [PMC free article] [PubMed] [Google Scholar]
- 47.Vandesompele J., De Preter K., Pattyn F., Poppe B., Van Roy N., De Paepe A., Speleman F. Accurate normalization of real-time quantitative RT-PCR data by geometric averaging of multiple internal control genes. Genome Biol. 2002;3 doi: 10.1186/gb-2002-3-7-research0034. RESEARCH0034. [DOI] [PMC free article] [PubMed] [Google Scholar]
- 48.McCarthy C. Chromas, version 1.45. Brisbane: School of Biomolecular and Biomedical Science, Griffith University; 1996. [Google Scholar]
- 49.Peri S., Steen H., Pandey A. GPMAW—a software tool for analyzing proteins and peptides. Trends Biochem. Sci. 2001;26:687–689. doi: 10.1016/s0968-0004(01)01954-5. [DOI] [PubMed] [Google Scholar]
- 50.Nobbmann U., Connah M., Fish B., Varley P., Gee C., Mulot S., Chen J., Zhou L., Lu Y., Shen F., et al. Dynamic light scattering as a relative tool for assessing the molecular integrity and stability of monoclonal antibodies. Biotechnol. Genet. Eng. Rev. 2007;24:117–128. doi: 10.1080/02648725.2007.10648095. [DOI] [PubMed] [Google Scholar]
Associated Data
This section collects any data citations, data availability statements, or supplementary materials included in this article.