

Abstract
Context:
The effectiveness of education in modifying hydration behaviors in adolescent athletes is unclear.
Objective:
To assess the hydration status and behaviors of female athletes before and after a 1-time educational intervention and prescribed hydration intervention in a warm, humid, tropical environment.
Design:
Cohort study.
Setting:
Non–air-conditioned gymnasium in a tropical environment (indoor wet bulb globe temperature = 24.0 ± 0.2°C).
Patient or Other Participants:
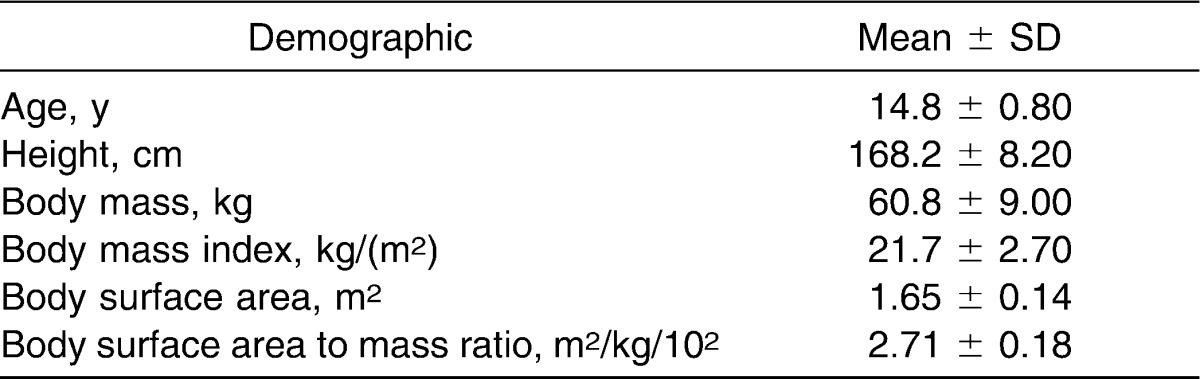
Thirty-six female adolescent elite volleyball players (age = 14.8 ± 0.8 years, height = 168.2 ± 8.2 cm, mass = 60.8 ± 9.0 kg, body mass index = 21.7 ± 2.7, body surface area = 1.65 ± 0.14 m2, body surface area to mass ratio = 2.71 ± 0.18 m2·kg−1·10−2) participated.
Intervention(s):
Four observational periods consisting of 3 practices per observational period separated by 48 hours. The 4 periods included a control period, educational intervention, prescribed hydration intervention (PHI), and observational follow-up (OF-U). After the control period, an educational intervention consisting of a slide presentation was provided to the participants, followed by a week of observation. In the PHI, a precalculated volume of water based on individual sweat rate was consumed every 20 minutes during each 2-hour practice. During all other periods, participants consumed their fluid of choice ad libitum. The order of the treatment periods was not randomized and was the same for all participants.
Main Outcome Measure(s):
Prepractice to postpractice changes in body mass (ΔBM), percentage of body mass lost (%BML), urine specific gravity, urine color, urine osmolality, sweat rate, and volume of fluid consumed (Fvol).
Results:
The PHI was the only period during which participants maintained body mass (ΔBM = 0.05 ± 1.3%); Fvol consumed was greatest during this time (Fvol = 1.3 ± 0.4 L; F1,3 = 34.869, P ≤ .001). The ΔBM was less for the PHI (ΔBM = 0.05 ± 0.9 kg, %BML = 0.04 ± 1.3%) than the OF-U period (ΔBM = −0.7 ± 1.1 kg, %BML = −1.2 ± 1.9%; F1,3 = 6.220, P = .01). The Fvol (1.3 ± 0.4 L) and percentage of fluid consumed (143.7 ± 110.8%) to restore sweat loss for the PHI period were higher than for any other period (F1,3 = 34.869, P ≤ .001). None of the participants experienced serious dehydration in any of the conditions.
Conclusions:
A 1-time education session alone was not successful in changing hydration behaviors. However, prescribing individualized hydration protocols improved hydration for adolescents exercising in a warm, humid environment.
Keywords: voluntary dehydration, hydration assessment, fluid guidelines, practical application
Key Points
Education alone did not change hydration behaviors of adolescent female athletes.
Change in body mass alone should be used only to determine acute hydration changes during practice and should not be used to indicate the athlete's actual hydration status; whenever possible, overall hydration status should be confirmed through urinalysis.
A large percentage of athletes reported practicing in hypohydrated conditions.
During the prescribed hydration intervention period, participants consumed a greater volume of fluid, achieved a higher sweat rate than during any other period, and maintained body mass with a commensurate decrease in urine osmolality.
Coaches should be educated about scheduling appropriate water and rest breaks during red-flag conditions.
Maintaining optimal hydration during exercise improves performance and reduces the risk of exertional heat illness in warm, humid environments.1 Children and adults dehydrate while exercising in hot environments even when allowed to drink ad libitum, resulting in voluntary dehydration.2–5 However, evidence supporting the use of educational intervention about modification of hydration behaviors in adolescents during physical activity is limited.6–8 In one of the few studies in which this issue is addressed, Decher et al7 reported that after an educational intervention during summer sports camps (soccer and football), hydration knowledge was improved but no change in hydration behavior was observed. They noted that (1) adolescents were dehydrated chronically upon entering and throughout summer sports camps, (2) participants generally were aware of their hydration practices and could identify impediments to hydration, and (3) participants did not translate hydration knowledge into successful hydration strategies.7 The authors suggested that hydration knowledge alone was not enough to prevent voluntary dehydration and that coaches, camp staff, and athletes needed to develop and implement more effective hydration strategies.7 Prescribed drinking volumes to replace fluid lost through sweat have been recommended to maintain euhydration.5
Implementation of a drinking strategy requiring athletes to rehydrate at specified times and with individually prescribed drinking volumes might be more effective than fluid ingestion ad libitum.8 Stover et al8 reported that ad libitum fluid ingestion used by high school football players during 2-a-day preseason practices was less than optimal, resulting in a mean prepractice urine specific gravity (Usg) ranging from 1.022 to 1.024 and a mean prepractice body mass (BM) that was lower by about 0.5 kg after the first day of practice. When a prescribed hydration intervention by drinking 2 bottles of sport drink or water (591 mL per bottle) was required between practices, the athletes improved their prepractice hydration status (Usg = 1.016), and mean BM increased by 0.5 kg. The researchers suggested that investigators should explore effective hydration strategies for improving hydration status.8
When allowed ad libitum or combined with an educational intervention, rehydration does not result in adequate replacement of fluids lost during competition. We do not know what changes might occur in hydration behaviors of adolescents when an educational intervention followed by a prescribed hydration intervention is incorporated during an actual competitive season. Therefore, the purpose of our study was to assess hydration status and behaviors in female adolescent athletes before and after practice with an educational intervention followed by a prescribed hydration intervention in a warm, humid, tropical environment.
METHODS
Research Design
We conducted a repeated-measures design study consisting of 4 observational periods in the following order: control period (CP), educational intervention (EI) period, prescribed hydration intervention (PHI) period, and observational follow-up (OF-U) period (Figure 1). Each period consisted of 3 practices separated by 48 hours. Data were collected before and after regularly scheduled practices on Monday, Wednesday, and Friday of each week. The order of the intervention periods followed the pedagogical model of describing, demonstrating, and allowing integration of the knowledge. Initially, the CP was used to establish the ad libitum hydration behaviors of the participants. Subsequently, participants entered the EI period, during which they watched an educational slideshow on proper hydration practices following recommendations of the National Athletic Trainers' Association (NATA)9 and were given a handout to help reinforce the information. For the PHI period, each participant was given a designated volume of fluid to consume, which was based on her sweat rate calculated during the CP. During this period, participants were required to consume the prescribed volume of fluid during practice; they could consume more fluid if desired. Mandatory drink breaks at 20-minute intervals were signaled by an investigator (D.W.). The OF-U was the final period of observation and was conducted to determine if the previous experimental treatments affected the hydration behaviors of the participants. We made no attempt to influence hydration behaviors of players or coaches during this period. The effectiveness of the experimental interventions was determined by changes in BM (ΔBM) and urine concentration measured by specific gravity (Usg), color (Ucol), and osmolality (Uosm).10 We calculated sweat rate and recorded volume of fluid consumed (Fvol), and we recorded perceptual measures after practice using an Environmental Symptoms Questionnaire (ESQ).11 Ambient indoor environmental conditions were recorded using wet bulb globe temperature (WBGTi) for each practice session.
Figure 1.

Data collection timeline for 4 observation periods.
Participants
We recruited 40 adolescent female athletes; however, 4 participants were unable to complete the study because of injuries unrelated to the investigation (2 ankle sprains, 1 wrist sprain, and 1 facial fracture) and were not included in the analyses. Demographic data of the 36 participants are presented in Table 1. Participants were recruited from a competitive volleyball club, which had competed successfully at the national and Junior Olympic levels. The athletes had been cleared for participation by their physicians before recruitment for the study. All participants completed health and injury history questionnaires, physical activity readiness questionnaires, and heat illness risk assessments.12 Menstrual history was recorded on the health and injury history questionnaire, and all participants had reached menarche. Participants were instructed to continue their normal eating and drinking habits and volleyball practice in a non–air-conditioned gymnasium throughout the investigation. All participants had been practicing volleyball for several weeks on Oahu, a tropical island in Hawaii with few seasonal variations in temperature. The average high temperature on Oahu during the data collection period was 28°C (82°F). Therefore, our participants were considered to be acclimatized to hot and humid conditions by their physical training in a tropical environment. All participants and their parents or guardians provided written informed assent and consent, respectively, and the study was approved by the University of Hawaii Institutional Review Board/Committee on Human Studies.
Table 1.
Participant Demographics (N = 36)
Procedures
Familiarization Session
Before the investigation, participants and their parents or guardians attended a 30-minute familiarization session. During this session, the purpose of the study was explained, all instruments used throughout the study were described, and a brief explanation of the procedures was provided. Participants completed the health and injury history questionnaires, the heat illness risk assessment questionnaire, and assent forms at this time; parents or guardians completed the consent forms. They were instructed to arrive 30 minutes before practice, to bring a towel, and to plan to stay 30 minutes after practice for data collection.
Control Period
The CP was used to establish the hydration behaviors of the participants. Individual sweat rates were established during this period to determine the approximate amount of fluid each participant should consume during subsequent periods. Sweat rate was the average sweat rate for the 3 practices during this period calculated for each participant. No attempt was made to control or influence hydration behaviors of participants or the number of water breaks allowed by the coaches.
Educational Intervention Period
After the CP, the EI period consisted of a presentation followed by a week of observation (Figure 1). On the last day of the CP after postpractice data collection, the EI was presented to the parents or guardians, coaches, and players of the volleyball program during a 30-minute meeting. The EI consisted of a computer-generated slideshow presentation of 13 slides and an informational handout. The information was adapted for participants in grades 8 through 12 from the Inter-Association Task Force on Exertional Heat Illnesses Consensus Statement13 and was reviewed by 4 athletic trainers (M.A.C., D.W., J.J.W., C.S.), including 1 (M.A.C.) with expertise in exertional heat illnesses. Participants and parents received the handout, “Parents' and Coaches' Guide to Dehydration and other Heat Illnesses in Children,”14 at the end of the presentation and a copy of the presentation slides. The EI provided information about preventing dehydration before, during, and after exercise; recognizing basic signs and symptoms of dehydration; and using Ucol as a self-monitoring tool. Fluid choices that should be avoided to assist in proper hydration also were presented. The advantage of rehydration using glucose-electrolyte solutions over consuming plain water was not stressed. The week after the EI presentation, data were collected, and participants consumed fluid ad libitum when given water breaks by their coaches.
Prescribed Hydration Intervention Period
We observed participants for 1 week after the EI and then provided the PHI (Figure 1). The PHI consisted of prescribing proper hydration volume based on individual sweat rates for the participants as described in the NATA's position statement on fluid replacement for athletes.9 Participants were required to drink a volume of water provided in paper cups based on individually calculated sweat rates. During the PHI, we mandated 6 water breaks, with 1 every 20 minutes during the 2-hour practice session. If an athlete desired fluid exceeding the prescribed amount, she consumed more fluid from her water bottle, and the additional Fvol was quantified by the change in weight of the bottle.
Observational Follow-Up Period
To determine if the previous interventions resulted in changes in hydration status, the participants were monitored for 3 more practice sessions. During the OF-U, we made no attempt to influence the behavior of participants or coaches. Participants consumed fluid ad libitum, taking drink breaks at the discretion of the coaches.
Prepractice Data Collection
Hydration status was assessed via BM, Usg, Ucol, and Uosm measurements, which were collected before each practice session throughout the 4 weeks of the investigation. Data were not collected during game competition. Participants were instructed to void their bladders fully and to provide midstream urine samples for urinalysis. Next, they were weighed in medical gowns before they changed into their practice attire. Body mass was measured to the nearest 0.1 kg using a digital scale (model PS-6600 ST; Befour, Inc, Saukville, WI). The urine samples were used to establish prepractice values for Usg, Ucol, and Uosm. In addition, the volume of fluid in each participant's water bottle was weighed to the nearest 0.001 kg on a digital scale (model PS4; Detecto, Webb City, MO), and fluid type was classified according to major components of the rehydration beverage.
During-Practice Data Collection
Practice consisted of typical volleyball activities in a non–air-conditioned gymnasium during a competitive season in a tropical environment from April through June. Participants performed regular activities associated with volleyball practice for approximately 2 hours. The actual volume of fluid consumed during each practice was determined by weighing beverage containers at the beginning and end of each session. We did not limit fluid type and volumes during the study, allowing participants to consume fluid ad libitum during water breaks (except during the PHI period). Participants were instructed not to share fluids, pour the fluid on themselves, or consume food during practice sessions. If participants needed to refill their water bottles during practice, they were instructed to permit the investigator (D.W.) to refill their bottles, allowing for determination of the additional volume. The examiner was to be informed if the participants needed to urinate during practice, and the Uvol was collected and recorded. The examiner was present for observation throughout all practice sessions.
Postpractice Data Collection
Participants remained for 30 minutes after the end of each practice for data collection. Immediately after practice, participants were instructed to towel dry sweat from their skin and hair; change into the same medical gowns; and refrain from voiding until BM was determined, at which time a urine sample was collected. Participants subsequently were instructed to complete the ESQ. Hypohydration was indicated by a decrease in BM of 2% or more, which has been shown to impair performance in skill sports similar to volleyball.15
Urine Analysis
Urine concentration was determined using a standard Ucol chart,10 with values greater than 4 indicating hypohydration, and Usg was determined using a clinical refractometer (model 300 CL; Atago Company Ltd, Tokyo, Japan), with values equal to or greater than 1.020 indicating hypohydration. We measured Uosm with an osmometer (model 3300; Advanced Instruments, Inc, Norwood, MA) immediately after practice, with values greater than 700 mOsm/L indicating mild hypohydration.
Sweat Rate
The following formula was used to calculate sweat rate using ΔBM, Fvol, and Uvol9:
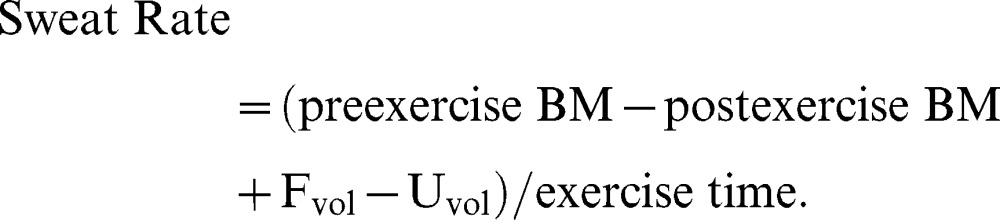 |
The height and BM of participants were used to determine the body surface area (BSA) and BMI. The following equations were used to determine BSA-to-mass ratio, where BM is in kilograms and the height (Ht) is in centimeters:16
Perceptual Measures
The ESQ was used to assess participants' perceptions of symptoms related to heat illness after practice. This instrument has been validated and demonstrated to have high reliability in documenting the symptoms of heat exposure.11 Versions of the ESQ have been administered and used during a recent study involving adolescents in summer camps to determine incidence and degree of common signs and symptoms related to exercising in the heat and dehydration.6,7
Environmental Monitoring
Ambient temperature using the WBGTi was recorded 15 minutes after practice began and 15 minutes before practice ended using a digital temperature and humidity monitor (QUESTemp° 32; Quest Technologies, Oconomowoc, WI). The wet bulb and globe thermometers allow for the determination of indoor environmental conditions by using the following equation: WBGTi = 0.7 (wet bulb) + 0.3 (globe).17 The instrument was placed in a central location in the gymnasium, kept out of direct sunlight and away from doorways, and allowed to stabilize for an accurate reading of the participants' practice environment.
Statistical Analysis
We used a 2 (prepractice, postpractice) × 4 (period) analysis of variance (ANOVA) with repeated measures to analyze the dependent measures over time and a 1-way repeated-measures ANOVA for the Δ scores. A Tukey LSD post hoc test with Bonferroni corrections was used to determine where differences existed if a main effect was found. To evaluate the percentage of participants reporting or leaving practice in a hypohydrated condition, χ2 analyses were conducted with the expected value of 50% of participants being hypohydrated, which is similar to values recently reported by Armstrong et al.18 Pearson product moment correlations were used to describe the relationships between perceptual measures and environmental conditions. Descriptive statistics were generated for the dependent variables and the environmental measures. Data were analyzed using the PASW statistical package (version 18.0 for Windows; IBM SPSS, Armonk, NJ). Chi-square analyses were conducted using Excel 2000 (Microsoft, Inc, Redmond, WA). The α level was set at .05 for all analyses.
RESULTS
Hydration Status
The 2-way, repeated-measures ANOVA of the BM data revealed an interaction between prepractice and postpractice across period (F1,3 = 6.220, P = .001; Figure 2); however, our post hoc testing with Bonferroni corrections did not identify the locus of the effects (P > .05). The 1-way ANOVA showed that the ΔBM from prepractice to postpractice was less for the PHI period (ΔBM = +0.05 ± 0.9 kg, %BML = +0.04 ± 1.3%) than the OF-U period (ΔBM = −0.7 ± 1.1 kg, %BML = −1.2 ± 1.9%; F1,3 = 6.220, P = .01; Table 2). In addition, the Fvol (Fvol = 1.3 ± 0.4 L) and percentage of fluid consumed to restore sweat loss (143.7 ± 110.8%) were higher for the PHI period than any other period (F1,3 = 34.869, P ≤ .001; Table 2). No differences in sweat rate were found among periods (F1,3 = 0.734, P = .53, power = 1.00; Table 2).
Figure 2.
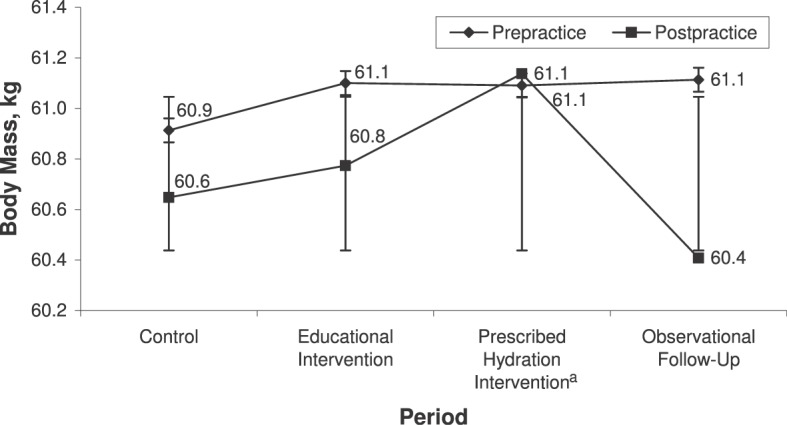
Change in body mass from prepractice to postpractice during 4 observation periods (n = 36). a Indicates change in body mass from prepractice to postpractice was less than for the observational follow-up period (P = .01).
Table 2.
Change in Body Mass From Prepractice to Postpractice and Sweat Rate (Mean ± SD) During 4 Observation Periods (N = 36)

The 2-way, repeated-measures ANOVA of the Uosm data revealed an interaction effect (F1,3 = 3.439, P = .02; Table 3). All postpractice Uosm measurements were higher than prepractice Uosm (P < .001). In addition, Uosm for the EI period was higher than for any other period (P < .05). Change in Uosm for the OF-U period (ΔUosm = 45 ± 23 mOsm/L) was less than for the CP and EI period (F1,3 = 3.439, P = .02; Table 3). The 2-way, repeated-measures ANOVA demonstrated that Usg was higher for all postpractice than prepractice Usg measurements (F1,3 = 26.114, P ≤ .001; Table 3). In addition, the Usg for the OF-U period was lower than for the CP and EI period (P < .05). Although not different, the PHI period had a greater change in Usg from prepractice to postpractice (0.005 ± 0.013 µg/L) than all other periods (P = .23, power = 0.999). The 2-way, repeated-measures ANOVA on the Ucol data revealed an interaction between prepractice and postpractice across period (F1,3 = 2.868, P = .04; Table 3); however, our post hoc testing with Bonferroni corrections did not identify the locus of the effects (P > .05). The post hoc data analysis showed that Ucol was higher for all postpractice than prepractice Ucol measurements (P ≤ .001). The 1-way ANOVA indicated a difference in change in Ucol between periods (F1,3 = 2.868, P = .04); however, again the post hoc test did not reveal the locus of the effects (P > .05).
Table 3.
Urine Values Prepractice and Postpractice During 4 Observation Periods (N = 36)a (Mean ± SD)

The χ2 analysis demonstrated that, according to %BML, the frequency of hypohydrated participants leaving practice was less than expected (50% hypohydrated; χ21 range, 25.00–36.00; P ≤ .05; Table 4). For Uosm, the number of participants who were hypohydrated prepractice for the OF-U was less than expected, and the number of participants who were hypohydrated postpractice for the EI period was more than expected (χ21 range, 5.44–16.00; P ≤ .05). For Usg, the number of participants who were hypohydrated prepractice for all periods except for the EI period postpractice was less than expected (χ21 range, 4.00–32.11; P ≤ .05). For Ucol, the number of participants who were hypohydrated postpractice was more than expected for all periods (χ21 range, 9.00–21.778; P ≤ .05).
Table 4.
Percentage of Hypohydrateda Participants, χ2, and Prepractice and Postpractice Urine Values During 4 Observation Periods (N = 36) (Mean ± SD)

Environmental Conditions
The mean WBGTi during practice for all practice sessions was 24.1 ± 0.2°C (Figure 3). Environmental conditions were relatively stable, but WBGTi was higher during the first 15 minutes of practice (24.2 ± 0.2°C; range, 21.5 to −26.4°C) than the last 15 minutes of practice (24.1 ± 0.2°C; range, 21.2–26.7°C; F1,11 = 5.782, P = .04). The WBGTi was higher during the last OF-U period than all other periods (P < .05). All practices occurred under red-flag conditions as described in the NATA's position statement on exertional heat illness.17
Figure 3.
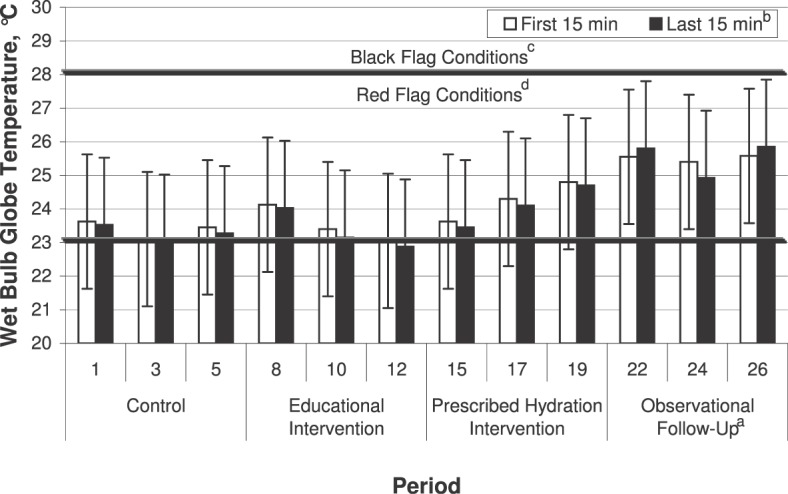
Indoor wet bulb globe temperature (WBGTi) during the first 15 minutes and last 15 minutes of practices during 4 observation periods. a Indicates higher than all other periods (P < .05). b Indicates lower than first 15 minutes (P = .04). c Indicates wet bulb globe temperature ranged from greater than 23°C to 28°C (>73–82°F). d Indicates wet bulb globe temperature was greater than 28°C (>82°F).
Perceptual Measures
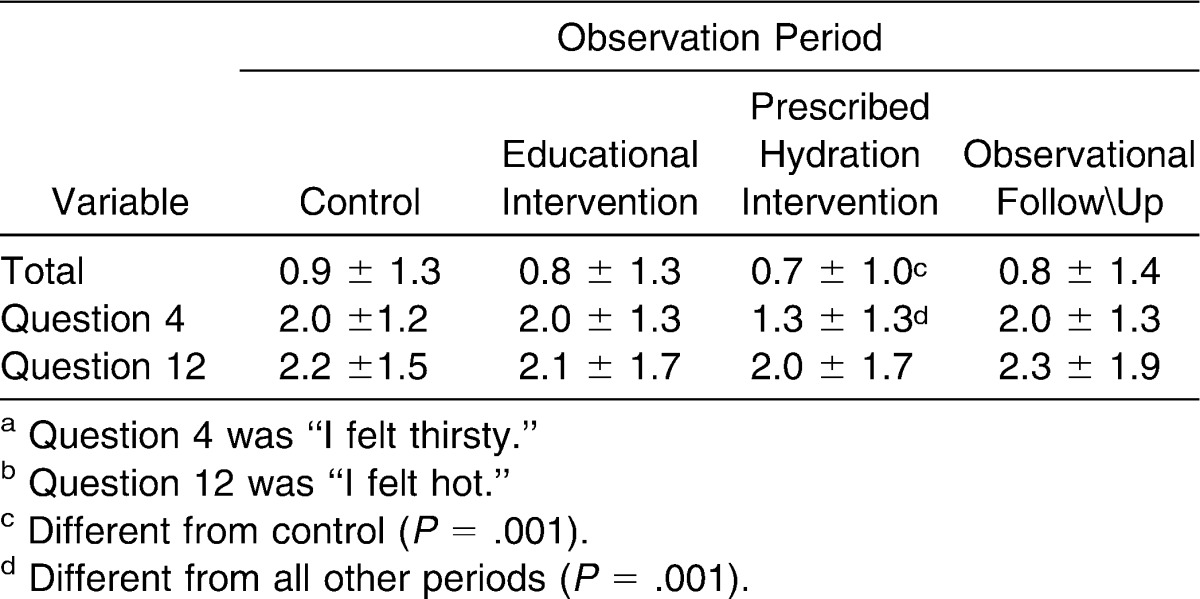
The mean postpractice scores for the ESQ and scores for 2 specific questions (“I felt hot” and “I was thirsty”) are reported in Table 5. No relationships were found for WBGTi and the “I felt hot” scores (r = 0.10, P > .05) or “I felt thirsty” (r = 0.12, P > .05) questions. The ESQ data from the PHI period show that the participants felt less thirsty when required water breaks were mandated and minimum Fvol replacement was mandated (P ≤ .001; Table 5).
Table 5.
Sample Environmental Symptoms Questionnaire Scores for Total, Question 4,a and Question 12b During the 4 Observation Periods (N = 36) (Mean ± SD)
DISCUSSION
A major finding of our study was that education alone was not successful in changing hydration behaviors of adolescent female athletes. This finding was based on an increase in prepractice Uosm during the observation period after EI compared with the CP. According to the NATA's position statement on exertional heat illness, educating athletes about proper hydration will decrease the risk of heat-related illness.17 In contrast, our findings agree with those of previous investigators who have reported that an EI does not guarantee positive changes in behavior or improvement of hydration status.6,7 However, our results were similar to those reported by Stover et al,8 who found that prescribing hydration improved hydration status for adolescent athletes exercising in warm, humid environments.
During our study, environmental conditions never reached the black condition (WBGT ≥ 28°C [82°F]) as defined in the NATA's position statement on exertional heat illness17 (Figure 2). However, although practices were conducted indoors, WBGTi consistently was in the red condition (WBGTi = 23–28°C [73–82°F]), which is considered high risk for exertional heat illness conditions and never decreased to yellow (moderate-risk) or green (low-risk) conditions. General guidelines during black and red environmental conditions include a work-to-rest ratio of 1∶1 and of 2∶1 with water and rest breaks every 15 to 20 minutes, respectively.17 Despite red environmental conditions, we did not interfere with or modify the water and rest breaks during the CP, EI, and OF-U periods. Our role was limited to observation and data collection.
Urine osmolality results (≥700 mOsm/L) implied that the percentage of athletes reporting to practice dehydrated ranged from 32% to 64% during the various periods (Table 4). Investigators also have reported large numbers of athletes reporting to practice hypohydrated based on Usg or Uosm.6,7,15 Hypohydration was a concern because the average athlete drinks less than the Fvol recommended by the NATA9 to achieve euhydration prepractice when allowed to drink ad libitum. Mild hypohydration was observed during the EI period when participants reported to practice with a higher mean Uosm (731 ± 153 mOsm/L) and finished practice with a Uosm that was higher than all other periods (P ≤ .05; Table 3). Interestingly, data collected during the OF-U period indicated a lower percentage of athletes reporting to practice hypohydrated (32%, n = 11; Table 4). However, we did find that the PHI alone or in combination with the EI resulted in the OF-U period having the lowest prepractice Uosm and a reduction from prepractice to postpractice (P ≤ .05; Table 3).
A combination of measurements, including percentage ΔBM and urine concentration indices determined from prepractice and postpractice samples, were used to assess changes in hydration status during a single practice session. Changes in BM during exercise as measured in our study assessed the relative change in hydration status from the beginning to the end of exercise. This change might not have been related to participants' hydration status at the beginning of practice. If ΔBM was the only criterion used to identify hypohydration (Table 2), the participants would appear to be hypohydrated only slightly by the end of practice, with a mean ΔBM of less than 1% (range, −0.3 to −0.7 kg) in all periods except the PHI period. During the PHI period, the participants gained an average of 0.04% (0.05 ± 0.9 kg), which was different from the OF-U period (P = .01). If only ΔBM was used to determine hydration levels, the participants would appear to be consuming enough fluid to adequately prevent further dehydration. Therefore, the use of ΔBM alone should be limited to determining changes in acute hydration during practice and should not be used as an indication of the athlete's actual hydration status. In our study, a large percentage (range, 25%–58%) of the participants reported to the CP, EI, and PHI practice sessions in a hypohydrated condition based on urinalysis. Subsequent changes in BM were not indicative of overall hydration status, as urine values indicated mild hypohydration based on criteria from the NATA's position statement on fluid replacement.9
During the PHI period, participants consumed a greater Fvol than during any other period and maintained BM with a commensurate decrease in Uosm. This was the only period studied in which the Uosm decreased after practice. Participants achieved the highest sweat rate during the PHI period and still were able to consume adequate fluid to maintain BM. The increased sweat rate is a positive change, which should assist in thermoregulation, and was most likely a result of the greater Fvol consumed during this period because environmental conditions were not different among trials. We found that when hydration volume was prescribed and water breaks were mandatory, participants consumed 50% more fluid and 43% more than what was prescribed (Table 2). In addition, this was the only period in which participants maintained their BM (within 0.05% of prepractice BM). The PHI was the only period in which participants met the NATA's9 recommendations to consume enough fluids to maintain BM during exercise. We speculate that during the PHI, participants became more aware of their fluid needs, focused their efforts on consuming enough fluids to match their fluid losses, and had ample time to rehydrate during the mandatory water breaks. The PHI period served as an experiential learning opportunity in which the participants learned more about their fluid needs. Because the participants had arrived hypohydrated, they might have used the mandatory breaks to consume adequate fluids to establish euhydration. Of course, athletes should be advised to match their fluid consumption with sweat losses and to avoid overhydration.
To our knowledge, sweat rates for adolescent girls have not been reported. Mean sweat rates in our study were 0.6 L/h across periods, which were in line with those found in previous investigations of younger boys and girls exercising in an environmental chamber19 and during a summer football camp.6 Similar sweat rates were reported for treadmill and cycle exercise in a heated chamber for preadolescent boys and girls aged 12 to 13 years (approximately 0.7 L/h).19 Sweat rates calculated in the field for youth football players during practice were similar and averaged about 0.6 L/h but increased to about 1.3 L/h during games.6 These authors speculated that possible explanations for the increased sweat rates during games when compared with practices include self-selected increased intensity of exercise, lack of focus on hydration, and increased work-to-rest ratio.6 Unfortunately, we did not collect data during games; however, these reported increased sweat rates during games compared with practice raise the question of the applicability of using practice sweat rates for individualized hydration protocols during games.
The ESQ has been used in previous investigations to determine the prevalence of heat-related illness symptoms during summer sports camps for adolescent athletes.6,7 In those studies,6,7 no differences were reported among days for ESQ (5.2 ± 4.3). We used the ESQ to assess participants' perceptions of symptoms related to heat illness after practice. The responses to the ESQ resulted in only weak relationships between feeling hot or thirsty and environmental conditions. The total scores on the ESQ were low, indicating that either participants perceived few or no symptoms related to heat illness after practice or the scale was not sensitive enough to detect changes. We attribute the lack of perception of heat illness symptoms to the acclimatized status of our participants, who had been living and training in a tropical climate for at least 3 months before their participation. However, although urine values indicated that hypohydration commonly occurred, the Fvol consumed was adequate to prevent symptoms of heat-related illness during the study because none of our participants reported symptoms.
Limitations
Our study had limitations. The interventions were not randomized, and the study design did not allow us to control for menstrual cycle. We did not document the number or note the timing of water breaks other than during the PHI period. However, based on observations made during each practice session, we are confident that the only period during which the participants were given water breaks consistent with recommendations of the NATA was the PHI period.
Another limitation of our study was that we did not focus on education for the coaching staff concerning proper number of water breaks or appropriate work-to-rest ratios based on the environmental conditions. Although the coaches were present during the EI, the information was directed toward the players rather than them. Our findings suggest that the athletes did ascertain the importance of proper hydration based on fewer participants reporting to the OF-U practices with urine indices suggesting hypohydration. However, after the PHI period, the coaches appeared to revert to their previous routine of providing fewer water breaks. We speculate that the number of water breaks allowed by the coaching staff affected the Fvol consumed by the athletes in the OF-U period. Thus, educating and changing behaviors of coaches might be as beneficial in preventing hypohydration as educating the athletes. We observed all practices and noted that, except for the PHI period, the coaches did not have a schedule for water breaks during practice; rather, they allowed water breaks when convenient. Coaches did not give water breaks every 20 minutes during red conditions in compliance with NATA's recommendations17 during any period except the PHI period. Although participants arrived at the OF-U period practices well hydrated (Uosm = 639 ± 25 mOsm/L, Usg = 1.015 ± 0.001 µg/L, Ucol = 4.0 shades), they had the greatest ΔBM (−1.2%) during this period. However, urinalysis data suggested that fewer participants were hypohydrated prepractice during the OF-U period, and a smaller percentage of participants was mildly hypohydrated postpractice during this period. We attribute this finding to the positive combined effects of the interventions in assisting the adolescents to improve hydration outside of practice coupled with a concurrent reduction in water breaks allowed by the coaches during practices. Therefore, although the coaches attended the EI, changes in their behaviors were not evident during the OF-U period, during which the percentage of Fvol consumed was the lowest of the 4 periods (77.7%).
We conducted a 1-time EI that might have had a limited effect on changing hydration behaviors in adolescent girls and did not attempt to determine baseline hydration knowledge of the athletes or coaches. A suggestion for future research is to ascertain the changes in behaviors and hydration knowledge after repeated interventions for both athletes and coaches.
Clinical Applications
We have arrived at several clinical applications based on the results of our study. A 1-time education session alone did not result in changes in hydration status of these athletes. Although ΔBM is a recommended method of assessing fluid loss during exercise, the high percentage of athletes reporting to practice hypohydrated in the PHI and OF-U periods as determined by urine indices suggests that overall hydration status prepractice should be confirmed through urinalysis. Prescribed drinking volumes should be based on individual sweat rates for a representative range of environmental conditions, practices, and games as recommended by the NATA.17 Coaches should be taught why and how to schedule appropriate water and rest periods during red conditions.
REFERENCES
- 1.American College of Sports Medicine. Armstrong LE, Casa DJ, et al. American College of Sports Medicine position stand: exertional heat illness during training and competition. Med Sci Sports Exerc. 2007;39(3):556–572. doi: 10.1249/MSS.0b013e31802fa199. [DOI] [PubMed] [Google Scholar]
- 2.Bar-Or O, Dotan R, Inbar O, Rotshtein A, Zonder H. Voluntary hypohydration in 10- to 12-year-old boys. J Appl Physiol. 1980;48(1):104–108. doi: 10.1152/jappl.1980.48.1.104. [DOI] [PubMed] [Google Scholar]
- 3.Armstrong LE, Hubbard RW, Szlyk PC, Matthew WT, Sils IV. Voluntary dehydration and electrolyte losses during prolonged exercise in the heat. Aviat Space Environ Med. 1985;56(8):765–770. [PubMed] [Google Scholar]
- 4.Rivera-Brown AM, Ramirez-Marrero FA, Wilk B, Bar-Or O. Voluntary drinking and hydration in trained, heat-acclimatized girls exercising in a hot and humid climate. Eur J Appl Physiol. 2008;103(1):109–116. doi: 10.1007/s00421-008-0682-1. [DOI] [PubMed] [Google Scholar]
- 5.Wilk B, Bar-Or O. Effect of drink flavor and NaCl on voluntary drinking and hydration in boys exercising in the heat. J Appl Physiol. 1996;80(4):1112–1117. doi: 10.1152/jappl.1996.80.4.1112. [DOI] [PubMed] [Google Scholar]
- 6.McDermott BP, Casa DJ, Yeargin SW, Ganio MS, Lopez RM, Mooradian EA. Hydration status, sweat rates, and rehydration education of youth football campers. J Sport Rehabil. 2009;18(4):535–552. doi: 10.1123/jsr.18.4.535. [DOI] [PubMed] [Google Scholar]
- 7.Decher NR, Casa DJ, Yeargin SW, et al. Hydration status, knowledge, and behavior in youths at summer sports camps. Int J Sports Physiol Perform. 2008;3(3):262–278. doi: 10.1123/ijspp.3.3.262. [DOI] [PubMed] [Google Scholar]
- 8.Stover EA, Zachwieja J, Stofan J, Murray R, Horswill CA. Consistently high urine specific gravity in adolescent American football players and the impact of an acute drinking strategy. Int J Sports Med. 2006;27(4):330–335. doi: 10.1055/s-2005-865667. [DOI] [PubMed] [Google Scholar]
- 9.Casa DJ, Armstrong LE, Hillman SK, et al. National Athletic Trainers' Association position statement: fluid replacement for athletes. J Athl Train. 2000;35(2):212–224. [PMC free article] [PubMed] [Google Scholar]
- 10.Armstrong LE, Soto JA, Hacker FT, Jr, Casa DJ, Kavouras SA, Maresh CM. Urinary indices during dehydration, exercise, and rehydration. Int J Sport Nutr. 1998;8(4):345–355. doi: 10.1123/ijsn.8.4.345. [DOI] [PubMed] [Google Scholar]
- 11.Sampson JB, Kobrick JL. The environmental symptoms questionnaire: revisions and new filed data. Aviat Space Environ Med. 1980;51(9 pt 1):872–877. [PubMed] [Google Scholar]
- 12.Eberman LE, Cleary MA. Validation of the Heat Illness Index Score Risk Assessment [abstract] J Athl Train. 2007;40(suppl):S52. [Google Scholar]
- 13.Casa DJ, Almquist J, Anderson S, et al. Inter-Association Task Force on Exertional Heat Illnesses consensus statement. NATA News. June 2003;6:24–29. [Google Scholar]
- 14.Casa DJ, Almquist J, Anderson S, et al. Parents' and coaches' guide to dehydration and other heat illnesses in children. http://www.nata.org/sites/default/files/Heat-Illness-Parent-Coach-Guide.pdf. Published June 2003. Accessed December 27, 2011. [Google Scholar]
- 15.Osterberg KL, Horswill CA, Baker LB. Pregame urine specific gravity and fluid intake by National Basketball Association players during competition. J Athl Train. 2009;44(1):53–57. doi: 10.4085/1062-6050-44.1.53. [DOI] [PMC free article] [PubMed] [Google Scholar]
- 16.Kouno T, Katsumata N, Mukai H, Ando M, Watanabe T. Standardization of the body surface area (BSA) formula to calculate the dose of anticancer agents in Japan. Jpn J Clin Oncol. 2003;33(6):309–313. doi: 10.1093/jjco/hyg062. [DOI] [PubMed] [Google Scholar]
- 17.Binkley HM, Beckett J, Casa DJ, Kleiner DM, Plummer PE. National Athletic Trainers' Association position statement: exertional heat illnesses. J Athl Train. 2002;37(3):329–343. [PMC free article] [PubMed] [Google Scholar]
- 18.Armstrong LE, Pumerantz AC, Fiala KA, et al. Human hydration indices: acute and longitudinal reference values. Int J Sport Nutr Exerc Metab. 2010;20(2):145–153. doi: 10.1123/ijsnem.20.2.145. [DOI] [PubMed] [Google Scholar]
- 19.Bergeron MF, Laird MD, Marinik EL, Brenner JS, Waller JL. Repeated-bout exercise in the heat in young athletes: physiological strain and perceptual responses. J Appl Physiol. 2009;106(2):476–485. doi: 10.1152/japplphysiol.00122.2008. [DOI] [PubMed] [Google Scholar]