

Abstract
Background
Advantages offered by canine population substructure, combined with clinical presentations similar to human disorders, makes the dog an attractive system for studies of cancer genetics. Cancers that have been difficult to study in human families or populations are of particular interest. Histiocytic sarcoma is a rare and poorly understood neoplasm in humans that occurs in 15–25% of Bernese Mountain Dogs (BMD).
Methods
Genomic DNA was collected from affected and unaffected BMD in North America (NA) and Europe. Both independent and combined genome wide association studies (GWAS) were used to identify cancer-associated loci. Fine mapping and sequencing narrowed the primary locus to a single gene region.
Results
Both populations shared the same primary locus, which features a single haplotype spanning MTAP and part of CDKN2A and is present in 96% of affected BMD. The haplotype is within the region homologous to human chromosome 9p21, which has been implicated in several types of cancer.
Conclusions
We present the first GWAS for HS in any species. The data identify an associated haplotype in the highly cited tumor suppressor locus near CDKN2A. These data demonstrate the power of studying distinctive malignancies in highly predisposed dog breeds.
Impact
Here, we establish a naturally-occurring model of cancer susceptibility due to CDKN2 dysregulation, thus providing insight regarding this cancer-associated, complex, and poorly understood genomic region.
Keywords: Genome Wide Association Study, Dogs, p16, Cancer, Histiocytic sarcoma
Introduction
Although many genes have been associated with rare, high-penetrance cancer syndromes in humans, such syndromes account for only a fraction of familial cancer risk (1). A recent explosion of genome wide association studies (GWAS) has identified several putative cancer-associated risk alleles, many of which are located near known cancer genes, although not within classic exonic boundaries (reviewed in:(2)). These non-coding, low-penetrance, cancer-susceptibility alleles likely contribute to quantitative changes in gene expression and, as such, are difficult to find.
Dogs are particularly well-suited to studies of malignancy (3) as cancer is the most frequent cause of disease-associated death in dogs, and naturally occurring, cancers are well-described in several breeds (4, 5). The high incidence of breed-specific cancers offers opportunities to identify sequence variants leading to disease susceptibility that have been difficult to find in humans. Application of the canine system is particularly efficacious when multiple closely related breeds or pure breeding populations of the same breed exist, each with predisposition to the same disease and as such, are likely to segregate the same founder mutation (6, 7), (8).
Histiocytic sarcoma (HS) is a highly aggressive and lethal dendritic cell neoplasm that occurs in 15–25% of BMD (9–12). Localized HS most commonly develops in the skin or subcutis of an extremity. The tumor is locally invasive with metastasis to lymph nodes and/or blood vessels. Disseminated HS is a multi-system disease with tumors appearing in numerous organs including the spleen, liver and lungs. Progression to death is rapid (12). Almost no information is known about the genetic underpinnings HS in humans or animals (13), largely due to the lack of a well-characterized biological system for study. In this paper we summarize findings from two independent histiocytic sarcoma GWAS in BMDs, offering insights into this poorly understood class of neoplasms as well as establishing a foundation for future studies of histiocytoses in humans.
Materials and Methods
Sample collection
All dog owners provided informed consent consistent with Animal Care and Use Committees at their collecting institution. DNA was isolated from 475 BMD blood samples. Two hundred forty, 95 and 140 were provided from NA, France and The Netherlands, respectively. All dogs with available pedigree data were unrelated at the grandparent level. For detailed collection information see Supplemental Materials S1. Whole blood was collected with either EDTA or ACD anticoagulant. In NA and The Netherlands, genomic DNA was isolated using a standard phenol-chloroform protocol (14). In France the Nucleon BACC Genomic DNA Extraction Kit was used (GE Healthcare, Piscataway, NJ). All samples were stripped of identifiers, numerically coded, and aliquoted for long-term storage at −80°C.
Genotyping and PCA
Samples were genotyped using the Canine SNP20 Beadchip panel (Illumina, San Diego, CA) which included ~22,000 SNPs. After removing SNPs with a minor allele frequency <0.01 and genotyping rate <80%, 17,218 SNPs remained. The final data set included 114 and 120 case and control dogs, respectively, from North America (NA), and 128 and 112, respectively from Europe. More than 96% of European dogs came from France and The Netherlands. Two rounds of principal components analysis (PCA) were performed on the dataset using EIGENSTRAT (15). The first removed genetic outliers and the second determined the amount of stratification within the dataset. Eight dogs were removed because they were >6 standard deviations from the average across the top 10 PCs. The remaining 466 dogs (228 NA and 238 European) were clustered according to the top 10 PCs. The process was repeated in the NA and the European samples independently, and two additional outliers were removed. Fst values and inbreeding coefficients were calculated by continents, countries, and case/control status. The complete dataset of genotypes and phenotypes is available by request sent to dog_genome@mail.nih.gov.
GWAS analyses
In the first of two GWAS, 111 case and 117 control BMD from NA were analyzed using PLINK v1.07 (16). Standard χ2 values of association were calculated (17). Spurious missing data was imputed using BEAGLE and the analysis repeated, correcting for multiple testing with 10,000 permutations using PRESTO (18, 19). The data were analyzed using EMMA to correct for stratification and cryptic relatedness (20).
In the second GWAS, 125 European cases and 111 controls were analyzed using the same methods. The two NA and European GWAS results were compared and the datasets combined. Association was calculated without correction in PLINK, stratified by continent and permuted 10,000 times in PRESTO, and corrected for population structure using an additive kinship matrix implemented by EMMA. Loci that were significantly associated with disease in both populations were considered further.
Fine mapping
A custom SNPlex genotyping assay was run on 175 case and 162 control BMDs from NA (213) and Europe (124) (Applied Biosystems, Foster City, CA). Selected SNPs spanned 9.7 Mb (chr11:39,072,460-48,846,456) and surrounded highly associated markers from the combined GWAS. After removing failed and uninformative SNPs, 229 remained (Supplemental Table S2).
Genotypes from SNPlex were imputed on all 466 dogs from the original GWAS using BEAGLE (18, 21). Because the datasets were divided by continent before imputation to account for differences in population structure, an additional 212 SNPs were added to the original GWAS data and association was calculated, as previously described. Phasing and association was performed using BEAGLE. Finally, the datasets were combined and association calculated with correction for population structure across the genome, including and excluding chromosome 11. Frequency of the associated haplotype was calculated in cases and controls from each population.
Sequencing
Amplicons were sequenced within a 300 kb region (chr11:44,001,369-44,331,631) that included the 198kb (chr11:44,133,881-44,331,630) associated haplotype and all predicted exons of CDKN2A, CDKN2B, and MTAP. Primers were designed using Primer3 v0.4.0 (22) (Supplemental Table S2). Segments were amplified from 24 case and 20 control NA BMD using standard protocols and sequenced using BigDye Terminator v3.1 on an ABI 3730xl DNA Analyzer (Applied Biosystems). Sequencing 306 amplicons revealed 133 SNPs. The complete sequence of the INK4A transcript and the genomic sequence of CDKN2A exon1a and promoter have been submitted to NCBI GenBank (accession numbers JN086563 and JN086564, respectively).
Sequences were analyzed using Phred/Phrap/Consed (23–25) with SNPs identified by Polyphred (26). BEAGLE was used to estimate haplotypes, impute genotypes, and calculate Fisher’s exact association for SNPs and haplotypes after 10,000 permutations (21, 27). The sequenced SNPs were imputed on the NA SNPlex dataset to calculate association. Markers with >25% missing data were removed prior to imputing. Pairwise LD and haplotype block analysis was performed using Haploview v4.1 (28).
To confirm the relative strength of SNP associations from imputed data, nine SNPs were genotyped in an additional 109 cases and 89 controls (Supplemental Table S3). Also, ten dogs from seven non-HS breeds were genotyped with the same SNPs.
Quantitative PCR in dendritic cells from healthy dogs
Four ml blood samples were obtained from 53 healthy BMD, randomly selected from ~500. Peripheral mononuclear cells (PBMC) were isolated, uniformly plated, and allowed to expand in the presence of IL-4 (50 ng/ml) and GM-CSF (33ng/ml) in order to select for dendritic precursor cells (29, 30). At 19 days, the cells were harvested and DNA/RNA were extracted using standard methods.
Samples were assigned haplotypes based on their genotypes at chr11:44,201,923 and 44,215,162. Pre-designed Taqman assays were obtained for the B2M (endogenous control) and MTAP genes while primers and probe were designed for CDKN2A and CDKN2B using Primer Express (Applied Biosystems). Real-time PCR was performed on 24 ng of cDNA for each assay using standard protocols. Each sample was run in triplicate and CT values averaged. Relative quantities of the transcripts and average fold change were calculated using the ΔCt method compared to an endogenous control and a reference tissue (testis) and then corrected for amplification efficiency (31, 32). Data was collected for six dogs homozygous for the CA haplotype, six heterozygous dogs, and five dogs lacking the CA haplotype. P-values were calculated for the differences in distributions of transcript quantities using both the two-tailed student’s t-test and the non-parametric Wilcoxon rank-sum test.
Results
Principal component analyses
PCA of the entire dataset of 474 dogs and 17,218 SNPs revealed significant stratification among the populations of BMD from NA and EU (Figure 1c). Plots of PCs 1 and 2 show separation of NA and EU populations (Figure 1a) while cases and controls are fully integrated (Figure 1b). Calculations of Fst averaged over all loci show that divergence between cases and controls is an order of magnitude lower than between geographic localities (average Fst=0.001 and 0.015, respectively). Overall, NA dogs demonstrated a higher level of inbreeding than either of the EU populations. However, none of the case groups were significantly more inbred than the controls (Supplemental Table S4).
Figure 1.
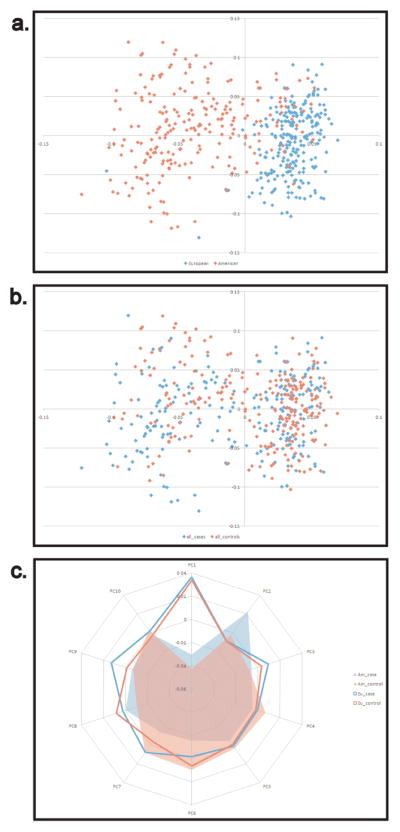
PCA of BMD populations from Europe and North America. PCs were calculated from whole genome SNP data in cases and controls from NA and Europe. a) Two distinct yet overlapping populations are identified when comparing North American (red) and European (blue) populations (Fst = 0.01). b) Cases and controls are distributed evenly throughout both populations (Fst=0.001). c) Only one of the top ten principal components differentiates cases from controls, all others divided the samples along continental lines. NA cases=red fill, NA controls=blue fill, European cases=red line, European controls=blue line.
Genome-wide association study
A GWAS was conducted using 111 affected (case) and 117 unaffected (control) BMD from NA revealing >20 markers within a single peak of association on CFA11 spanning ~9 Mb from 38.5–47.1 Mb (praw=1.41×10⁻⁹, pemp<1×10⁻⁴, 10k permutations) (Figure 2a). After correcting for population stratification and cryptic relatedness, the most associated marker was CFA11:47,179,346 (pcorrected=5.6×10⁻⁶).
Figure 2.

Genome wide analyses of HS in two populations of BMD identify an association on CFA11. The Y-axis indicates the negative log of the uncorrected p-value. The X- axis shows marker position from the top of CFA1 through CFAX. a) 240 U.S. BMD with maximum association at CFA11 bp 41,359,032, praw=1.41 × 10−09. b) 234 European BMD with two peaks of association, CFA11 bp 47,179,346, praw=1.50 × 10⁻⁶ and CFA14, praw=9.80 × 10⁻⁸. c) U.S. and European cohorts combined for a total of 474 dogs with maximum association at CFA11 bp 47,179,346, praw=1.11 × 10⁻¹³. Additional peaks found on chromosomes 2, 5 and 20 are reduced to background levels after correcting for population structure.
A second GWAS, performed using 125 case and 111 control European BMD, revealed HS loci on CFA11 at 47.1 Mb (praw=1.5×10⁻⁶, pemp=0.0064) and CFA14 from 10.9–14.0 Mb (praw=9.8×10⁻⁸,pemp=0.0003). After correction with EMMA, both loci remained significant (pcorrected=1.50×10⁻⁷ and pcorrected=6.59×10⁻⁶, respectively) (Figure 2b).
The datasets were combined and association analysis with correction for population structure revealed the same two loci as above (Figure 2c), however only the CFA11 locus was associated in both the individual and combined GWAS. The SNP at CFA11:47,179,346 had the strongest association with disease susceptibility by all methods with praw=1.11×10⁻¹¹, pemp<1.00×10⁻⁴, and pcorrected =1.76×10⁻⁸. Quantile-quantile plots, showing the distribution of p-values before and after population correction, are shown in Supplemental figure S5. The top ten associated SNPs from each dataset and analysis method are listed in Supplemental Table S6, followed by a list of possible candidate genes from the locus on CFA14 for future studies (Supplemental Table S7).
Fine mapping the CFA11 locus
To refine the locus on CFA11 we genotyped an additional 229 SNPs spanning 9.7 Mb (Supplemental Table S2) in 327 dogs from the combined BMD dataset and imputed the genotypes using all 468 dogs. In all populations two markers in complete LD with one another showed the highest association with pcorrected =4.15×10⁻¹², 3.15×10⁻⁸, and 9.90×10⁻²¹, in NA, EU, and the combined set, respectively (Supplemental Figure S8). These markers were located at 44,191,398 and 44,215,162 in the CanFam2 assembly.
Genotypes across the region were phased and multi-marker association computed. All dogs carrying the case-associated allele at position 44,191,398 carried an identical three SNP haplotype at positions 44,191,398, 44,215,162, and 44,254,083. The haplotype was common in BMD, however, and comprised 80% of case haplotypes in all populations, but ranged from 49% to 64% in controls (Table 1). Strikingly, 65% of cases were homozygous for the CA haplotype within each population, with >95% of cases carrying the CA haplotype on at least one chromosome. By comparison, only 18–39% of the controls were homozygous for the CA haplotype (Table 1).
Table 1.
Allele frequency of the haplotype associated with histiocytic sarcoma in the BMD.
| CA allele frequencya | % carrying CA allele | homo | hetero | absent | |
|---|---|---|---|---|---|
| All | |||||
| Cases | 80 | 96 | 65 | 31 | 4 |
| Controls | 54 | 84 | 24 | 60 | 16 |
| American | |||||
| Cases | 80 | 95 | 65 | 30 | 5 |
| Controls | 49 | 80 | 18 | 62 | 20 |
| European | |||||
| Cases | 81 | 96 | 65 | 31 | 4 |
| Controls | 59 | 88 | 30 | 58 | 12 |
| French | |||||
| Cases | 81 | 97 | 65 | 33 | 2 |
| Controls | 64 | 90 | 39 | 51 | 10 |
| Dutch | |||||
| Cases | 81 | 96 | 66 | 30 | 4 |
| Controls | 56 | 85 | 26 | 60 | 14 |
CA=case associated
These three SNPs define a 198kb region (44,133,881-44,331,630) that spans methylthioadenosine phosphorylase gene (MTAP), and the cyclin dependent kinase inhibitors 2A (CDKN2A), and 2B (CDKN2B).
Sequencing in NA BMD
We identified 139 informative SNPs by sequencing, including 115 within the 198 kb haplotype (Supplemental Table S2). Two coding mutations were found in CDKN2A; a silent mutation in exon 1a and a mutation in exon 2 that is silent in p14ARF but changes an asparagine to a histidine in p16 INK4a. The altered amino acid is not conserved across species and the SNP does not segregate with the disease (Fishers exact p=0.09893). A SNP 88 bases upstream of exon 1a, that is likely within the 5′UTR, showed an association with HS (Fishers exact p=1.09×10⁻⁶, pemp=0.00029). However, this SNP alone is unlikely to be causative as the associated allele was found in eight of ten dogs from breeds in which HS is rare (Supplemental Table S3).
Thirty SNPs spanning positions 44,191,314 - 44,293,447 were in complete LD with the two most highly associated SNPs from the combined GWAS (Figure 3b). The associated haplotype was reduced to 75,920 bases (44,177,956-44,253,875) including SNPs at positions 44,177,978-44,251,174 surrounding the MTAP gene and ending within intron 2 of CDKN2A. This haplotype is broken by a single SNP at position 44,232,491 that appears to have arisen on the CA haplotype. Haplotypes on either side of this SNP are nearly identical in frequency with only one dog out of 228 being a possible recombinant.
Figure 3.

A 75 kb region spanning the MTAP gene and continuing through the last exon of CDKN2A is highly associated with histiocytic sarcoma. A 195 kb region between CFA11 44,133,500 and 44,328,500 is shown. The X-axes for all plots list the SNPs in order from centromere to telomere. a) Positions of three genes are shown at the top of the graph. Exons are indicated as colored rectangles, introns are the connecting lines. Transcripts are indicated as arrows below gene names. Fisher’s exact association of allele frequency with HS is plotted along the Y-axis for each SNP. The gray line shows association in the discovery set of 24 cases and 20 controls with p-values on the right Y-axis. The black line shows association in the full dataset after imputation, with p-values on the left Y-axis. The red lines show association of the haplotypes across the region with the p-values in the left y-axis. b) Pairwise LD plot was calculated using Haploview. Solid red blocks indicate D′ =1 with a LOD score of 2. The haplotype block containing 28 of 30 equally associated SNPs is outlined in black. Another two SNPs form a short 3.4 kb haplotype in the CDKN2B region in perfect LD with the larger 75kb haplotype. Differences in p-values between the haplotypes are the result of a single crossover in a control dog.
More than 65kb of the 75kb haplotype have been sequenced in the discovery set. The remaining 10kb is divided among 25 loci ranging from <10 to nearly 2000 bps and is largely comprised of repetitive elements. Thus far, no single marker or combination of markers within the 75.9 kb haplotype conveyed significantly more risk than any other (Figure 3a). LD in dog breeds can be expansive, extending over one Mb at some loci (33, 34). Because of the near perfect LD found within this disease-associated region, and the lack of coding mutations, finding the causative mutation remains outside the scope of this paper. However, functional approaches can be applied to determine the most probable effect of the elusive mutation(s).
Correlation of haplotype with candidate gene expression
The disease-associated haplotype lies across MTAP and continues through the last exon of CDKN2A. We performed quantitative real time PCR across the region to determine if there were changes in transcript levels that correlated with the CA haplotype. Expression was measured on total RNA from histiocytes cultured from whole blood samples of healthy BMDs carrying zero, one, or two copies of the CA haplotype. No significant changes in MTAP expression were observed. However, individuals with two copies of the CA haplotype produced significantly higher amounts of both CDKN2A and CDKN2B transcripts, averaging 16 (p=.0173, Wilcoxon rank sum) and four times (p=0.00866) higher, respectively, compared to those lacking a CA haplotype (Table 2). Heterozygotes had approximately half the homozygote level of transcript, but the differences were not significant given the small sample sizes tested. These data suggest that there are variants within the CA haplotype that affect the expression of the CDKN2A and CDKN2B in HS susceptible dogs.
Table 2.
Expression levels of three genes surrounding the case-associated haplotype in healthy dogs showing all three genotypes.
| Genotypea | Amountb | Increasec | Pd | |
|---|---|---|---|---|
| CDKN2A | 2 | 0.002577 | 16.8988 | 0.0173 |
| 1 | 0.001334 | 8.7482 | >0.05 | |
| 0 | 0.000153 | 1 | ||
| CDKN2B | 2 | 0.000697 | 3.976 | 0.0087 |
| 1 | 0.000518 | 2.9567 | >0.05 | |
| 0 | 0.000175 | 1 | ||
| MTAP | 2 | 0.009758 | 1.2412 | >0.05 |
| 1 | 0.009028 | 1.1484 | >0.05 | |
| 0 | 0.007862 | 1 |
The genotype is the number of copies of the case associated (CA) haplotype with 2=homozygous for the CA haplotype, 1=heterozygous, and 0 = no copies of the CA haplotype.
The amount of transcript is relative to the amount of B2M transcript and normalized by comparison to expression in testes.
Increase in expression of each gene in individuals carrying the CA haplotype compared to those without.
p-values were calculated by Wilcoxon rank sum on the distribution of relative expression levels within each genotype group.
Discussion
Dissecting the genetic underpinnings of dendritic cell neoplasms presents unique challenges to canine and human researchers alike, due to confusion regarding the origin of these immune cell tumors. While human disorders, such as Langerhans cell histiocytosis, have been well characterized clinically, etiologies remain elusive. We hypothesized that identification of susceptibility loci in the BMD would likely reveal genes of interest for both canine and human disorders, thus leading to a better understanding of the genetic underpinnings of this complex family of neoplasms.
Our data set was comprised of dogs from one breed but two major geographic areas. Average Fst values show that these BMD populations differ at a level similar to human populations from unique European countries (35). This is an order of magnitude lower than differences found between breeds, yet significant to find global alterations in haplotype and allele frequencies (8, 36).
There is slightly higher population-wide heterozygosity in the NA BMD compared to European BMD; however, individuals are characterized by reduced heterozygosity. The effect of such population differences is apparent in a complex disorder such as HS. In the NA population, only one locus segregates with the disease. However, the European population shows at least two. The second European locus may not be important in the NA population, or the underlying mutation may be present at such a high frequency it is approaching fixation. A brief examination of markers across the region shows that all NA dogs share allele frequencies similar to the cases from Europe, supporting the latter alternative.
This GWAS study unambiguously localized the major HS locus to a 9.7 Mb region on CFA11. The advantages of genetic mapping in dogs, where loci are quickly identified with small numbers of samples, can be offset by the potentially difficult transition from disease-associated haplotype to causative mutation (37). We compared mapping results from two populations of the same breed to reduce LD. The European population showed overlapping association with the NA population in a relatively small region of <200 kb, compared to the ~10 Mb identified in the original GWAS. Extensive sequencing revealed a single 75 kb disease associated haplotype.
Over 85% of the CA haplotype has been sequenced. The majority of the unsequenced segments are within the large third intron of MTAP. Expression levels of the CDKN2 genes show a much greater range in cells from dogs carrying the CA haplotype (SD = 0.0052) compared to those with control haplotypes (SD = 8.5×10⁻⁵). It is formally possible that this is a consequence of small sample size, more likely it indicates that the causal variant is present on only a subset of CA haplotypes, and has yet to be discovered. The second explanation also accounts for the relatively high incidence of risk-associated haplotypes in unaffected dogs.
Expression analysis suggests that HS is caused by a regulatory mutation(s). Unfortunately, little is known about regulatory elements in the dog. However, we can compare the canine locus to the corresponding human region and predict regulatory potential. For example, based on ENCODE chromatin state predictions from human ChIP-seq data (build NCBI36/hg18) (38, 39, 40), there is a strong enhancer immediately downstream of MTAP. The homologous region in the dog contains at least one of the 28 highly associated HS SNPs, and a region containing a series of SINE elements and repeats that may be amenable to deletion, insertion or rearrangement in addition to base pair changes, providing an attractive site for further investigation. Another of the highly associated SNPs, at position 44,215,162, lies within a second predicted enhancer region.
Our data suggest that variants on a risk-associated haplotype surrounding MTAP and continuing through exon 3 of CDKN2A affect the expression of both CDKN2A and CDKN2B. All three of the proteins transcribed from the CDKN2 genes; p16INK4A, p14ARF, and p15INK4B have unique promoters, but share regulatory elements (reviewed in: (41)). Loss of the CDKN2A-CDKN2B region through mutation, deletion or silencing is among the most frequent alterations found in human cancers, including HS (42, 43). In addition, CGH analysis shows that a region of at least one Mb centered on the CDKN2 locus is lost in ~60% of HS tumors in BMD (44). Though unexpected, increased expression of p16INK4a and p14ARF has been noted in multiple cancers including prostate, ovarian, cervical and mammary (45–47) and is typically associated with poor prognosis (48–50). Studies have suggested that, in these neoplastic cells, p16 inhibits apoptosis, particularly in response to DNA damage. Further investigation of CDNK2 gene regulation in BMD with and without HS may better illuminate the roles of these common cancer-associated genes.
MTAP is important for the salvage of methionine and adenine, encoding an enzyme that plays a role in polyamine metabolism (51). Recently it has been suggested that MTAP may also be a tumor suppressor (52). In our study, variants within or near the MTAP gene are associated with altered expression of CDKN2A/CDKN2B, but not changes in MTAP expression. Thus, our data offer a new perspective on MTAP’s role in cancer. Specifically, mutations within MTAP likely lead to dysregulation of CDKN2A/B.
The established importance of the MTAP/CDKN2A/CDKN2B locus in multiple cancer types, in combination with our finding that naturally occurring sequence variants in BMDs are associated with expression changes in these genes, suggests that the CA haplotype could be relevant for susceptibility to multiple cancers. Some 16.9% of U.S. BMD reportedly die of HS-related causes (Figure 4). Since 38% of a random sample of U.S. BMD (n=53) were homozygous for the CA haplotype (Supplemental Table S9), we hypothesize that multiple types of BMD cancer may be related to variants within the MTAP-CDKN2A region. This concept mimics what has been observed at human chromosome region 9p21, which is associated with susceptibility to several types of human cancer as well as other complex disorders (53).
Figure 4.

Diagnoses for 3,785 BMD who have died since 1995 collected by the Berner Garde Foundation. Frequency was determined by dividing individual cancers by the total number of BMD deaths. “Histiocytosis” includes histiocytic sarcomas, malignant histiocytosis, reactive histiocytoses.
Here we present the first GWAS of HS in any species. Using a population-guided mapping approach, followed by sequencing, we have identified a 75.9 kb haplotype found in 96% of all HS affected dogs. This haplotype contains features that affect expression of the CDKN2A and CDKN2B genes, which may be a primary contributor to histiocytic sarcoma susceptibility in the BMD. The CA haplotype overlies the MTAP gene and likely contains one or more variants that alter the expression of INK4A/ARF/INK4B but do not affect MTAP expression. It is plausible that numerous cancers developed by BMD are associated with sequence variants in this region. These findings lead us to hypothesize that BMDs are an excellent system for the study of cancer susceptibility due to INK4A/ARF/INK4B dysregulation, allowing for systematic studies regarding the role of naturally occurring sequence variants in this increasingly important locus.
Supplementary Material
Acknowledgments
We thank the Berner Garde Foundation, Bernese Mountain Dog Club of America, French Association for Swiss dogs, and the Swiss, Italian, and Belgium Bernese Mountain Dog Associations for providing data and distributing information. We thank also the many breeders, owners, and clinicians who collected data and samples. We thank Dr. James Rocco for supplying biological reagents and Dr. Erik Teske for cytology review,
Grant Support
This work was supported by the Intramural Program of the National Human Genome Research Institute at NIH. Additional support was received from the AKC-Canine Health Foundation grants 2667 and 760 (M.B.), 336 and 935 (E.A.O. and C.A.); the CNRS and French Association for Swiss dogs (C.A.); NIH NCI R01 CA69069, NIH U01 AI07033, and the Harvard Breast Cancer SPORE P50 CA89393 (E.V.S.); the Alberto Vittoni Award (B.H., E.C. and G.R); the Committee of Preventive Health Care of the Netherlands Royal Society of Veterinary Medicine and the breed societies for Bernese mountain dogs in the Netherlands, Belgium, Germany and Austria (G.R.).
References
- 1.Bodmer W, Bonilla C. Common and rare variants in multifactorial susceptibility to common diseases. Nat Genet. 2008;40:695–701. doi: 10.1038/ng.f.136. [DOI] [PMC free article] [PubMed] [Google Scholar]
- 2.Ioannidis JP, Castaldi P, Evangelou E. A compendium of genome-wide associations for cancer: critical synopsis and reappraisal. J Natl Cancer Inst. 2010;102:846–58. doi: 10.1093/jnci/djq173. [DOI] [PMC free article] [PubMed] [Google Scholar]
- 3.Khanna C, Lindblad-Toh K, Vail D, London C, Bergman P, Bergman P, et al. The dog as a cancer model. Nat Biotech. 2006;24:1065–6. doi: 10.1038/nbt0906-1065b. [DOI] [PubMed] [Google Scholar]
- 4.Shearin AL, Ostrander EA. Leading the way: canine models of genomics and disease. Dis Model Mech. 2010;3:27–34. doi: 10.1242/dmm.004358. [DOI] [PMC free article] [PubMed] [Google Scholar]
- 5.Bronson RT. Variation in age at death of dogs of different sexes and breeds. Am J Vet Res. 1982;43:2057–9. [PubMed] [Google Scholar]
- 6.Karlsson EK, Baranowska I, Wade CM, Salmon Hillbertz NH, Zody MC, Anderson N, et al. Efficient mapping of mendelian traits in dogs through genome-wide association. Nat Genet. 2007;39:1321–8. doi: 10.1038/ng.2007.10. [DOI] [PubMed] [Google Scholar]
- 7.Parker HG, Kukekova AV, Akey DT, Goldstein O, Kirkness EF, Baysac KC, et al. Breed relationships facilitate fine-mapping studies: a 7.8-kb deletion cosegregates with Collie eye anomaly across multiple dog breeds. Genome Res. 2007;17:1562–71. doi: 10.1101/gr.6772807. [DOI] [PMC free article] [PubMed] [Google Scholar]
- 8.Quignon P, Herbin L, Cadieu E, Kirkness EF, Hedan B, Mosher DS, et al. Canine population structure: assessment and impact of intra-breed stratification on SNP-based association studies. PLoS ONE. 2007;2:e1324. doi: 10.1371/journal.pone.0001324. [DOI] [PMC free article] [PubMed] [Google Scholar]
- 9.Abadie J, Hedan B, Cadieu E, De Brito C, Devauchelle P, Bourgain C, et al. Epidemiology, pathology, and genetics of histiocytic sarcoma in the Bernese mountain dog breed. J Hered. 2009;100 (Suppl 1):S19–27. doi: 10.1093/jhered/esp039. [DOI] [PMC free article] [PubMed] [Google Scholar]
- 10.Affolter VK, Moore PF. Localized and disseminated histiocytic sarcoma of dendritic cell origin in dogs. Vet Pathol. 2002;39:74–83. doi: 10.1354/vp.39-1-74. [DOI] [PubMed] [Google Scholar]
- 11.Moore PF, Affolter VK, Vernau W. Canine hemophagocytic histiocytic sarcoma: a proliferative disorder of CD11d+ macrophages. Vet Pathol. 2006;43:632–45. doi: 10.1354/vp.43-5-632. [DOI] [PubMed] [Google Scholar]
- 12.Fulmer AK, Mauldin GE. Canine histiocytic neoplasia: an overview. Can Vet J. 2007;48:1041–3. 6–50. [PMC free article] [PubMed] [Google Scholar]
- 13.Grogan TM, Pileri SA, Chan JKC, Weiss LM, Fletcher CDM. Histiocytic and dendritic cell neoplasms. In: Swerdlow SH, editor. WHO classification of tumours of haematopoietic and lymphoid tissues. 4. International Agency for Research on Cancer; 2008. pp. 353–68. [Google Scholar]
- 14.Maniatis T, Fritsch EF, Sambrook J. Molecular cloning: A laboratory manual. 1. N.Y.: Cold Spring Harbor Laboratory Press; 1982. [Google Scholar]
- 15.Price AL, Patterson NJ, Plenge RM, Weinblatt ME, Shadick NA, Reich D. Principal components analysis corrects for stratification in genome-wide association studies. Nat Genet. 2006;38:904–9. doi: 10.1038/ng1847. Epub 2006 Jul 23. [DOI] [PubMed] [Google Scholar]
- 16.Purcell S, Neale B, Todd-Brown K, Thomas L, Ferreira MA, Bender D, et al. PLINK: a tool set for whole-genome association and population-based linkage analyses. Am J Hum Genet. 2007;81:559–75. doi: 10.1086/519795. [DOI] [PMC free article] [PubMed] [Google Scholar]
- 17.Bland JM, Altman DG. Multiple significance tests: the Bonferroni method. BMJ. 1995;310:170. doi: 10.1136/bmj.310.6973.170. [DOI] [PMC free article] [PubMed] [Google Scholar]
- 18.Browning SR, Browning BL. Rapid and accurate haplotype phasing and missing-data inference for whole-genome association studies by use of localized haplotype clustering. Am J Hum Genet. 2007;81:1084–97. doi: 10.1086/521987. [DOI] [PMC free article] [PubMed] [Google Scholar]
- 19.Browning BL. PRESTO: rapid calculation of order statistic distributions and multiple-testing adjusted P-values via permutation for one and two-stage genetic association studies. BMC Bioinformatics. 2008;9:309. doi: 10.1186/1471-2105-9-309. [DOI] [PMC free article] [PubMed] [Google Scholar]
- 20.Kang HM, Zaitlen NA, Wade CM, Kirby A, Heckerman D, Daly MJ, et al. Efficient Control of Population Structure in Model Organism Association Mapping. Genetics. 2008;178:1709–23. doi: 10.1534/genetics.107.080101. [DOI] [PMC free article] [PubMed] [Google Scholar]
- 21.Browning BL, Yu Z. Simultaneous genotype calling and haplotype phasing improves genotype accuracy and reduces false-positive associations for genome-wide association studies. Am J Hum Genet. 2009;85:847–61. doi: 10.1016/j.ajhg.2009.11.004. [DOI] [PMC free article] [PubMed] [Google Scholar]
- 22.Rozen S, Skaletsky H. Primer3 on the WWW for general users and for biologist programmers. Methods Mol Biol. 2000;132:365–86. doi: 10.1385/1-59259-192-2:365. [DOI] [PubMed] [Google Scholar]
- 23.Ewing B, Hillier L, Wendl MC, Green P. Base-calling of automated sequencer traces using phred. I. Accuracy assessment. Genome Res. 1998;8:175–85. doi: 10.1101/gr.8.3.175. [DOI] [PubMed] [Google Scholar]
- 24.Ewing B, Green P. Base-calling of automated sequencer traces using phred. II. Error probabilities. Genome Res. 1998;8:186–94. [PubMed] [Google Scholar]
- 25.Gordon D, Abajian C, Green P. Consed: a graphical tool for sequence finishing. Genome Res. 1998;8:195–202. doi: 10.1101/gr.8.3.195. [DOI] [PubMed] [Google Scholar]
- 26.Nickerson DA, Tobe VO, Taylor SL. PolyPhred: automating the detection and genotyping of single nucleotide substitutions using fluorescence-based resequencing. Nucleic Acids Res. 1997;25:2745–51. doi: 10.1093/nar/25.14.2745. [DOI] [PMC free article] [PubMed] [Google Scholar]
- 27.Browning BL, Browning SR. Efficient multilocus association testing for whole genome association studies using localized haplotype clustering. Genet Epidemiol. 2007;31:365–75. doi: 10.1002/gepi.20216. [DOI] [PubMed] [Google Scholar]
- 28.Barrett JC, Fry B, Maller J, Daly MJ. Haploview: analysis and visualization of LD and haplotype maps. Bioinformatics. 2005;21:263–5. doi: 10.1093/bioinformatics/bth457. Epub 2004 Aug 5. [DOI] [PubMed] [Google Scholar]
- 29.Romani N, Gruner S, Brang D, Kampgen E, Lenz A, Trockenbacher B, et al. Proliferating dendritic cell progenitors in human blood. The Journal of experimental medicine. 1994;180:83–93. doi: 10.1084/jem.180.1.83. [DOI] [PMC free article] [PubMed] [Google Scholar]
- 30.Bund D, Buhmann R, Gokmen F, Kremser A, Dreyssig J, Kolb HJ, et al. Canine-DCs using different serum-free methods as an approach to provide an animal-model for immunotherapeutic strategies. Cellular immunology. 2010;263:88–98. doi: 10.1016/j.cellimm.2010.03.003. [DOI] [PubMed] [Google Scholar]
- 31.Livak KJ, Schmittgen TD. Analysis of relative gene expression data using real-time quantitative PCR and the 2(−Delta Delta C(T)) Method. Methods. 2001;25:402–8. doi: 10.1006/meth.2001.1262. [DOI] [PubMed] [Google Scholar]
- 32.Pfaffl MW. A new mathematical model for relative quantification in real-time RT-PCR. Nucleic Acids Res. 2001;29:e45. doi: 10.1093/nar/29.9.e45. [DOI] [PMC free article] [PubMed] [Google Scholar]
- 33.Sutter NB, Eberle MA, Parker HG, Pullar BJ, Kirkness EF, Kruglyak L, et al. Extensive and breed-specific linkage disequilibrium in Canis familiaris. Genome Res. 2004;14:2388–96. doi: 10.1101/gr.3147604. [DOI] [PMC free article] [PubMed] [Google Scholar]
- 34.Lindblad-Toh K, Wade CM, Mikkelsen TS, Karlsson EK, Jaffe DB, Kamal M, et al. Genome sequence, comparative analysis and haplotype structure of the domestic dog. Nature. 2005;438:803–19. doi: 10.1038/nature04338. [DOI] [PubMed] [Google Scholar]
- 35.Tian C, Kosoy R, Nassir R, Lee A, Villoslada P, Klareskog L, et al. European population genetic substructure: further definition of ancestry informative markers for distinguishing among diverse European ethnic groups. Mol Med. 2009;15:371–83. doi: 10.2119/molmed.2009.00094. [DOI] [PMC free article] [PubMed] [Google Scholar]
- 36.Boyko AR, Quignon P, Li L, Schoenebeck JJ, Degenhardt JD, Lohmueller KE, et al. A simple genetic architecture underlies morphological variation in dogs. PLoS Biol. 2010;8:e1000451. doi: 10.1371/journal.pbio.1000451. [DOI] [PMC free article] [PubMed] [Google Scholar]
- 37.Ostrander EA, Kruglyak L. Unleashing the canine genome. Genome Res. 2000;10:1271–4. doi: 10.1101/gr.155900. [DOI] [PubMed] [Google Scholar]
- 38.Rosenbloom KR, Dreszer TR, Pheasant M, Barber GP, Meyer LR, Pohl A, et al. ENCODE whole-genome data in the UCSC Genome Browser. Nucleic Acids Res. 2010;38:D620–5. doi: 10.1093/nar/gkp961. [DOI] [PMC free article] [PubMed] [Google Scholar]
- 39.Ernst J, Kellis M. Discovery and characterization of chromatin states for systematic annotation of the human genome. Nat Biotechnol. 2010;28:817–25. doi: 10.1038/nbt.1662. [DOI] [PMC free article] [PubMed] [Google Scholar]
- 40.Ernst J, Kheradpour P, Mikkelsen TS, Shoresh N, Ward LD, Epstein CB, et al. Mapping and analysis of chromatin state dynamics in nine human cell types. Nature. 2011;473:43–9. doi: 10.1038/nature09906. [DOI] [PMC free article] [PubMed] [Google Scholar]
- 41.Gil J, Peters G. Regulation of the INK4b-ARF-INK4a tumour suppressor locus: all for one or one for all. Nat Rev Mol Cell Biol. 2006;7:667–77. doi: 10.1038/nrm1987. [DOI] [PubMed] [Google Scholar]
- 42.Sharpless NE, Bardeesy N, Lee KH, Carrasco D, Castrillon DH, Aguirre AJ, et al. Loss of p16Ink4a with retention of p19Arf predisposes mice to tumorigenesis. Nature. 2001;413:86–91. doi: 10.1038/35092592. [DOI] [PubMed] [Google Scholar]
- 43.Kumar R, Khan SP, Joshi DD, Shaw GR, Ketterling RP, Feldman AL. Pediatric histiocytic sarcoma clonally related to precursor B-cell acute lymphoblastic leukemia with homozygous deletion of CDKN2A encoding p16INK4A. Pediatr Blood Cancer. 2011;56:307–10. doi: 10.1002/pbc.22810. [DOI] [PubMed] [Google Scholar]
- 44.Hedan B, Thomas R, Motsinger-Reif A, Abadie J, Andre C, Cullen J, et al. Molecular cytogenetic characterization of canine histiocytic sarcoma: A spontaneous model for human histiocytic cancer identifies deletion of tumor suppressor genes and highlights influence of genetic background on tumor behavior. BMC cancer. 2011;11:201. doi: 10.1186/1471-2407-11-201. [DOI] [PMC free article] [PubMed] [Google Scholar]
- 45.Halvorsen OJ, Hostmark J, Haukaas S, Hoisaeter PA, Akslen LA. Prognostic significance of p16 and CDK4 proteins in localized prostate carcinoma. Cancer. 2000;88:416–24. [PubMed] [Google Scholar]
- 46.Dublin EA, Patel NK, Gillett CE, Smith P, Peters G, Barnes DM. Retinoblastoma and p16 proteins in mammary carcinoma: their relationship to cyclin D1 and histopathological parameters. Int J Cancer. 1998;79:71–5. doi: 10.1002/(sici)1097-0215(19980220)79:1<71::aid-ijc14>3.0.co;2-k. [DOI] [PubMed] [Google Scholar]
- 47.Klaes R, Friedrich T, Spitkovsky D, Ridder R, Rudy W, Petry U, et al. Overexpression of p16(INK4A) as a specific marker for dysplastic and neoplastic epithelial cells of the cervix uteri. Int J Cancer. 2001;92:276–84. doi: 10.1002/ijc.1174. [DOI] [PubMed] [Google Scholar]
- 48.Lee CT, Capodieci P, Osman I, Fazzari M, Ferrara J, Scher HI, et al. Overexpression of the cyclin-dependent kinase inhibitor p16 is associated with tumor recurrence in human prostate cancer. Clin Cancer Res. 1999;5:977–83. [PubMed] [Google Scholar]
- 49.Dong Y, Walsh MD, McGuckin MA, Gabrielli BG, Cummings MC, Wright RG, et al. Increased expression of cyclin-dependent kinase inhibitor 2 (CDKN2A) gene product P16INK4A in ovarian cancer is associated with progression and unfavourable prognosis. Int J Cancer. 1997;74:57–63. doi: 10.1002/(sici)1097-0215(19970220)74:1<57::aid-ijc10>3.0.co;2-f. [DOI] [PubMed] [Google Scholar]
- 50.Chae SW, Sohn JH, Kim DH, Choi YJ, Park YL, Kim K, et al. Overexpressions of Cyclin B1, cdc2, p16 and p53 in human breast cancer: the clinicopathologic correlations and prognostic implications. Yonsei Med J. 2011;52:445–53. doi: 10.3349/ymj.2011.52.3.445. [DOI] [PMC free article] [PubMed] [Google Scholar]
- 51.Pirkov I, Norbeck J, Gustafsson L, Albers E. A complete inventory of all enzymes in the eukaryotic methionine salvage pathway. FEBS J. 2008;275:4111–20. doi: 10.1111/j.1742-4658.2008.06552.x. [DOI] [PubMed] [Google Scholar]
- 52.Kadariya Y, Yin B, Tang B, Shinton SA, Quinlivan EP, Hua X, et al. Mice heterozygous for germ-line mutations in methylthioadenosine phosphorylase (MTAP) die prematurely of T-cell lymphoma. Cancer Res. 2009;69:5961–9. doi: 10.1158/0008-5472.CAN-09-0145. [DOI] [PMC free article] [PubMed] [Google Scholar]
- 53.Hindorff LA, MacArthur J, Wise A, Junkins HA, Hall PN, Klemm AK, et al. A Catalog of Published Genome-Wide Association Studies. [cited 03/17/2011]; Available from: http://www.genome.gov/GWAStudies/
Associated Data
This section collects any data citations, data availability statements, or supplementary materials included in this article.