

Abstract
Background
The development of predictive biomarkers for IGF targeted anti-cancer therapeutics remains a critical unmet need. The insulin receptor A isoform (InsR-A) has been identified as a possible biomarker candidate but quantification of InsR-A in widely available formalin fixed paraffin embedded (FFPE) tissues is complicated by its similarities with the metabolic signaling insulin receptor isoform B (InsR-B). In the present study, qPCR based assays specific for InsR-A, InsR-B and IGF-1R were developed for use in FFPE tissues and tested for feasible use in clinical archived FFPE estrogen receptor (ER) + and ER− breast cancer tumors.
Design
FFPE compatible primer sets were designed with amplicon sizes of less than 60 base pairs and validated for target specificity, assay repeatability and amplification efficiency. FFPE tumors from ER+ (n=83) and ER− (n=64) primary untreated breast cancers, and ER+ hormone refractory (HR ER+) (n=61) breast cancers were identified for feasibility testing. The feasible use of InsR-A and InsR-B qPCRs were tested using all tumor groups and the feasibility of IGF-1R qPCR was determined using HR ER+ tumors.
Results
All qPCR assays were highly reproducible with amplification efficiencies between 96–104% over a 6 log range with limits of detection of 4 or 5 copies per reaction. Greater than 90% of samples were successfully amplified using InsR-A, InsR-B or IGF-1R qPCR primer sets and greater than 88% of samples tested amplified both InsR isoforms or both isoforms and IGF-1R. InsR-A was the predominant isoform in 82% ER+, 68% ER− and 100% HR ER+ breast cancer. Exploratory analyses demonstrated significantly more InsR-A expression in ER+ and HR ER+ groups compared to InsR-B (ER+ p< 0.05, HR ER+ p< 0.0005) and both groups had greater InsR-A expression when compared to ER− tumors (ER+ p< 0.0005, HR ER+ p< 0.05). IGF-1R expression of HR ER+ tumors was lower than InsR-A (p<0.0005) but higher than InsR-B (p<0.0005). The InsR-B expression of HR ER+ tumors was significantly reduced compared other tumor subgroups (ER+ and ER−, p< 0.0005) and lead to a significant elevation of HR ER+ InsR-A:InsR-B ratios (ER+ and ER−, p< 0.0005).
Conclusions
The validated, highly sensitive InsR-A and InsR-B qPCR based assays presented here are the first to demonstrate the feasible amplification of InsR isoforms in FFPE tissues. Quantification data generated from this feasibility study indicating InsR-A is more predominant than InsR-B in breast cancer support the use of these assays for further investigation of InsR-A and InsR-B as predictive biomarkers for IGF targeted therapeutics.
Keywords: Real-time, qPCR, breast cancer, receptor, insulin, receptor, IGF Type 1, monoclonal antibodies, therapeutic use, protein kinase inhibitors
INTRODUCTION
The insulin receptor (InsR) is a transmembrane protein composed of 2 covalently bound dimers each with a ligand binding α and tyrosine kinase active β subunit1. The InsR dimer is expressed as an A (InsR-A) or B (InsR-B) isoform through alternate splicing of the insulin receptor gene’s exon 11 and assembled post translationally as a functional homodimeric (A/A, B/B) or heterodimeric receptor (A/B)2. As a homodimer, the full length isoform, InsR-B (+exon 11), binds insulin to maintain glucose metabolism and transport but can induce proliferative and pro-survival signaling in hyperinsulinemic conditions3–6. The shorter InsR-A (−exon 11) isoform is truncated by 12 amino acid residues (717–728) near the c-terminus of the α subunit and receptor homo/heterodimers are activated by IGF-II to initiate IRS mediated proliferative, pro-survival, and metastatic signaling (PI3K and MAPK pathways)1,2,7. However, understanding InsR component of IGF signaling is further complicated by the heterodimerization of InsR with the type-1 insulin-like growth factor receptor (IGF-1R) which form functional IGF-I and IGF-II responsive receptor hybrids (IGF-IR/InsR-A and InsR-A/InsR-B)8.
The predominance of IGF signaling in cancer has driven the development of IGF targeted anti-cancer therapeutics9,10. In breast cancer, primary and secondary resistance to hormone and HER2 targeted therapies has led to the co-targeting of these pathways with the IGF signaling pathway8,9,11–15. The most developed IGF targeted therapies employ monoclonal antibodies (mAb) to block IGF-IR, mediated IGF-I and IGF-II signaling, and induce the internalization/degradation of IGF-1R protein9,10,16,17. However, IGF-II signaling is only partially blocked by mAb inhibitors due to its high affinity for both IGF-1R and InsR-A9,11,17,18. Phase I clinical trials with these inhibitors have demonstrated tolerability and preliminary evidence of activity, but the metabolic consequences of these therapies, hyperglycemia, hyperinsulinemia, and elevated levels of growth hormone, can incite upregulation of IGF-II/InsR-A signaling as one mechanism of therapy resistance11,19–21. As such, InsR-A has emerged as one possible biomarker for both the selection and monitoring of IGF-1R targetable patient populations and provides a rational for co-targeting InsR-A4,10,20,22–28. The more recently developed small-molecule IGF-1/insulin tyrosine kinase inhibitors (TKI) and dual IGF-I/IGF-II ligand targeting antibody therapies have a more comprehensive IGF targeting design and may prove to be more optimal in blockading IGF signaling if an IGF-II/InsR-A tumor proliferation and survival signaling component proves to be significant29,30.
Functional InsR/IGF-1R hybrid receptors have been described in breast and many types of cancer5. In breast cancer, immunohistochemical studies measuring total InsR protein expression have suggested a correlation between elevated InsR expression and positive outcomes in primary and node negative cancers, and poor outcomes in advanced cancers, but it is uncertain whether IGF signaling measured in theses studies is predominantly driven by InsR or IGF-1R as immunohistochemical reagents capable of differentiating InsR-A from InsR-B proteins have not been developed18,24,25,31. Alternative methods for the detection of InsR-A and InsR-B based on quantitative and qualitative PCR have been developed to address this need, but these assays rely upon the availability of fresh frozen or RNA preserved tissues and have not been adopted for testing in the clinical setting7,32–34. In the clinic, diagnostic tissues are universally preserved through the FFPE process, but this type of tissue preservation can present significant compatibility issues with qPCR based assays. During formalin fixation process, variations in sample size, permeability, and type can result in variable levels of RNA-protein cross-linkage, RNA base modification, and RNA fragmentation which can be further exacerbated by archival storage35–37. Specialized kits for FFPE RNA isolation can reverse some of the fixation induced damage but the residual damage can strongly inhibit reverse transcription and result in variable lengths of transcribed cDNA35. Under these fragmented cDNA conditions the amplicon size of a primer set is critical for successful amplification and primer set amplicons of 60 base pairs have an 80% success rate in FFPE cDNA35. InsR isoform specific qPCR assays compatible with FFPE sample types would aid in defining IGF signaling by significantly broadening the number of samples available and enabling the correlation of results with cancer pathology, but previously published InsR primer sets use larger amplicons and limit their reliable use to non-FFPE sample types35,38.
To address this need, qPCR InsR-A, InsR-B, and IGF-1R assays with primer designs compatible with FFPE, RNA-preserved, and frozen sample types were developed39. Each assay was validated using established minimum information for publication of quantitative real-time PCR experiments (MIEQ) guidelines40. The feasibility of measuring target gene expression was tested using clinically archived estrogen receptor positive (ER+) and negative (ER−) primary untreated breast tumors, and ER+ hormone refractory tumors (HR ER+) breast tumors.
MATERIALS AND METHODS
Primer design and standard template generation
GenBank accession numbers NM_001079817 (InsR-A), NM_000208 (InsR-B), and NM_000875 (IGF-1R) were used to identify target specific primer sets. To insure FFPE sample compatibility InsR isoform and IGF-1R specific primers having amplicons of 50 base pairs (InsR-A: F- GTTTTCGTCCCCAGGCCATC, R- CCAACATCGCCAAGGGACCT39), 42 base pairs (InsR-B: F- CACTGGTGCCGAGGACCCTA, R-GACCTGCGTTTCCGAGATGG39), and 48 base pairs (IGF-1R: F- GAGCAGCTAGAAGGGAATTAC, R- AAGTTCTGGTTGTCGAGGA) were designed using Oligo 6 Primer Analysis Software (Molecular Biology Insights, Inc. Cascade, CO.), and checked for specificity using Primer-Blast (www.ncbi.nlm.nih.gov/tools/primer-blast/index.cgi?LINK_LOC=BlastHomeAd). Primer sets were synthesized at Mayo Foundation’s Advanced Genomics Technology Center (AGTC) (Rochester, MN) and the identity of PCR products from each primer set were confirmed by sequencing (AGTC).
IGF-1R standard template was produced by PCR cloning and purified by agarose gel electrophoresis. InsR isoform specific standard templates were identified from homologous regions of InsR-A (404bp) and -B (440bp) using Oligo 6 Primer Analysis Software. Isoform specific sequences were synthesized and individually cloned into pUCminusMCS plasmids by Blue Heron Biotechnology (Bothell, WA.) (Figure 1A–B). Sequence identity and cloning were validated by Blue Heron and resulting plasmids were supplied in purified form. Log10 dilutions of each assay standard were made in 0.01M Tris-HCL pH 8.0 using the molecular weight and OD260 readings. Each standard was amplified by PCR across a 5 log10 range of input and visually examined by agarose gel electrophoresis to confirm reactions produced a single product of the expected molecular weight (Figure 1A–B, IGF-1R not shown).
Figure 1. InsR PCR primer design and standard plasmid template construction.


InsR-A and B isoform templates were synthesized and cloned into pUCminusMCS plasmid vectors. (A) InsR-A qPCR primers amplify a 50 bp region within the 404 bp encoded by exons 10 and 12. (B) InsR-B qPCR primers amplify a 42 bp region of the 440 bp encoded by exons 10, 11, and 12. A 20 bp ladder is shown.
InsR and IGF-1R qPCR assay validation
All qPCR validation and breast cancer sample reactions were assembled in triplicate using ABI SybrGreen PCR core reagents kit (Applied Biosystems, Carlsbad, CA) and run on ABI 7900HT Fast Real-Time PCR System and copy number calculation performed using Sequence Detection Systems software v2.4 (Applied Biosystems). Ten assay replicates were used to determine amplification efficiency, slope, intercept, R squared, intra-assay variation, and overall CV for each qPCR assay between 10 and 106 copies per reaction. InsR-A and -B qPCR assay were additionally tested for isoform crossreactivity using between 10 and 106 copies of opposing isoform plasmid per reaction. Five assay replicates were used to measure assay recovery for all assays. Isoform specific interference was assessed for InsR-A and InsR-B qPCR assays using non-target to target isoform rations of 1, 10 and 100. Each assays limit of detection (LOD) was tested using 8 assay replicates. Points with detection levels of 10 copies or less were completed using 6 replicates per assay (n=48). The LOD of each assay was determined empirically using the lowest input copy number at which 95% of assay replicates reported target specific melt curves
Breast cancer specimen power analysis and selection
Based on our preliminary data with cell lines and data from the literature, we hypothesize that 75% of breast cancer samples had a predominance (A/A+B >0.5) of InsR-A4,41. Based on this, we determined 200 patients would give a +/− 6.1% 95% confidence interval around 75%, if this was the true predominance. Thus, if the true predominance of isoform A is 57% or greater, 200 samples would be sufficient to determine if the majority of patients were InsR-A predominant (p < 0.05). All samples were collected with approval of Mayo Clinic Institutional Review Board, Rochester MN. 208 breast cancer blocks were identified from patients with 80% or more tumor tissue present in the paraffin archives using the Mayo Clinic Breast Cancer Tissue Registry. A total of 208 (147 primary untreated ER+ [n=83], and ER− [n=64], and 61 HR ER+) breast cancer blocks were identified for this study. All other analyses, including dependence of ER expression, were exploratory.
RNA isolation and generation of cDNA from FFPE samples
ER+ and ER− breast cancer tumor RNA was isolated from 3 tissue core biopsy punches taken from tumor rich areas of FFPE tissue blocks42. To preserve the integrity of HR ER+ sample blocks for future studies RNA was isolated from 10–20, 5μm sections cut from each block. Total RNA was isolated from FFPE samples using the Qiagen RNeasy FFPE Kit reagents either manually (HR ER+) or with QIAcube instrumentation (ER+ and ER−) (Qiagen, Valencia CA) following vendor’s standard protocols. All isolated FFPE RNA was treated with DNase (Qiagen) and re-purified using RNeasy Mini Kit (Qiagen) as described in the manufactures clean-up protocol. RNA concentration and purity were determined spectrophotometrically (OD260/280>1.8) (Nano Drop 2000 spectrophotometer, Thermo Scientific, Waltham MA). Between 300–500ng of FFPE tissue RNA was reverse transcribed using ABI High capacity RNA to cDNA kit (Applied Biosystem, Carlsbad, CA) as described in the manufacturer’s instructions and resulting cDNA was diluted 1:5 in molecular grade RNase/DNase free H2O and stored at −20C prior to use.
InsR qPCR assay of FFPE ER+ and ER− breast cancer samples
FFPE RNA quality cannot be measured directly by fragmentation based methods; therefore, the quality FFPE RNA was assessed within each group post reverse-transcriptionally through ribosomal protein 19 (RPL19) expression. Normalization ratios for each sample were calculated (Nsample = RPL19median/RPL19sample) and compared to the group mean. Samples with RPL19 normalization ratios greater than +3.5 standard deviations (SD) (approximately 99.9% confidence interval) from the mean were excluded from further analysis. The standard replicates for each qPCR assay were examined for amplification efficiencies between 95–105% and all standards and sample replicate data were analyzed for product specific melt cures. Sample or standard replicates which did not conform to these parameters were removed from the analysis. Gene transcript copy numbers from each conforming replicate were normalized to RNA input and RPL19 gene expression before being reported as copies of target gene per μg RNA.
Sample Analysis and Statistics
Outlier analysis of RPL19 normalization values was completed using Grubbs’ sample outlier test (GraphPad online calculator website (http://graphpad.com/quickcalcs/Grubbs1.cfm). Samples reporting measurable values of InsR-A and -B were used for InsR isoform analysis and samples reporting with measurable levels of InsR-A, -B and IGF-1R were used for IGF-1R and InsR comparisons. The following analyses were preformed using GraphPad Prism software v5.04 (La Jolla, CA). Differences in assay recovery were tested for significance using the Friedman repeated measures test with Dunns post test. Differences in global isoform expression were tested for significance using the Mann-Whitney U- test and group specific expression differences were tested with the Kruskal-Wallis one-way ANOVA and Dunns Multiple Comparison post test. The number of InsR-A predominant samples were tested using the Wilcoxon Signed Rank Test (Ho InsR-A predominance = 50%).
RESULTS
FFPE qPCR primer design
The InsR isoforms have nearly identical nucleic acid sequences which can be differentiated by the presence or absence of the 36 bp region encoding exon 11. InsR-A and InsR-B primer sets were designed to amplify isoform specific areas of ≤ 50 bp within the exon 11 region (Figure 1A–B). IGF-1R primers were designed to amplify an IGF-1R specific 48 bp region crossing the junction between exons 5 and 6. All primer pairs produced specific single PCR reaction products within a 5-log10 dilution range of standard template input: InsR-A (50 bp, Figure 1A), InsR-B (42 bp, Figure 1B) and IGF-1R (48 bp, data not shown).
qPCR performance
InsR-A, InsR-B and IGF-1R qPCR assays were each reproducible, specific, and highly sensitive over a broad range of input. Results from 10 template standard runs across a minimum 6 log range are summarized in Table 1. The detection limits per reaction were 5 copies for InsR-A and 4 copies for both InsR-B and IGF-1R. Each assay reported amplification efficiencies between 96% and 104% and an intra and overall variation below 5% (Figure 2).
Table 1.
qPCR Validation Data
| qPCR Assay | InsR-A | InsR-B | IGF-1R |
|---|---|---|---|
|
Amplification Efficiency Ave±SD, (n=10) |
100.71% ± 3.28% | 99.98% ± 2.32% | 100.49% ± 1.74% |
|
Slope Ave±SD, (n=10) |
−3.305 ± 0.077 | −3.322 ± 0.054 | −3.310 ± 0.041 |
|
Intercept Ave±SD, (n=10) |
36.97 ± 0.170 | 39.88 ± 0.376 | 37.34 ± 0.230 |
|
R squared Ave±SD, (n=10) |
0.996 ± 0.003 | 0.975 ± 0.011 | 0.998 ± 0.001 |
|
LOD copies/reaction (n=48) |
5 | 4 | 4 |
|
Intra-assay variation Ave±SD, (n=10) |
1.03% ± 0.86% | 0.71% ± 0.55% | 0.83% ± 0.83% |
|
Overall CV Ave±SD, (n=10) |
1.073% ± 0.959% | 3.052% ± 2.6% | 0.97% ± 0.52% |
|
Range of Detection copies/reaction |
5–106.4 | 4–106.4 | 4–107 |
|
Average Recovery Ave±SEM, (n=45) |
94.87%± 4.83% | 97.27% ± 5.54% | 98.67% ± 3.24% |
| Isoform Crossreactivity | 0.188%1 | No | NA |
|
Detection Rate Assay Specific |
93.6% (193/206) | 91.7% (189/206) | 91.8% (56/61) |
Only when InsR-B ≥ 104.4 copies/reaction.
Figure 2. InsR-A, -B, and IGF-1R qPCR amplification curves.

A best fit line (—) and a 95% confidence intervals (---) are shown. Data points are graphed as mean±SD. ○: InsR-A, □: InsR-B, and ◇: IGF-1R.
InsR isoform qPCR specificity
To determine the specificity of each qPCR reaction for its target isoform, cross reactivity experiments were performed using InsR-A or -B primer sets using their opposing isoform template. This testing detected some minor cross reactivity of the InsR-A qPCR primers with very high levels InsR-B template ( 104.4 copies per reaction, Figure 3A). Under these conditions, 0.189% of the total InsR-B template was reported as InsR-A. InsR-B cross reactivity could be eliminated by dilution as input levels of InsR-B less than 104.4 copies were not cross reactive. Reciprocal testing of InsR-B qPCR found no cross reactivity with InsR-A template plasmid (Figure 3B).
Figure 3. InsR isoform qPCR assay specificity and cross-reactivity testing.


Data are graphed as mean±SD. The InsR-A and InsR-B qPCR assays tested across a 6 log range of InsR-A or InsR-B plasmid input. (A) InsR-A qPCR. (B) InsR-A qPCR.
InsR isoform qPCR interdependency
As it is likely that both InsR-A and InsR-B isoforms will exist together in clinical samples, the recovery of both isoforms was evaluated in the presence of the opposing isoform. Specifically, the recovery of InsR-A was determined in the presence of increasing amounts of InsR-B template (Figure 4A) and InsR-B in the presence of increasing InsR-A template (Figure 4B). Each assay averaged greater than 94% recovery of the target template when tested with opposing isoform to target plasmid ratios of 1, 10, and 100 (Figure 4A–B).
Figure 4. InsR isoform qPCR assay recovery.
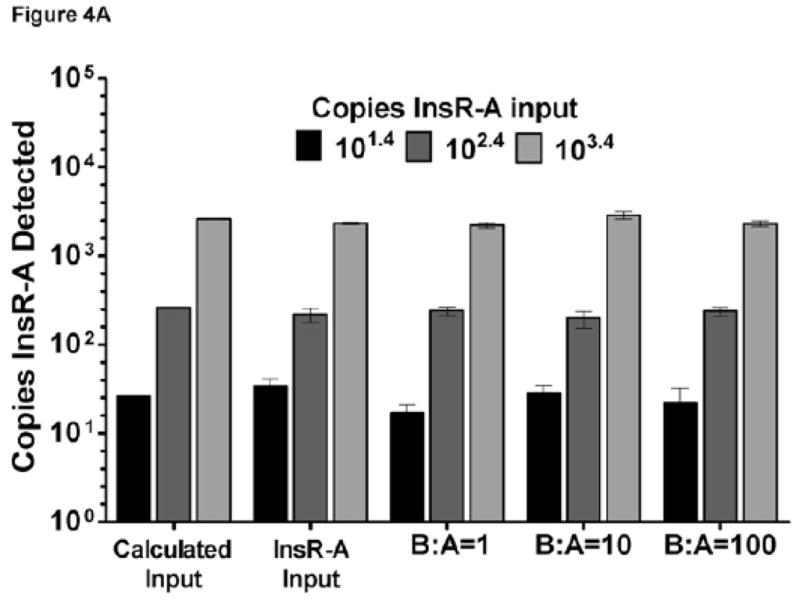

Data are graphed as mean±SD. For reference, calculated input bars of theoretical values are displayed. (A) InsR-A assay recovery: B:A = InsR-B to InsR-A input ratio. (B) InsR-B assay recovery: A:B = InsR-A to InsR-B input ratio.
InsR isoform expression in FFPE breast cancer tissues
The FFPE RNA quality of each sample was indirectly evaluated post reverse transcriptionally using RPL19 normalization values. Samples with excessive RNA fragmentation and or residual RNA crosslinking would be expected to report elevated normalization values by under performing in the RPL19 qPCR assay. Statical analysis of all the samples found 206/208 with RPL19 normalization values within a 99.9% confidence interval of the mean. Two samples, which were minimally amplified by the RPL19 qPCR assay, produced outlying normalization values (p=2.57×10⁻⁷, p=1.48×10−49) consistent with a high level of residual fixation induced RNA damage, and were removed from the analysis.
Automated and manual methods of RNA isolation utilizing the same reagents and workflow generated a similar proportion of samples with detectable InsR-A and -B (automated 127/147, manual 56/61, p=0.277). InsR-A and InsR-B were measurable in 93.6% (193/206) and 91.7% (189/206) of samples respectively (Table 1.) and both isoforms were reported in 88.8% (183/206) of samples (Table 2). IGF-1R expression was measurable in 91.8% (56/61) of HR ER+ tumors (Table 1) and all three targets were reported in 88.5% (54/61) of samples tested (Table 2).
Table 2.
InsR Isoform Expression Analysis
| Group | All | ER+ | ER− | HR ER+ |
|---|---|---|---|---|
| N | 1831 | 741 | 531 | 561, 542 |
|
Detection Rate Multiple Assays |
88.8%1 | 89.2%1 | 82.8%1 | 91.8%1, 88.5%2 |
| InsR-A (median copies/μg RNA) | 66066 | 83281 | 371643 | 743474 |
| InsR-B (median copies/μg RNA) | 23199 | 49738 | 23773 | 36064,5 |
| IGF-1R (median copies/μg RNA) | ND | ND | ND | 190314 |
| InsR-A > InsR-B | p<0.0001 | p<0.05 | NS | p<0.0005 |
| InsR-A + InsR-B (median copies/μg RNA) | 98479 | 1216135 | 81860 | 79241 |
| InsR-A : InsR-B (median) | 2.341 | 1.682 | 1.202 | 20.985 |
| Statistics | Mann-Whitney U-test | Kruskal-Wallis one-way ANOVA with Dunn’s Multiple Comparison Test | ||
| InsR-A Predominance (% of samples) | 83.6% | 82.4% | 67.9% | 100% |
|
Predominance >50% InsR-A (% of samples) |
p<0.0001 | p<0.0001 | p=0.0092 | 100% |
| Statistics | Wilcoxon Signed Rank Test | |||
InsR-A and InsR-B detected.
InsR-A, InsR-B, and IGF-1R detected.
p<0.0005 vs ER+, p<0.05 vs HR ER+
p<0.0005 vs other assay targets
p<0.0005 verses other tumor groups
Matched InsR-A and -B isoform expression was measured in 74 ER+, 53 ER−, and 56 HR ER+ breast tumors and data are summarized in Table 2. The primary analysis revealed that InsR-A was the predominant isoform in 83% of breast cancer samples (95% CI; 78%, 89%). In ER+, ER− and HR ER+ breast cancer, the InsR-A predominance (95% CI) was 82% (74%,91%), 68% (55%, 81%) and 100% (n/a, n/a). Additional exploratory analyses were performed, including determination of InsR-A versus -B in all samples (n=183), which detected a greater level of InsR-A expression overall compared to -B (p<0.0001, Figure 5A). Cumulative isoform expression (InsR-A + InsR-B) was significantly greater in ER+ tumors compared to ER− and HR ER+ groups (p<0.0005, Figure 5A). Within tumor groups, InsR-A expression was significantly greater in ER+ and HR ER+ tumors compared to InsR-B (ER+ p<0.05, HR ER+ p< 0.0005, Figure 5B), but no significant differences in isoform expression were detected in ER− tumors. Across tumor groups, ER+ and HR ER+ tumors had similar InsR-A expression and both expressed higher levels InsR-A than ER− tumors (ER+ p<0.0005, HR ER+ p<0.05, Figure 5B). InsR-B expression was comparable between ER+ and ER− tumor groups but strikingly lower in HR ER+ tumors (ER+ and ER− p< 0.0005, Figure 5B). This reduction in InsR-B expression resulted in an elevation of InsR-A:InsR-B ratios in HR ER+ tumors by more than a 12-fold compared to other groups (p<0.0005, Table 2, Figure 5C). As hormone and IGF-1R targeting therapy combinations have been show to restore hormone sensitivity in resistant cancer cells43,44, IGF-1R was also explored in HR ER+ tumors. InsR-A, -B, and IGF-1R were measurable in 88.5% (54/61) HR ER+ tumors (Table 2) and IGF-1R expression was significantly greater than InsR-B but lower than InsR-A (InsR-A > IGF-1R > InsR-B, p<0.0005, Figure 5D).
Figure 5. InsR isoform expression of ER+, ER−, and HR ER+ breast tumors.


Data are graphed as a median within a 50% interquartile range box plot with whiskers extending from 10–90% of the reported data range. (A) Cumulative and isoform specific InsR expression of FFPE breast tumors. (B) InsR isoform expression of FFPE tumor ER subgroups. (C) InsR isoform expression ratios. (D) IGF-1R expression of HR ER+ breast tumors. +++p<0.0001,***p<0.0005, * p<0.05
DISCUSSION
The development of predictive biomarkers for IGF targeted anti-cancer therapeutics remains a critical unmet need. The InsR-A has been identified as a possible biomarker candidate but its quantification in widely available FFPE tissues is complicated by its similarities with the metabolic signaling insulin receptor isoform, InsR-B. The present study is the first to demonstrate MIEQ validated, InsR-A and InsR-B qPCR primer pairs compatible in FFPE sample types and show feasible use in clinically archived breast tumors40. In the research setting, PCR based detection of InsR-A and InsR-B have been adopted in place of protein based methods, but these assays have not been widely used for clinical studies due to their dependence on fresh, frozen or RNA preserved samples types7,32–34. Primer sets compatibility with FFPE tissue cDNA is highly dependent upon a limiting amplicon size to 60 base pairs or less35. The InsR-A, -B, and IGF1-R qPCR primer sets presented here were designed with an amplicons of 50 base pairs or less. Previously reported InsR primer sets exceed this amplicon boundary and data demonstrating their feasible use in FFPE sample types has not been shown.
InsR-A, -B, and IGF-1R primer sets underwent extensive validation and testing to ensure sensitivity and specificity for their respective assay targets (Table 1). Of note is the rigorous isoform cross reactivity testing completed with the InsR-A and -B assays (Figure 3A). Testing of InsR-B primer set showed no crossreactivity when over 106 copies of InsR-A plasmid template was added per reaction. Reciprocal testing with the InsR-A primer set identified a very minimal level of crossreactivity (0.188%) when 104.4 or more copies of InsR-B plasmid template were input per reaction. In this example, an InsR-A deficient sample with 104.4 copies of InsR-B would misreport the detection of 47 copies of InsR-A, and an InsR-B to InsR-A ratio of 532. Breast tumor samples from this study reported a maximum InsR-B to InsR-A ratio of 5 suggesting much lower isoform ratios will exist in clinical samples. Given the consistent recovery of InsR-A and InsR-B (Figure 4A–B) when testing more physiologic isoform ratios (1, 10, and 100), the low level of observed low level of InsR-B plasmid crossreactivity in the InsR-A qPCR assay is not significant and it is unlikely that the observed crossreactivity would obscure assay sensitivity and specificity for InsR-A under physiologic conditions.
Feasibility data generated from FFPE samples support the use of these qPCR assays with FFPE samples types. Overall more than 88% of samples had measurable levels of InsR-A, and -B, or InsR-A, -B and IGF-1R (HR ER+ tumors). Although tumor sample RNA was purified manually and by automation, any processing differences were minimized by using the same core reagents and work flow for both procedures. Resulting RNA from manual and automated purification methods produced similar proportions of samples (91% and 86% respectively) with measurable levels of both InsR-A and -B.
Predominance data from this preliminary breast cancer study show InsR-A is a more significantly expressed component of total InsR expression than InsR-B. The observed expression of InsR-A and -B in ER+ and HR ER+ breast tumors is of particular interest as a considerable proportion of ER+ breast tumors will have de novo resistance to hormonal therapies via ligand-independent ER cross-talk with IGF-1R or other activated growth factor receptors13,45,46 Combining hormone therapies with IGF-1R inhibitors has restored hormone sensitivity to cancer cells and recent work showing IGF-II mediated activation and nuclear translocation of ER has further implicated IGF-1R and a possible role for InsR-A in this process12,21,47,48. HR ER+ tumors examined in this study expressed significantly greater levels of InsR-A vs IGF-1R (Figure 5D). Resistance to IGF-1R inhibition has been associated with elevated InsR:IGF-1R ratios in human breast cancer cells27. The median InsR-A:InsR-B ratio of HR ER+ tumors in the present study (20.98) was 12.5 fold greater than ER+ tumors and 17.5 fold greater than ER− tumors (Table 2, Figure 5C). The observed perturbation of InsR-A:InsR-B ratios in HR ER+ tumors was due to a significant drop in InsR-B expression and similar reductions of InsR-B have been previously reported32. While correlative InsR isoform work remains to be done, these data suggest a greater potential for IGF-II/InsR-A signaling in HR ER+ breast cancers and may help explain the positive and negative correlation of InsR protein expression with disease free survival in early and node negative cancers and invasive cancers respectively24,25,31.
Developing biomarkers which define IGF responsive and resistant patient populations is critical for the future success of IGF targeted therapeutics9,11,19,20,49,50. Clinical testing in the absence of IGF specific biomarkers has confounded study results, contributed to the closure of two large phase III trials and resulted in the distancing of some drug companies from further development of IGF targeting programs9,20,47,49,51. Data presented here and by others support further testing of InsR-A and InsR-B as biomarker candidates. The described InsR isoform assays are the first to demonstrate compatibility with FFPE sample types and the feasibility of measuring expression in FFPE patient tissues. As such these assays offer a significant enhancement in clinical utility for predictive biomarker testing of patients receiving IGF targeted therapies.
Acknowledgments
This work was supported by the following United States National Institute of Health Grant CA116201, (P. Haluska) Mayo Clinic Breast SPORE
Footnotes
Authors’ Disclosure of Potential Conflicts of Interests:
Research Labs; P.H. This work was funded in part by Bristol Myers Squibb.
Publisher's Disclaimer: This is a PDF file of an unedited manuscript that has been accepted for publication. As a service to our customers we are providing this early version of the manuscript. The manuscript will undergo copyediting, typesetting, and review of the resulting proof before it is published in its final citable form. Please note that during the production process errors may be discovered which could affect the content, and all legal disclaimers that apply to the journal pertain.
References
- 1.McKern NM, Lawrence MC, Streltsov VA, et al. Structure of the insulin receptor ectodomain reveals a folded-over conformation. Nature. 2006;443:218–21. doi: 10.1038/nature05106. [DOI] [PubMed] [Google Scholar]
- 2.Pandini G, Medico E, Conte E, Sciacca L, Vigneri R, Belfiore A. Differential gene expression induced by insulin and insulin-like growth factor-II through the insulin receptor isoform A. J Biol Chem. 2003;278:42178–89. doi: 10.1074/jbc.M304980200. [DOI] [PubMed] [Google Scholar]
- 3.Taniguchi CM, Emanuelli B, Kahn CR. Critical nodes in signalling pathways: insights into insulin action. Nat Rev Mol Cell Biol. 2006;7:85–96. doi: 10.1038/nrm1837. [DOI] [PubMed] [Google Scholar]
- 4.Zhang H, Pelzer AM, Kiang DT, Yee D. Down-regulation of Type I Insulin-like Growth Factor Receptor Increases Sensitivity of Breast Cancer Cells to Insulin. Cancer Res. 2007;67:391–7. doi: 10.1158/0008-5472.CAN-06-1712. [DOI] [PubMed] [Google Scholar]
- 5.Belfiore A, Frasca F, Pandini G, Sciacca L, Vigneri R. Insulin receptor isoforms and insulin receptor/insulin-like growth factor receptor hybrids in physiology and disease. Endocr Rev. 2009;30:586–623. doi: 10.1210/er.2008-0047. [DOI] [PubMed] [Google Scholar]
- 6.Novosyadlyy R, Lann DE, Vijayakumar A, et al. Insulin-Mediated Acceleration of Breast Cancer Development and Progression in a Nonobese Model of Type 2. Diabetes. 2010;70:741–51. doi: 10.1158/0008-5472.CAN-09-2141. [DOI] [PMC free article] [PubMed] [Google Scholar]
- 7.Sciacca L, Costantino A, Pandini G, et al. Insulin receptor activation by IGF-II in breast cancers: evidence for a new autocrine/paracrine mechanism. Oncogene. 1999;18:2471–9. doi: 10.1038/sj.onc.1202600. [DOI] [PubMed] [Google Scholar]
- 8.Pandini G, Vigneri R, Costantino A, et al. Insulin and insulin-like growth factor-I (IGF-I) receptor overexpression in breast cancers leads to insulin/IGF-I hybrid receptor overexpression: evidence for a second mechanism of IGF-I signaling. Clin Cancer Res. 1999;5:1935–44. [PubMed] [Google Scholar]
- 9.Gualberto A, Pollak M. Clinical development of inhibitors of the insulin-like growth factor receptor in oncology. Curr Drug Targets. 2009;10:923–36. doi: 10.2174/138945009789577945. [DOI] [PubMed] [Google Scholar]
- 10.Pollak M. Insulin and insulin-like growth factor signaling in neoplasia. Nat Rev Can. 2008;8:915–28. doi: 10.1038/nrc2536. [DOI] [PubMed] [Google Scholar]
- 11.Hou X, Harrington S, Macedo L, Weroha S, Brodie A, Haluska P. Hormonal therapies differentially enhance insulin receptor isoform A and erbB receptor up-regulation in response to IGF-1R inhibitor MK-0646 in vivo [Abstract]. Proceedings of the 100th Annual Meeting of the American Association for Cancer Research; (2009) Apr 18–22; Denver, CO. p. Abstract nr 2812. [Google Scholar]
- 12.Hou X, Huang F, Macedo LF, et al. Dual IGF-1R/InsR inhibitor BMS-754807 synergizes with hormonal agents in treatment of estrogen-dependent breast cancer. Cancer Res. 2011 Nov 2; doi: 10.1158/0008-5472.CAN-11-1080. [Epub ahead of print] [DOI] [PMC free article] [PubMed] [Google Scholar]
- 13.Fagan DH, Yee D. Crosstalk between IGF1R and estrogen receptor signaling in breast cancer. J Mamm Gland Biol Neo. 2008;13:423–9. doi: 10.1007/s10911-008-9098-0. [DOI] [PubMed] [Google Scholar]
- 14.Browne BC, Crown J, Venkatesan N, et al. Inhibition of IGF1R activity enhances response to trastuzumab in HER-2-positive breast cancer cells. Ann Oncol. 2011;22:68–73. doi: 10.1093/annonc/mdq349. [DOI] [PubMed] [Google Scholar]
- 15.Haluska P, Carboni JM, TenEyck C, et al. HER receptor signaling confers resistance to the insulin-like growth factor-I receptor inhibitor, BMS-536924. Mol Cancer Ther. 2008;7:2589–98. doi: 10.1158/1535-7163.MCT-08-0493. [DOI] [PMC free article] [PubMed] [Google Scholar]
- 16.Hailey J, Maxwell E, Koukouras K, Bishop WR, Pachter JA, Wang Y. Neutralizing Anti-Insulin-like Growth Factor Receptor 1 Antibodies Inhibit Receptor Function and Induce Receptor Degradation in Tumor Cells. Mol Cancer Ther. 2002;1:1349–53. [PubMed] [Google Scholar]
- 17.Pandini G, Wurch T, Akla B, Corvaia N, Belfiore A, Goetsch L. Functional responses and in vivo anti-tumour activity of h7C10: A humanised monoclonal antibody with neutralising activity against the insulin-like growth factor-1 (IGF-1) receptor and insulin/IGF-1 hybrid receptors. Euro J Cancer. 2007;43:1318–27. doi: 10.1016/j.ejca.2007.03.009. [DOI] [PubMed] [Google Scholar]
- 18.Cohen BD, Baker DA, Soderstrom C, et al. Combination therapy enhances the inhibition of tumor growth with the fully human anti-type 1 insulin-like growth factor receptor monoclonal antibody CP-751,871. Clin Cancer Res. 2005;11:2063–73. doi: 10.1158/1078-0432.CCR-04-1070. [DOI] [PubMed] [Google Scholar]
- 19.Haluska P, Worden F, Olmos D, et al. Safety, tolerability, and pharmacokinetics of the anti-IGF-1R monoclonal antibody figitumumab in patients with refractory adrenocortical carcinoma. Cancer Chemother Pharmacol. 2010;65:765–73. doi: 10.1007/s00280-009-1083-9. [DOI] [PMC free article] [PubMed] [Google Scholar]
- 20.Lee AV, Yee D. Targeting IGF-1R: at a Crossroad, The Golan and Javle article reviewed. Oncology (Williston Park) 2011;25:535–6. [PMC free article] [PubMed] [Google Scholar]
- 21.Hendrickson AW, Haluska P. Resistance pathways relevant to insulin-like growth factor-1 receptor-targeted therapy. Curr Opin Investig Drugs. 2009;10:1032–40. [PubMed] [Google Scholar]
- 22.Buck E, Gokhale PC, Koujak S, et al. Compensatory insulin receptor (IR) activation on inhibition of insulin-like growth factor-1 receptor (IGF-1R): rationale for cotargeting IGF-1R and IR in cancer. Mol Cancer Ther. 2010;9:2652–64. doi: 10.1158/1535-7163.MCT-10-0318. [DOI] [PubMed] [Google Scholar]
- 23.Frasca F, Pandini G, Scalia P, et al. Insulin receptor isoform A, a newly recognized, high-affinity insulin-like growth factor II receptor in fetal and cancer cells. Mol Cell Biol. 1999;19:3278–88. doi: 10.1128/mcb.19.5.3278. [DOI] [PMC free article] [PubMed] [Google Scholar]
- 24.Law JH, Habibi G, Hu K, et al. Phosphorylated Insulin-Like Growth FactorI/Insulin Receptor Is Present in All Breast Cancer Subtypes and Is Related to Poor Survival. Cancer Res. 2008;68:10238–46. doi: 10.1158/0008-5472.CAN-08-2755. [DOI] [PubMed] [Google Scholar]
- 25.Mulligan AM, O’Malley FP, Ennis M, Fantus IG, Goodwin PJ. Insulin receptor is an independent predictor of a favorable outcome in early stage breast cancer. Breast Cancer Res Tr. 2007;106:39–47. doi: 10.1007/s10549-006-9471-x. [DOI] [PubMed] [Google Scholar]
- 26.Singh SK, Tan QW, Brito C, De Leon M, De Leon D. Insulin-like growth factors I and II receptors in the breast cancer survival disparity among African-American women. Growth Horm Igf Res. 2010;20:245–54. doi: 10.1016/j.ghir.2010.03.001. [DOI] [PMC free article] [PubMed] [Google Scholar]
- 27.Ulanet DB, Ludwig DL, Kahn CR, Hanahan D. Insulin receptor functionally enhances multistage tumor progression and conveys intrinsic resistance to IGF-1R targeted therapy. Proc Natl Acad Sci U S A. 2010;107:10791–8. doi: 10.1073/pnas.0914076107. [DOI] [PMC free article] [PubMed] [Google Scholar]
- 28.Cao L, Yu Y, Darko I, et al. Addiction to elevated insulin-like growth factor I receptor and initial modulation of the AKT pathway define the responsiveness of rhabdomyosarcoma to the targeting antibody. Cancer Res. 2008;68:8039–48. doi: 10.1158/0008-5472.CAN-08-1712. [DOI] [PMC free article] [PubMed] [Google Scholar]
- 29.Carboni JM, Wittman M, Yang Z, et al. BMS-754807, a small molecule inhibitor of insulin-like growth factor-1R/IR. Mol Cancer Ther. 2009;8:3341–9. doi: 10.1158/1535-7163.MCT-09-0499. [DOI] [PubMed] [Google Scholar]
- 30.Haluska P, Shaw HM, Batzel GN, et al. Phase I dose escalation study of the anti insulin-like growth factor-I receptor monoclonal antibody CP-751,871 in patients with refractory solid tumors. Clin Cancer Res. 2007;13:5834–40. doi: 10.1158/1078-0432.CCR-07-1118. [DOI] [PubMed] [Google Scholar]
- 31.Mathieu MC, Clark GM, Allred DC, Goldfine ID, Vigneri R. Insulin receptor expression and clinical outcome in node-negative breast cancer. Proc Assoc Am Physicians. 1997;109:565–71. [PubMed] [Google Scholar]
- 32.Huang J, Morehouse C, Streicher K, et al. Altered expression of insulin receptor isoforms in breast cancer. PLoS One. 2011;6:e26177. doi: 10.1371/journal.pone.0026177. [DOI] [PMC free article] [PubMed] [Google Scholar]
- 33.Malaguarnera R, Frasca F, Garozzo A, et al. Insulin Receptor Isoforms and Insulin-Like Growth Factor Receptor in Human Follicular Cell Precursors from Papillary Thyroid Cancer and Normal Thyroid. 2011;96:766–74. doi: 10.1210/jc.2010-1255. [DOI] [PubMed] [Google Scholar]
- 34.Rowzee AM, Ludwig DL, Wood TL. Insulin-like growth factor type 1 receptor and insulin receptor isoform expression and signaling in mammary epithelial cells. 2009;150:3611–9. doi: 10.1210/en.2008-1473. [DOI] [PMC free article] [PubMed] [Google Scholar]
- 35.Hamatani K, Eguchi H, Takahashi K, et al. Improved RT-PCR Amplification for Molecular Analyses with Long-term Preserved Formalin-fixed, Paraffin-embedded Tissue Specimens. J Histo & Cyto. 2006;54:773–80. doi: 10.1369/jhc.5A6859.2006. [DOI] [PubMed] [Google Scholar]
- 36.Oberli A, Popovici V, Delorenzi M, et al. Expression profiling with RNA from formalin-fixed, paraffin-embedded material. BMC Med Genomics. 2008;1 doi: 10.1186/1755-8794-1-9. [DOI] [PMC free article] [PubMed] [Google Scholar]
- 37.Scott A, Ambannavar R, Jeong J, Liu ML, Cronin MT. RT-PCR-based gene expression profiling for cancer biomarker discovery from fixed, paraffin-embedded tissues. Methods Mol Biol. 2011;724:239–57. doi: 10.1007/978-1-61779-055-3_15. [DOI] [PubMed] [Google Scholar]
- 38.Liu ML, Jeong J, Ambannavar R, et al. Rt-PCR gene expression profiling of RNA from paraffin-embedded tissues prepared using a range of different fixatives and conditions. Methods Mol Biol. 2011;724:205–37. doi: 10.1007/978-1-61779-055-3_14. [DOI] [PubMed] [Google Scholar]
- 39.Harrington SC, Haluska P, inventors. 13/302,358 US patent application.
- 40.Bustin SA, Benes V, Garson JA, et al. The MIQE guidelines: minimum information for publication of quantitative real-time PCR experiments. Clin Chem. 2009;55:611–22. doi: 10.1373/clinchem.2008.112797. [DOI] [PubMed] [Google Scholar]
- 41.Sachdev D, Singh R, Fujita-Yamaguchi Y, Yee D. Down-regulation of insulin receptor by antibodies against the type I insulin-like growth factor receptor: implications for anti-insulin-like growth factor therapy in breast cancer. Cancer Res. 2006;66:2391–402. doi: 10.1158/0008-5472.CAN-05-3126. [DOI] [PubMed] [Google Scholar]
- 42.Schweizer MS, Schumacher L, Rubin MA. Current Protocols in Human Genetics. John Wiley & Sons; 2001. Constructing Tissue Microarrays for Research Use. [DOI] [PubMed] [Google Scholar]
- 43.Haluska P, Hou X, Huang F, et al. Complete IGF Signaling Blockade by the Dual-Kinase Inhibitor, BMS-754807, Is Sufficient To Overcome Tamoxifen and Letrozole Resistance In Vitro and In Vivo [Abstract]. Proceedings of the 32 Annual CTRC-AACR San Antonio Breast Cancer Symposium; (2009) Dec. 9–13; San Antonio, TX. p. Abstract nr 402. [Google Scholar]
- 44.Hou X, Carboni JM, Macedo LF, et al. Combined estrogen signaling inhibition and IGF-1R/InsR inhibition with BMS-754807 in estrogen-dependent breast cancer model has synergistic antitumor activity in vitro and in vivo [Abstract]. Proceedings of the 100th Annual Meeting of the American Association for Cancer Research; (2009) Apr 18–22; Denver, CO. [Google Scholar]
- 45.Mohla S, Stearns V, Sathyamoorthy N, Rosenfeld MG, Nelson P. The biology of hormone refractory breast and prostate cancer: An NCI workshop report. Cancer Biol Ther. 2009;8:1975–85. doi: 10.4161/cbt.8.21.9918. [DOI] [PubMed] [Google Scholar]
- 46.Song RXD, Chen Y, Zhang Z, et al. Estrogen utilization of IGF-1-R and EGF-R to signal in breast cancer cells. 2010;118:219–30. doi: 10.1016/j.jsbmb.2009.09.018. [DOI] [PMC free article] [PubMed] [Google Scholar]
- 47.Kaufman P, Ferrero J, Bourgeois H, et al. A Randomized, Double-Blind, Placebo-Controlled, Phase 2 Study of AMG 479 With Exemestane (E) or Fulvestrant (F) in Postmenopausal Women With Hormone-Receptor Positive (HR+) Metastatic (M) or Locally Advanced (LA) Breast Cancer (BC) [Abstract] Cancer Res. 2010;70(24 Suppl):Abstract nr S1–4. [Google Scholar]
- 48.Richardson AE, Hamilton N, Davis W, Brito C, De Leon D. Insulin-like growth factor-2 (IGF-2) activates estrogen receptor-alpha and -beta via the IGF-1 and the insulin receptors in breast cancer cells. Growth Factors. 2011 doi: 10.3109/08977194.2011.565003. [DOI] [PMC free article] [PubMed] [Google Scholar]
- 49.Golan T, Javle M. Targeting the insulin growth factor pathway in gastrointestinal cancers. Oncology (Williston Park) 2011;25:518–26. 29. [PubMed] [Google Scholar]
- 50.Avnet S, Sciacca L, Salerno M, et al. Insulin Receptor Isoform A and Insulin-like Growth Factor II as Additional Treatment Targets in Human Osteosarcoma. Cancer Res. 2009;69:2443–52. doi: 10.1158/0008-5472.CAN-08-2645. [DOI] [PubMed] [Google Scholar]
- 51.Zha J, Lackner MR. Targeting the Insulin-like Growth Factor Receptor-1R Pathway for Cancer Therapy. Clin Cancer Res. 2010;16:2512–7. doi: 10.1158/1078-0432.CCR-09-2232. [DOI] [PubMed] [Google Scholar]