

Abstract
HIV/gp120 transgenic mice manifest neuropathological features similar to HIV-associated neurocognitive disorders (HAND) in humans, including astrogliosis, microglia activation, and decreased neuronal synapses. Here, proteomic screening of synaptosomes from HIV/gp120 transgenic mice was conducted to determine potential neuronal markers and drug targets associated with HAND. Synaptosomes from 13 month-old wild-type (wt) and HIV/gp120 transgenic mouse cortex were subjected to tandem mass tag (TMT) labeling and subsequent analysis using an LTQ-Orbitrap mass spectrometer in pulsed-Q dissociation (PQD) mode for tandem mass spectrometry (MS/MS). A total of 1301 proteins were identified in both wt and HIV/gp120 transgenic mice. Three of the most differentially-regulated proteins were validated by immunoblotting. To elucidate putative pathways associated with the proteomic profile, 107 proteins manifesting a ≥1.5 fold change in expression were analyzed using a bioinformatics pathway analysis tool. This analysis revealed direct or indirect involvement of the phosphotidylinositol 3-kinase (PI3K)/protein kinase B (Akt) pathway, a well-known neuronal survival pathway. Immunoblots confirmed a lower phospho (p)Akt/Akt ratio in synaptosomes from HIV/gp120 transgenic animals compared to wt, suggesting that this neuroprotective pathway was inactivated in the HIV/gp120 transgenic brain. Based on this information, we then compared immunoblots of pAkt/Akt in the forebrains of these mice as well as in human postmortem brain. We observed a significant decrease in the pAkt/Akt ratio in synaptosomes and forebrain of HIV/gp120 transgenic compared to wt mice, and a similar decrease in human forebrain from HAND patients compared to neurologically unimpaired HIV+ and HIV- controls. Moreover, mechanistic insight into an additional pathway for decreased Akt activity in HIV/gp120 mouse brains and human HAND brains was shown to occur via S-nitrosylation of Akt protein, a posttranslational modification known to inhibit Akt activity and contribute to neuronal cell injury and death. Thus, MS proteomic profiling in the HIV/gp120 transgenic mouse predicted dysregulation of the PI3K/Akt pathway observed in human brains with HAND, providing evidence that this mouse is a useful disease model and that the Akt pathway may provide multiple drug targets for the treatment of HIV-related dementias.
Keywords: Proteomics, gp120, HIV-1, Akt, synaptosomes, tandem mass tag labeling for Mass Spectrometry, S-nitrosylation
Introduction
Human immunodeficiency virus (HIV)-1 infection can lead to motor and cognitive impairment designated HIV-associated neurocognitive disorders (HAND) (Kaul et al., 2007; Kolson, 2002; McArthur, 2004; Meucci et al., 2000). With the advent of Highly-Active Antiretroviral Therapy (HAART) there has been a significant decline in morbidity and mortality from Acquired Immunodeficiency Syndrome (AIDS), but HIV-associated neurologic complications are increasing in prevalence (McArthur, 2004; McArthur et al., 2010). Hence, a better understanding of the neurological disease process is necessary for successful intervention. Among several rodent models of HAND, including HIV-subacute combined immunodeficiency mice (HIV/severe combined immunodeficiency [SCID] mice) (Gorantia et al., 2007; Potula et al., 2005), the HIV/gp120 envelope protein-expressing transgenic mouse has been shown to develop several neuropathological features associated with HAND, such as dendritic and synaptic damage (Garden et al., 2002; Toggas et al., 1994), and hence is useful in studying HIV neuropathogenesis.
To specifically study potential pathways involved in neuronal damage, we sought to eliminate the ~90% of brain cells that are of glial origin (Hansson and Ronnback, 2003). One effective way of enriching for neuronal proteins related to synaptic function is through isolation of synaptosomes (Cohen and Fischbach, 1977; Kennedy et al., 1983); this is particularly relevant in the case of HAND since synaptic damage is a major feature of the disease. Here we used cortical synaptosomal preparations for isobaric labeling followed by tandem mass spectrometry (MS/MS) analysis for proteomic screening of neuronal proteins.
Concerning the method of proteomic analysis, a number of techniques involving isotopic tags have been developed for the quantification of proteins and peptides (Che and Fricker, 2005; Gygi et al., 1999; Ross et al., 2004). Isotope Coded Affinity Tag (ICAT) labels react with the thiol group of cysteine residues, and, when combined with biotin-affinity tags, allow purification of the labeled peptide (Gygi et al., 1999). However, since many peptides do not contain thiol groups, ICAT labeling proved to be a relatively inefficient way of protein screening. Therefore, we chose to use isotopic labeling of primary and secondary amines and lysine side chains using isobaric tags like tandem mass tag (TMT) (Che and Fricker, 2005). Specifically, TMT6 permits simultaneous identification and relative quantification of six different extracts by labeling with six isobaric tags in the MS/MS mode. Each isobaric tagging reagent has the same precursor mass and is composed of an amine-reactive NHS-ester group, a spacer arm, and an MS/MS reporter. For each sample, a unique reporter mass results in the MS/MS spectrum (126-131 Da for TMT6). These reporter ions are in the low mass region of the MS/MS spectrum and are used to report relative protein expression levels during peptide fragmentation (Thermo Fisher Scientific, Rockford, IL).
In this study we used TMT-based quantitative proteomic profiling followed by bioinformatics pathway analysis, which revealed dysregulation of the phosphoinositol-3 kinase (PI3K)/Akt pathway in HIV/gp120 transgenic mouse brain. Immunoblot analysis in brains of HIV/gp120 transgenic mice and humans manifesting HAND confirmed that reduced phosphoAkt (pAkt) activity strongly correlates with HIV-1 neuropathogenesis. Also, S-nitrosylated Akt was found in both HIV/gp120 transgenic mouse brains and human HAND brains, suggesting an additional mechanism for the decrease in Akt activity and consequent cell damage. These results provide evidence for the involvement of Akt in the etiology of HAND and further validating the Akt pathway as an attractive target for therapeutic intervention.
Material and Methods
Isolation of synaptosomes
Age-matched (13 month) wild-type (wt) and HIV/gp120 transgenic mice were sacrificed, and the brains were quickly removed, dissected, and then frozen with liquid nitrogen. Cortices from multiple (≥ 3) mice from the same age group were homogenized together in 0.32 M sucrose, 4 mM HEPES, and protease inhibitors. The synaptosomes were isolated using centrifugation by sucrose gradient as previously described (Carlin et al., 1980). Further purification was obtained by passing through 10 μm Millipore filters.
Tandem mass tag (TMT) labeling
To each sample of 100 μg protein we added 45 μl of 200 mM triethyl ammonium bicarbonate (TEAB) and adjusted the final volume to 100 μl with ultrapure water. Then, 5 μl of a 200 mM tris(2-carboxyethyl)phosphine (TCEP) solution was added to the mixture, and the sample was incubated at 55 °C for 1 hour × 2. Six volumes (~1 ml) of pre-chilled (-20 °C) acetone were used for overnight precipitation. The following morning, 100 μg of the acetone-precipitated protein pellets were resuspended in 100 μl of 200 mM TEAB. Trypsinization (using 2.5 μg per 100 μg protein) was carried out at 37 °C overnight. Digested peptides were tagged with the Thermo Scientific TMT6 plex Isobaric Mass Tagging Kit (wt with TMT126 and gp120 with TMT127) according to the manufacturer’s instructions. The chemically tagged samples were combined into one tube and stored at −80 °C until further use.
Protein identification by liquid chromatography (LC)-MS/MS
After the proteins were labeled with TMT, 90% formic acid was added to each sample to adjust the pH to ~2.5. Protein samples derived from either wt or HIV/gp120 transgenic mice were mixed, and 100 μg of the mixture were pressure-loaded onto a 250 μm internal diameter (I.D.) fused silica capillary column packed with 3 cm of 5 μm Partisphere strong cation exchanger (SCX, Whatman, Clifton, NJ) and 3 cm of 10 μm Jupiter reversed-phase C12 material (Phenomenex, Ventura, CA). The SCX end was fitted with immobilized Kasil 1624 (PQ Corporation, Valley forge, PA). After desalting for 1 hr, a 100 μm I.D. capillary (with a 5 μm-pulled tip that was packed with 15 cm of 4 μm Jupiter C12 material) was attached via a zero-dead-volume union, and the entire split-column was placed inline with an Eksigent nano high pressure liquid chromatography (HPLC) pump (Eksigent, Dublin, CA). Sample analysis was performed using a modified, ten-step multidimensional protein identification technology (MudPIT) described previously (Washburn et al. 2001). As peptides were eluted from the microcapillary column, they were electrosprayed directly into a hybrid LTQ-Orbitrap mass spectrometer (ThermoFinnigan, San Jose, CA) with application of a distal 2.4 kV spray voltage. A cycle of one full-scan mass spectrum (400-1400 m/z) followed by 6 data-dependent, pulsed Q collision induced dissociation (PQD) activated MS/MS spectra was repeated continuously throughout each step of the multidimensional separation. A total of 5×10⁴ ions were accumulated in the linear ion trap before PQD was performed. The PQD parameters were set as follows: 29% normalized collision energy, 0.55 active Q, and 0.4 millisecond activation time.
Processing of mass spectra and protein identification
MS/MS spectra were searched with the SEQUEST algorithm (Eng et al., 1994) against the European Bioinformatics Institute (EBI) mouse International Protein Index (IPI) database (version 3.52, release date November 21, 2008) concatenated to a decoy database in which the sequence for each entry in the original database was reversed. Static modification of lysine residues and the N-terminus of each peptide as the result of TMT reaction was set as 229.1629. The search results were assembled and filtered using the DTASelect program (Tabb et al., 2002) with a peptide false-positive rate of 1%. All peptides identified were at least 50% trypsinized, and precursor ion mass tolerance was set to 20 parts per million (ppm). Extraction of the reporter ion information was performed using Census software (Park et al., 2008). Based on peptide identification, the intensity of the same reporter ion (either 126 representing wt or 127 representing HIV/gp120 transgenic mice) from all MS/MS spectra matching a given peptide were summed to derive an intensity value for the peptide. At the protein level, all intensity values for each peptide were again summed to derive an intensity value for the protein.
Ingenuity bioinformatics pathway analysis
The list of differentially expressed proteins was submitted for pathway analysis using the Ingenuity Pathway Analysis tool (IPA, Ingenuity Inc.). A change of at least ±1.5-fold in protein abundance was considered significant (Park et al., 2008; Schrimpf et al., 2005; Witzman et al., 2005). These proteins were mapped to the corresponding protein/gene objects in the Ingenuity Pathways Knowledge Base and designated as focus genes. These focus genes were then used as the starting point for generating biological networks using the IPA software. Default parameters of network building were used with a maximum network size of 35 genes/proteins. The IPA software queried the Ingenuity Pathways Knowledge Base for interactions between focus genes and all other gene objects stored in the knowledge base, and generated a set of networks with associated statistics. The statistical likelihood score for each network was then computed according to the fit of our dataset. This score is derived from a P-value and indicates the likelihood of the focus genes in a network being found together due to random chance. Graphical representations of molecular relationships between genes or gene products were designated as nodes, and the biological relationship between two nodes was represented with a line. Each line was supported by literature references stored in the Ingenuity Pathways Knowledge database (www.ingenuity.com).
Immunoblot analysis
To validate differentially expressed proteins obtained by proteomic screening, Western blot analysis was conducted on isolated synaptosomes. Determination of phospho(p)Akt and Akt levels were conducted on synaptosomes from mouse cortex, cytosolic/membrane fraction of mouse forebrain, and post-mortem human cortex by Western blot analysis. Protein concentration was determined using a BCA Protein Assay (Pierce Biotechnology Inc., Rockford, IL, USA). Proteins were separated on 4-12% NU-PAGE gels (Invitrogen, Carlsbad, CA, USA) and transferred onto polyvinylidene fluoride (PVDF) membrane (Immobilon-P, Millipore). After blocking with 5% non-fat milk in Tris-buffered saline containing 0.05% Tween 20, the membranes were incubated with primary antibodies overnight at 4 °C followed by horseradish peroxidase-conjugated secondary antibody for 1 hr at RT. Protein bands were visualized with enhanced chemiluminescent detection reagents (ECL, Amersham Biosciences, GE Healthcare, Pittsburgh, PA) and exposed to X-ray film (Hyperfilm ECL, Amersham Bioscience). Autoradiographic films were scanned and densitometric analysis was performed. A Student’s t-test was used to compare pAkt/Akt levels (densitometry) between wt and HIV/gp120 transgenic animals (synaptosome/forebrain). A one-way Analysis of Variance (ANOVA) followed by post-hoc Tukey’s test was used to compare pAkt/Akt levels among HIV-, HIV+/Unimpaired and HIV+/HAND groups.
The following primary antibodies were used: rabbit polyclonal antibody against Akt, pAkt (Ser 473), pAkt (Threonine 308), Vimentin, PSD95 (Cell Signaling Technology, Beverly, MA, USA), glial fibrillary-associated protein (GFAP) (Sigma Aldrich St Louis MO), and β-arrestin (Abcam, Inc., Cambridge MA). Horseradish peroxidase-conjugated goat anti-mouse (Pierce Biotechnology, Rockford, IL, USA), Synapsin-1 (Fisher Scientific) and anti-rabbit (Biorad Hercules, CA) IgG were used as secondary antibodies.
Biotin-switch assays
To analyze S-nitrosylated protein, the biotin-switch assay was performed as described previously with modifications (Jaffrey et al., 2001). Cell lysates or brain tissue extracts were prepared in HENTS or HENC buffer (100 mM Hepes, pH 7.4, 1 mM EDTA, 0.1 mM Neocuproine, 1% Triton X-100, 0.1% SDS or 0.4% CHAPS). Approximately 300 μg of brain tissue lysate was used for each assay. Blocking buffer (2.5% SDS, 10 mM methyl methane thiosulfonate [MMTS] in HEN buffer [100 mM Hepes, pH 7.4, 1 mM EDTA, and 0.1 mM Neocuproine]) was mixed with the samples and incubated for 20 min at 50 °C with frequent vortexing to block free thiol groups. After removing excess MMTS by acetone precipitation, nitrosothiols were reduced to thiol with 20 mM ascorbate. Newly formed thiols were linked with the sulfhydryl-specific biotinylating reagent N-[6-(biotinamido)hexyl]-3’-(2’-pyridyldithio)propionamide (Biotin-HPDP). Unreacted Biotin-HPDP was removed by acetone precipitation and centrifugation, and the pellet was resuspended in 100 μl HENS (HEN plus 1.0% SDS). Two volumes of neutralization buffer (20 mM Hepes, pH 7.4, 100 mM NaCl, 1 mM EDTA, and 0.5% Triton X-100) were added, and the solution was cleared by centrifugation in order to pellet any debris not dissolved. Five to ten percent of the supernatant was used as the input for the control blot, and biotinylated proteins were pulled-down with Neutravidin-agarose beads (Pierce) from the remaining supernatant. Beads were washed five times, resuspended in 10 ml of NuPAGE LDS sample buffer (Invitrogen), boiled at 95 °C for 5 min, and subjected to immunoblot analysis.
Results
Isolation and proteomic screening of synaptosomes
We prepared synaptosomes as described in the Methods section from 13 month-old wt and HIV/gp120 transgenic mice, as evidenced by enrichment of synaptic markers (e.g., postsynaptic density protein 95 (PSD95) and pre-synaptic synapsin) in the synaptosomal fraction compared to crude homogenate (Fig. 1A). Synaptosomes were then subjected to TMT labeling and subsequent PQD multidimensional LC-MS/MS-based proteomic analysis performed in duplicate. The MS analysis detected a total of 1301 proteins, of which 107 proteins manifest a change ≥ 1.5 fold in HIV/gp120 transgenic mice compared to wt. Among these, 76 proteins manifested an increase and 31 proteins a decrease (Table 1). Three of the differentially-regulated proteins identified by this proteomic analysis were validated by Western blot analysis (Fig. 1B).
Figure 1.
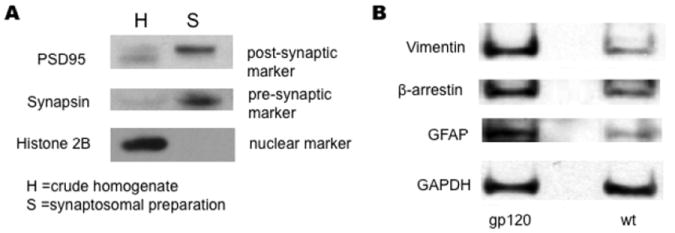
Characterization of synaptosomal isolates from wt and HIV/gp120 transgenic mice. Immunoblot analysis of synaptosomal preparations from wt and HIV/gp120 transgenic mice. (A) Synaptosomal preparations (S) from wt and HIV/gp120 transgenic animals displayed greater expression of synapsin (a presynaptic marker) and PSD95 (a post-synaptic marker) than crude homogenates (H) from these animals. The crude homogenates manifested greater expression of the nuclear marker Histone H2B than the synaptosomal fraction. (B) Synaptosomes from HIV/gp120 transgenic mice displayed greater expression of vimentin, β-arrestin, and GFAP compared to wt littermate animals. In contrast, the glycolytic enzyme GAPDH was found at similar levels in both wt and transgenic animals.
Table 1.
Proteomic fingerprint of differentially regulated proteins (≥1.5 fold) in synaptosomal isolates from HIV/gp120 transgenic mice compared to wild-type animals*
| ID | Symbol | Entrez Gene Name | Average Fold Change |
|---|---|---|---|
| Upregulated Proteins | |||
|
| |||
| IPI00649033 | GFAP | glial fibrillary acidic protein | 3.2 |
| IPI00351246 | MPP3 | membrane protein, palmitoylated 3 | 3.0 |
| IPI00277001 | PSMA4 | proteasome (prosome, macropain) subunit, alpha type, 4 | 2.7 |
| IPI00761566 | ARRB1 | arrestin, beta 1 | 2.3 |
| IPI00227299 | VIM | vimentin | 2.2 |
| IPI00474073 | MAPRE2 | microtubule-associated protein, RP/EB family, member 2 | 2.2 |
| IPI00468204 | AMPD3 | adenosine monophosphate deaminase (isoform E) | 2.1 |
| IPI00131292 | SLC22A4 | solute carrier family 22 member 4 | 2.1 |
| IPI00120798 | SYT12 | synaptotagmin XII | 2.1 |
| IPI00626662 | ALDH1A1 | aldehyde dehydrogenase 1 family, member A1 | 2.1 |
| IPI00830249 | HTRA2 | HtrA serine peptidase 2 | 2.1 |
| IPI00114801 | INPP1 | inositol polyphosphate-1-phosphatase | 2.1 |
| IPI00620701 | RABGGTA | Rab geranylgeranyltransferase, alpha subunit | 2.0 |
| IPI00845733 | PPM1H | protein phosphatase 1H (PP2C domain containing) | 2.0 |
| IPI00128945 | PSMB2 | proteasome subunit, beta type, 2 | 2.0 |
| IPI00857710 | COPS4 | COP9 constitutive photomorphogenic homolog subunit 4 | 1.9 |
| IPI00754071 | PRDX6 | peroxiredoxin 6 | 1.9 |
| IPI00830393 | COPS6 | COP9 constitutive photomorphogenic homolog subunit 6 | 1.9 |
| IPI00132250 | EIF3E | eukaryotic translation initiation factor 3, subunit E | 1.9 |
| IPI00762185 | MPST | mercaptopyruvate sulfurtransferase | 1.9 |
| IPI00224045 | CHAT | choline acetyltransferase | 1.8 |
| IPI00894579 | PGD | phosphogluconate dehydrogenase | 1.8 |
| IPI00331745 | LXN | latexin | 1.8 |
| IPI00116138 | HARS2 | histidyl-tRNA synthetase 2, mitochondrial | 1.8 |
| IPI00857222 | OXNAD1 | oxidoreductase NAD-binding domain containing 1 | 1.8 |
| IPI00608064 | FECH | ferrochelatase (protoporphyria) | 1.7 |
| IPI00876210 | CNIH3 | cornichon homolog 3 | 1.7 |
| IPI00310105 | PTK2B | PTK2B protein tyrosine kinase 2 beta | 1.7 |
| IPI00132575 | COTL1 | coactosin-like 1 (Dictyostelium) | 1.7 |
| IPI00126048 | PSMD13 | proteasome 26S subunit, non-ATPase, 13 | 1.7 |
| IPI00405121 | UNC13A | unc-13 homolog A | 1.7 |
| IPI00225961 | PHGDH | phosphoglycerate dehydrogenase | 1.7 |
| IPI00649885 | ACADVL | acyl-Coenzyme A dehydrogenase, very long chain | 1.7 |
| IPI00323349 | TJP2 | tight junction protein 2 (zona occludens 2) | 1.7 |
| IPI00469268 | CCT8 | chaperonin containing TCP1, subunit 8 (theta) | 1.7 |
| IPI00317309 | ANXA5 | annexin A5 | 1.7 |
| IPI00875497 | CRAT | carnitine acetyltransferase | 1.7 |
| IPI00284521 | DOCK3 | dedicator of cytokinesis 3 | 1.7 |
| IPI00112630 | GLOD4 | glyoxalase domain containing 4 | 1.6 |
| IPI00460631 | ICA1 | islet cell autoantigen 1 | 1.6 |
| IPI00454082 | KIF21A | kinesin family member 21A | 1.6 |
| IPI00118821 | PAFAH1B2 | platelet-activating factor acetylhydrolase Ib, subunit 2 | 1.6 |
| IPI00624863 | PAICS | phosphoribosylaminoimidazole carboxylase, | 1.6 |
| IPI00222515 | PSMD11 | proteasome 26S subunit, non-ATPase, 11 | 1.6 |
| IPI00649914 | MCART1 | mitochondrial carrier triple repeat 1 | 1.6 |
| IPI00462789 | PSMC5 | proteasome 26S subunit, ATPase, 5 | 1.6 |
| IPI00869359 | CCDC132 | coiled-coil domain containing 132 | 1.6 |
| IPI00421218 | TLN2 | talin 2 | 1.6 |
| IPI00223497 | PDE1A | phosphodiesterase 1A, calmodulin-dependent | 1.6 |
| IPI00130225 | SNX4 | sorting nexin 4 | 1.6 |
| IPI00553576 | ABCD3 | ATP-binding cassette, sub-family D (ALD), member 3 | 1.6 |
| IPI00322312 | ARHGDIA | Rho GDP dissociation inhibitor (GDI) alpha | 1.6 |
| IPI00845557 | CTBP1 | C-terminal binding protein 1 | 1.6 |
| IPI00755161 | OSBP | oxysterol binding protein | 1.6 |
| IPI00884508 | SLC2A1 | solute carrier family 2, member 1 | 1.6 |
| IPI00648173 | CLTC | clathrin, heavy chain (Hc) | 1.5 |
| IPI00759948 | GSN | gelsolin (amyloidosis, Finnish type) | 1.5 |
| IPI00116112 | DCTN2 | dynactin 2 (p50) | 1.5 |
| IPI00751036 | EXOC1 | exocyst complex component 1 | 1.5 |
| IPI00135345 | NUDT2 | nudix (nucleoside diphosphate linked moiety X)-type motif 2 | 1.5 |
| IPI00379202 | LOC1001 | similar to kinase D-interacting substrate 220 | 1.5 |
| IPI00330523 | PCCA | propionyl Coenzyme A carboxylase, alpha polypeptide | 1.5 |
| IPI00889265 | NCDN | neurochondrin | 1.5 |
| IPI00467223 | NCKIPSD | NCK interacting protein with SH3 domain | 1.5 |
| IPI00169524 | TRHDE | thyrotropin-releasing hormone degrading enzyme | 1.5 |
| IPI00341302 | C8ORF38 | chromosome 8 open reading frame 38 | 1.5 |
| IPI00312752 | SH3GL1 | SH3-domain GRB2-like 1 | 1.5 |
| IPI00756786 | SH3GLB2 | SH3-domain GRB2-like endophilin B2 | 1.5 |
| IPI00131695 | ALB | albumin | 1.5 |
| IPI00317711 | HSPA4L | heat shock 70kDa protein 4-like | 1.5 |
| IPI00116277 | CCT4 | chaperonin containing TCP1, subunit 4 (delta) | 1.5 |
| IPI00331174 | CCT7 | chaperonin containing TCP1, subunit 7 (eta) | 1.5 |
| IPI00229893 | MARK4 | MAP/microtubule affinity-regulating kinase 4 | 1.5 |
| IPI00314467 | PSMB3 | proteasome subunit, beta type, 3 | 1.5 |
| IPI00114279 | SLC1A3 | solute carrier family 1 member 3 | 1.5 |
| IPI00473685 | USP14 | ubiquitin specific peptidase 14 (tRNA-guanine transglycosylase) | 1.5 |
| Downregulated Proteins | |||
| IPI00554917 | CLCN6 | chloride channel 6 | -2.7 |
| IPI00315794 | CYB5B | cytochrome b5 type B | -2.5 |
| IPI00553357 | KIAA0368 | KIAA0368 | -2.5 |
| IPI00649734 | CROCC | rootletin | -2.4 |
| IPI00117986 | SLC12A9 | solute carrier family 12 (K+/Cl- transporters) | -2.1 |
| IPI00462406 | PITPNM2 | phosphatidylinositol transfer protein, membrane-associated 2 | -2.1 |
| IPI00338327 | NDRG3 | NDRG family member 3 | -2.0 |
| IPI00420535 | ISLR2 | immunoglobulin superfamily containing leucine-rich repeat 2 | -1.9 |
| IPI00337980 | RAB21 | RAB21, member RAS oncogene family | -1.9 |
| IPI00121378 | ALCAM | activated leukocyte cell adhesion molecule | -1.9 |
| IPI00658743 | APOO | apolipoprotein O | -1.8 |
| IPI00319973 | PGRMC1 | progesterone receptor membrane component 1 | -1.8 |
| IPI00914696 | ILDR2 | immunoglobulin-like domain containing receptor 2 | -1.7 |
| IPI00133006 | NDUFAB1 | NADH dehydrogenase (ubiquinone) 1, | -1.7 |
| IPI00652675 | LSAMP | limbic system-associated membrane protein | -1.7 |
| IPI00378120 | GLRX5 | glutaredoxin 5 | -1.7 |
| IPI00555118 | SLC4A10 | solute carrier family 4, sodium bicarbonate transporter | -1.7 |
| IPI00356063 | SCN2B | sodium channel, voltage-gated, type II, beta | -1.6 |
| IPI00125787 | GM14072 | predicted gene 14072 | -1.6 |
| IPI00466672 | CACNA1B | calcium channel, voltage-dependent, N type, alpha 1B | -1.6 |
| IPI00653706 | FAM126B | family with sequence similarity 126, member B | -1.5 |
| IPI00461629 | FXN | frataxin | -1.5 |
| IPI00622742 | CAPN2 | calpain 2, (m/II) large subunit | -1.5 |
| IPI00551399 | EFR3A | EFR3 homolog A | -1.5 |
| IPI00129298 | PALM | paralemmin | -1.5 |
| IPI00127447 | SCARB2 | scavenger receptor class B, member 2 | -1.5 |
| IPI00881362 | ZFPL1 | zinc finger protein-like 1 | -1.5 |
| IPI00323809 | PALM | paralemmin | -1.5 |
| IPI00461730 | PGAM5 | phosphoglycerate mutase family member 5 | -1.5 |
| IPI00331284 | VTI1B | vesicle transport through interaction with t-SNAREs 1B | -1.5 |
| IPI00331463 | ATPIF1 | ATPase inhibitory factor 1 | -1.5 |
A positive-fold change indicates an increase and a negative-fold change indicates a decrease in the indicated protein in HIV/gp120 mice.
Ingenuity pathway analysis of differentially regulated proteins
We next examined the potential biological signaling networks underlying the differential proteomic profile with a dynamic pathway-modeling tool, Ingenuity Pathway Analysis (IPA), which is commonly used on proteomics data sets. In this standard analysis, cutoffs for protein level changes between wt and transgenic mice were made by considering that most proteins do not show any change, many-fold changes in protein levels likely represent biological significance, and at least fifty proteins must show significant fold-changes in a pathway in order to identify a pathway of potential interest. Published work and our initial analysis revealed that plotting fold-change (FCH) values showed a sharp drop in the number of proteins identified when FCH > |1.5|. The 1.5 FCH cutoff corresponds to approximately 1.25 standard deviations from the mean, and the sharply reduced number of proteins fitting this criterion is consistent with the notion that this cutoff may represent a biologically significant change. The proteins manifesting > 1.5-fold change in HIV/gp120 transgenic mice compared to wt were therefore identified to be of interest and their corresponding genes selected for IPA. The IPA module then plotted the corresponding gene networks (see Methods). The highest scoring (most statistically significant) network generated by IPA revealed involvement of PI3K/Akt pathway for the differential protein profile of HIV/gp120 mice synaptosomes compared to their age matched wt controls (Fig. 2).
Figure 2.
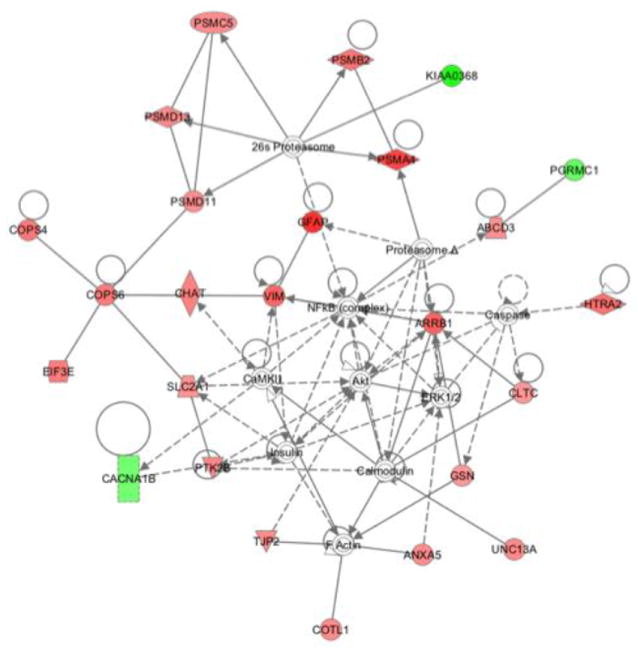
Ingenuity pathway analysis of differentially regulated proteins. Pathway/network modeling of the synaptosomal proteome was determined by integration of our protein/gene data into Ingenuity Pathway Analysis software. Pathway analysis demonstrated direct or indirect involvement of the Akt cascade with the various differentially regulated proteins. Lines indicate known interactions (collected in Ingenuity Pathways Knowledge Base) among various proteins. The lines with arrowheads represent direct interactions. Solid lines with arrowheads show direct interaction, while broken arrowhead lines show indirect interaction. Lines without arrowheads indicate binding. Nodes are represented by shapes and colors. Protein function is indicated by shape: diamonds for enzymes, squares for cytokines, rectangles for ligand-dependant nuclear factors, triangles for kinases, ovals for transcriptional regulators, trapezoids for transporters, and circles for other types of actions. Red nodes represent the synaptosomal proteins we found to be upregulated in HIV/gp120 mouse brain, while the green nodes represent downregulated proteins. Nodes without color represent proteins not from our list, but interpreted by the database as highly probable interactions within the network. Abbreviations: ABCD3: ATP-binding cassette, sub-family D (ALD), member 3; ANXA5: annexin A5; ARRB1: arrestin, beta 1; CACNA1B: calcium channel, voltage-dependent, N type, alpha 1B; CaMKII: Calcium dependent protein kinase II; CHAT: choline acetyltransferase; CLTC: clathrin, heavy chain (Hc); COPS4: COP9 constitutive photomorphogenic homolog subunit 4; COPS6: COP9 constitutive photomorphogenic homolog subunit 6; COTL1: coactosin-like 1; EIF3E: (Dictyostelium) eukaryotic translation initiation factor 3 subunit E; GFAP: glial fibrillary acidic protein; GSN: gelsolin; HTRA2: HtrA serine peptidase 2; KIAA0368: Proteasome-associated protein ECM29 homolog; NFκB (complex): Nuclear factor κB; PGRMC1: progesterone receptor membrane component 1; PSMA4: proteasome subunit, alpha type, 4; PSMB2:proteasome subunit, beta type; 2PSMC5:proteasome 26S subunit, ATPase; PSMD11:proteasome 26S subunit, non-ATPase 11; PSMD13: proteasome 26S subunit, non-ATPase, 13; PTK2B: PTK2B protein tyrosine kinase 2 β; SLC2A1: solute carrier family 2 (facilitated glucose transporter); TJP2: tight junction protein 2; UNC13A: unc-13 homolog A; VIM: vimentin.
Relationship of Akt and HIV-associated neurocognitive disorders (HAND)
We next examined the levels of pAkt/Akt in HIV/gp120 transgenic mouse brain and in human postmortem brains from HIV+ individuals with and without HAND vs. controls. Synaptosomes from HIV/gp120 transgenic mice manifested a significant (P < 0.04) decrease in the level of pAkt/Akt compared to wt controls (Fig. 3A). Additionally, we performed a similar analysis on mouse brain cytosolic lysates prepared from frontal cortex and again observed a significant (P < 0.01, n = 3) decrease in pAkt/Akt compared to age-matched littermate control mice (Fig. 3B). We then conducted similar experiments on human frontal cortex obtained relatively rapidly postmortem from normal CNS, HIV+/neuropsychologically unimpaired, and HIV+/impaired (HAND) patients (Table 2). The diagnosis of HAND was determined by Neuropsychological testing during life, and the brains were also examined postmortem for neuropathological correlates of disease (Cherner et al., 2002; Garden et al., 2002; Moore et al., 2006; Schifitto et al., 2007). Brains from HIV-/cognitively unimpaired patients displayed a significant increase in pAkt/Akt levels compared to the HIV+/cognitively unimpaired and HAND groups, with the largest decrease in pAkt manifested in the HAND brains (Fig. 3C). A decrease in Akt enzymatic activity is known to be associated with neuronal cell injury and death; to account for the inhibition in enzyme activity, in addition to a decrease in pAkt, in HIV/gp120 mouse brains and human HAND brains we also found an increase in S-nitrosylation of Akt, which has also been shown to inhibit Akt activity (Yasukawa et al., 2005; Numajiri et al., 2011). To monitor the levels of S-nitrosylated Akt (forming SNO-Akt), we performed biotin-switch assays on brain lysates from HIV/gp120 mice and human HAND patients. Both sets of tissues revealed significant increases in SNO-Akt protein compared to controls (Fig. 4). These proteomic results are consistent with the notion that decreased Akt activity might be associated with the pathogenesis of HAND.
Figure 3.
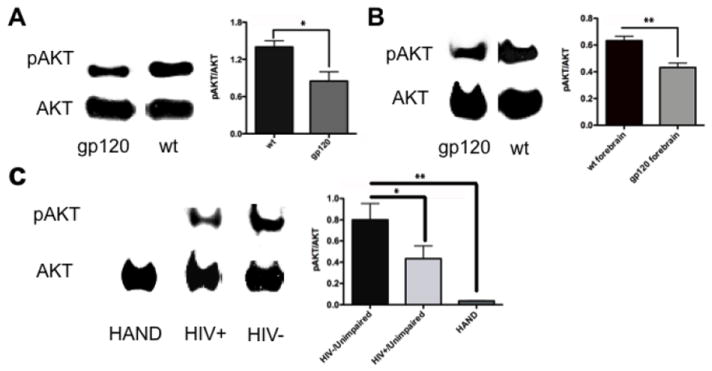
Downregulation of pAkt levels in HIV/gp120 transgenic mice and human HIV-1 brains. Immunoblot and densitometric estimates of pAkt/Akt levels. (A) Synaptosomes of HIV/gp120 transgenic mice showed a significant decrease in pAkt/Akt levels compared to wt littermate animals. (B) Forebrain of HIV/gp120 transgenic mice also showed a significant reduction in pAkt/Akt levels compared to wt animals. (C) pAkt/total Akt ratio in frontal cortex of patients who were normal/HIV- (and unimpaired on neuropsychological testing), HIV+/unimpaired, and HIV+/HAND. Only the subjects with HAND showed a significant reduction in pAkt/Akt levels. Note that pAkt/Akt ratio tracked more closely with neuropsychological scores than with neuropathological assessments (Table 2). Values in histograms are mean + S.E.M. from n ≥3 experiments (*P < 0.05, ** P < 0.01).
Table 2.
Patient characteristics of cases evaluated for pAKT and SNO-Akt levels
| Group | AGE | SEX | Post-mortem Interval | Neuropathology | GDS | Neuropsychology |
|---|---|---|---|---|---|---|
| Normal/(HIV-) | 63 | Female | 8 | Normal | N/A | Unknown |
| Normal//(HIV-) | 69 | Male | 24 | Normal | N/A | Unknown |
| Normal/(HIV-) | 71 | Male | 2 | Normal | N/A | Unknown |
| HIV+ | 51 | Male | 17 | Normal | <0.5 | Normal |
| HIV+ | 59 | Female | 15 | HIV encephalitis | <0.5 | Normal |
| HIV+ | 40 | Male | 13 | Microglial nodule encephalitis | <0.5 | Normal |
| HIV+ | 50 | Male | 15 | Normal | 0.67 | MCMD |
| HIV+ | 55 | Male | 15 | HIV encephalitis | 2.37 | HAD |
| HIV+ | 51 | Male | 48 | HIV encephalitis, Leukoencephalopathy | 2.94 | HAD |
HIV+: HIV-1 infected
HAD: HIV-associated dementia
MCMD: Minor cognitive and motor disorder
(HAD represents severe and MCMD represents mild forms of HAND)
GDS: Global Deficit score; >0.5 is a criterion for HAND
Brain region used: Frontal cortex
Figure 4.
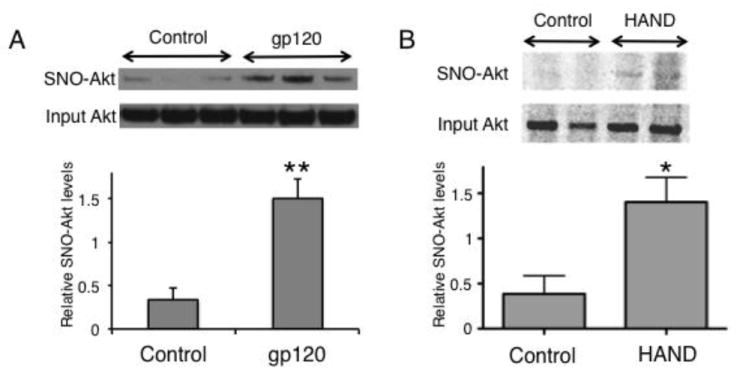
S-nitrosylation of Akt is increased in HIV/gp120 mouse and human HAND brains. (A) HIV/gp120 mouse brain lysates were analyzed for S-nitrosylated (SNO)-Akt using the biotin-switch technique. Control lysates were from wt littermates (n = 6; **P < 0.01 by t-test). (B) Lysates from human brain autopsy tissue of patients with HAND or non-neurological conditions (Controls) were analyzed by the biotin-switch technique for SNO-Akt (n = 8; *P < 0.02 by t-test).
Discussion
In the present study, using TMT tags and multidimensional LC-MS/MS, we identified 1301 proteins in the synaptosomal compartment of the brains of HIV/gp120 transgenic and wt littermate control mice. Among these 1301 proteins, 107 showed a greater than 1.5-fold change in the HIV/gp120 transgenic mice compared to the wt controls. Confirming the validity of our techniques, we found a number of neuronal and synapse-specific proteins, including vesicle-associated membrane protein (VAMP/synaptobrevin), syntaxin, synaptotagmin, synapsin I and annexin II (see Table S1), as reported previously in other proteomic studies of synaptosomes (Witzman et al., 2005). Prior screening studies of synaptosomes using isotope-coded affinity tags, however, have also shown some contamination by astrocytes (Schrimpf et al., 2005). Similarly, we found evidence of astrocytic markers, including GFAP and vimentin (Table 1). In fact, in line with the known astrogliosis that represents a neuropathological hallmark of HAND, we found that GFAP was quite significantly upregulated in HIV/gp120 transgenic mouse brain compared to control.
In order to determine the biochemical pathway(s) responsible for the differential proteomic profile in HIV/gp120 transgenic mice versus wt control littermates, we used bioinformatics pathway analysis tools. This analysis revealed that the pathway with the highest score, and thus most affected in HIV/gp120 transgenic brains, involved dysregulation in the PI3K/Akt cascade. We then confirmed these findings using immunoblot analysis on synaptosomes and forebrain lysates from HIV/gp120 transgenic mice as well as from human cortex from patients with and without HAND. As expected from samples from a heterogeneous population, the pAkt levels of autopsy brain showed minor variations within each group, which may also be affected by post-mortem intervals, other opportunistic infections in HIV+ cases or stage of HAND. These assays revealed a strong correlation between decreased Akt activity/phosphorylation and the development of HAND (Fig. 3C). Thus, these results suggest that activation of the PI3K/Akt pathway could be potentially neuroprotective in HAND.
Along these lines, we and our colleagues have previously demonstrated pAkt-mediated neuroprotection in both in vitro and in vivo models of HAND (Digicaylioglu et al. 2004a; Kang et al. 2010). In this context, we have shown that synergistic activation of the PI3K/Akt pathway by erythropoietin (EPO) and insulin-like growth factor I (IGF-I) activates a number of neuroprotective pathways, including phosphorylation of glycogen synthase kinase (GSK) 3β with consequent inhibition of tau protein hyperphosporylation, inhibition of forkhead transcription factor, and activation of inhibitory proteins of apoptosis (Digicaylioglu and Lipton, 2001; Digicaylioglu et al., 2004b; Kang et al., 2010). Additionally, pAkt can phosphorylate and thereby inactivate human caspase-9. Because caspase-9 is a major activator of effector caspase-3, this action of pAkt may also contribute to neuroprotection (Kermer et al., 2000; Nitta et al., 2004; Thorne et al., 2004).
Moreover, to show causality of these effects, recently in the HIV/gp120 transgenic mouse model, we demonstrated that activation of the PI3K/Akt pathway in the brain decreases tau hyperphosphorylation and affords neuroprotection (Kang et al., 2010). pAkt also activates the downstream transcription factor target, NF-κB (Borderies et al., 2004; Digicaylioglu and Lipton, 2001), an effect that has been implicated in chemokine CCL2 and fractalkine-mediated neuroprotection in HAND (Meucci et al., 2000; Yao et al., 2009).
Taken together with prior work, our current findings support the notion that downregulation of the Akt pathway may be involved in the pathogenesis of HAND and suggest that targeted activation of Akt might be neuroprotective in this disorder. Within the complex regulation of Akt activation, autophosphorylation appears to play a significant role (Li et al., 2006). Our finding that SNO-Akt is significantly elevated in HIV/gp120 mouse brains and human HAND brains represents a potential mechanism for the pathological decrease in Akt activity observed in our studies since this would result in a decrement in autophosphorylation.
In conclusion, we show that the HIV/gp120 mouse is a valid model for the discovery of pathophysiologically relevant pathways in HIV-related dementias. This work also emphasizes the importance of proteomic techniques, such as TMT, which in combination with bioinformatics tools can enhance our understanding of complex signaling crosstalk in animal models of neurodegenerative disorders. Our use of these techniques has demonstrated that the web of Akt pathways are potentially important targets for development of therapies for HAND and perhaps other dementias.
Supplementary Material
Highlights.
>Synaptosomes from HIV/gp12 Tg mice tandem mass tag labeled for MS/MS analysis. >Akt pathway identified as suppressed in HIV/gp12 Tg brains. > Akt pathway also suppressed in human HIV associated neurocognitive disorders (HAND). >Akt is S-nitrosylated in HIV/gp120 and HAND brain. >MS/MS and pathway analysis is means to identify potential drug targets in disease.
Acknowledgments
This work was supported in part by NIH grants P01 HD29587, P01 ES016738, R01 NS047973, R01 EY09024, and Neuroscience Blueprint Core Grant P30 NS057096.
Abbreviations
- HAND
HIV-associated neurocognitive disorders
- TMT
tandem mass tag
- MS/MS
tandem mass spectrometry
- PQD
pulsed-Q dissociation
- HAART
Highly-Active Antiretroviral Therapy
- ICAT
Isotope Coded Affinity Tag
- PSD95
postsynaptic density protein 95
Footnotes
Supplementary materials related to this article can be found online at doi:xxxxxx/j.expneurol.xxxxxxxxxxx.
The authors declare that they have no competing interests.
Publisher's Disclaimer: This is a PDF file of an unedited manuscript that has been accepted for publication. As a service to our customers we are providing this early version of the manuscript. The manuscript will undergo copyediting, typesetting, and review of the resulting proof before it is published in its final citable form. Please note that during the production process errors may be discovered which could affect the content, and all legal disclaimers that apply to the journal pertain.
References
- Borderies G, le Bechec M, Rossignol M, Lafitte C, Le Deunff E, Beckert M, Dumas C, Elisabeth MR. Characterization of proteins secreted during maize microspore culture: arabinogalactan proteins (AGPs) stimulate embryo development. Eur J Cell Biol. 2004;83:205–212. doi: 10.1078/0171-9335-00378. [DOI] [PubMed] [Google Scholar]
- Carlin RK, Grab DJ, Cohen RS, Siekevitz P. Isolation and characterization of postsynaptic densities from various brain regions: enrichment of different types of postsynaptic densities. J Cell Biol. 1980;86:831–845. doi: 10.1083/jcb.86.3.831. [DOI] [PMC free article] [PubMed] [Google Scholar]
- Che FY, Fricker LD. Quantitative peptidomics of mouse pituitary: comparison of different stable isotopic tags. J Mass Spectrom. 2005;40:238–249. doi: 10.1002/jms.743. [DOI] [PubMed] [Google Scholar]
- Cherner M, Masliah E, Ellis RJ, Marcotte TD, Moore DJ, Grant I, Heaton RK. Neurocognitive dysfunction predicts postmortem findings of HIV encephalitis. Neurology. 2002;59:1563–1567. doi: 10.1212/01.wnl.0000034175.11956.79. [DOI] [PubMed] [Google Scholar]
- Cohen SA, Fischbach GD. Clusters of acetylcholine receptors located at identified nerve-muscle synapses in vitro. Dev Biol. 1977;59:24–38. doi: 10.1016/0012-1606(77)90237-8. [DOI] [PubMed] [Google Scholar]
- Digicaylioglu M, Lipton SA. Erythropoietin-mediated neuroprotection involves cross-talk between Jak2 and NF-kappaB signalling cascades. Nature. 2001;412:641–647. doi: 10.1038/35088074. [DOI] [PubMed] [Google Scholar]
- Digicaylioglu M, Kaul M, Fletcher L, Dowen R, Lipton SA. Erythropoietin protects cerebrocortical neurons from HIV-1/gp120-induced damage. Neuroreport. 2004a;15:761–763. doi: 10.1097/00001756-200404090-00004. [DOI] [PubMed] [Google Scholar]
- Digicaylioglu M, Garden G, Timberlake S, Fletcher L, Lipton SA. Acute neuroprotective synergy of erythropoietin and insulin-like growth factor I. Proc Natl Acad Sci U S A. 2004b;101:9855–9860. doi: 10.1073/pnas.0403172101. [DOI] [PMC free article] [PubMed] [Google Scholar]
- Eng JM, McCormack AL, Yates JR., III An approach to correlate tandem mass spectral data of peptides with amino acid sequences in a protein database. J Am Soc Mass Spectrom. 1994;5:976–989. doi: 10.1016/1044-0305(94)80016-2. [DOI] [PubMed] [Google Scholar]
- Garden GA, Budd SL, Tsai E, Hanson L, Kaul M, D’Emilia DM, Friedlander RM, Yuan J, Masliah E, Lipton SA. Caspase cascades in human immunodeficiency virus-associated neurodegeneration. J Neurosci. 2002;22:4015–4024. doi: 10.1523/JNEUROSCI.22-10-04015.2002. [DOI] [PMC free article] [PubMed] [Google Scholar]
- Gorantla S, Liu J, Sneller H, Dou H, Holguin A, Smith L, Ikezu T, Volsky DJ, Poluektova L, Gendelman HE. Copolymer-1 induces adaptive immune anti-inflammatory glial and neuroprotective responses in a murine model of HIV-1 encephalitis. J Immunol. 2007;179:4345–4356. doi: 10.4049/jimmunol.179.7.4345. [DOI] [PubMed] [Google Scholar]
- Gygi SP, Rist B, Gerber SA, Turecek F, Gelb MH, Aebersold R. Quantitative analysis of complex protein mixtures using isotope-coded affinity tags. Nat Biotechnol. 1999;17:994–999. doi: 10.1038/13690. [DOI] [PubMed] [Google Scholar]
- Hansson E, Ronnback L. Glial neuronal signaling in the central nervous system. FASEB J. 2003;17:341–348. doi: 10.1096/fj.02-0429rev. [DOI] [PubMed] [Google Scholar]
- Jaffrey SR, Erdjument-Bromage H, Ferris CD, Tempst P, Snyder SH. Protein S-nitrosylation: a physiological signal for neuronal nitric oxide. Nat Cell Biol. 2001;3:193–197. doi: 10.1038/35055104. [DOI] [PubMed] [Google Scholar]
- Kang YJ, Digicaylioglu M, Russo R, Kaul M, Achim CL, Fletcher L, Masliah E, Lipton SA. Erythropoietin plus insulin-like growth factor-I protects against neuronal damage in a murine model of human immunodeficiency virus-associated neurocognitive disorders. Ann Neurol. 2010;68:342–352. doi: 10.1002/ana.22070. [DOI] [PMC free article] [PubMed] [Google Scholar]
- Kaul M, Ma Q, Medders KE, Desai MK, Lipton SA. HIV-1 coreceptors CCR5 and CXCR4 both mediate neuronal cell death but CCR5 paradoxically can also contribute to protection. Cell Death Differ. 2007;14:296–305. doi: 10.1038/sj.cdd.4402006. [DOI] [PubMed] [Google Scholar]
- Kennedy MB, Bennett MK, Erondu NE. Biochemical and immunochemical evidence that the “major postsynaptic density protein” is a subunit of a calmodulin-dependent protein kinase. Proc Natl Acad Sci U S A. 1983;80:7357–7361. doi: 10.1073/pnas.80.23.7357. [DOI] [PMC free article] [PubMed] [Google Scholar]
- Kermer P, Klocker N, Labes M, Bahr M. Insulin-like growth factor-I protects axotomized rat retinal ganglion cells from secondary death via PI3-K-dependent Akt phosphorylation and inhibition of caspase-3 In vivo. J Neurosci. 2000;20:2–8. [PubMed] [Google Scholar]
- Kolson DL. Neuropathogenesis of central nervous system HIV-1 infection. Clin Lab Med. 2002;22:703–717. doi: 10.1016/s0272-2712(02)00009-4. [DOI] [PubMed] [Google Scholar]
- Li X, Lu Y, Jin W, Liang K, Mills GB, Fan Z. Autophosphorylation of Akt at Threonine 72 and Serine 246: A potential mechanism of regulation of Akt kinase activity. J Biol Chem. 2006;281:13837–13843. doi: 10.1074/jbc.M602060200. [DOI] [PubMed] [Google Scholar]
- McArthur JC. HIV dementia: an evolving disease. J Neuroimmunol. 2004;157:3–10. doi: 10.1016/j.jneuroim.2004.08.042. [DOI] [PubMed] [Google Scholar]
- McArthur JC, Steiner J, Sacktor N, Nath A. Human immunodeficiency virus-associated neurocognitive disorders: Mind the gap. Ann Neurol. 2010;67:699–714. doi: 10.1002/ana.22053. [DOI] [PubMed] [Google Scholar]
- Meucci O, Fatatis A, Simen AA, Miller RJ. Expression of CX3CR1 chemokine receptors on neurons and their role in neuronal survival. Proc Natl Acad Sci U S A. 2000;97:8075–8080. doi: 10.1073/pnas.090017497. [DOI] [PMC free article] [PubMed] [Google Scholar]
- Moore DJ, Masliah E, Rippeth JD, Gonzalez R, Carey CL, Cherner M, Ellis RJ, Achim CL, Marcotte TD, Heaton RK, Grant I. Cortical and subcortical neurodegeneration is associated with HIV neurocognitive impairment. AIDS. 2006;20:879–887. doi: 10.1097/01.aids.0000218552.69834.00. [DOI] [PubMed] [Google Scholar]
- Numajiri N, Takasawa K, Nishiya T, Hayakawa W, Asada M, Matsuda H, Azumi K, Tanaka H, Hyakkoku K, Kamata H, Nakamura T, Hara H, Minami M, Lipton SA, Uehara T. On-off system for PI3-kinase-Akt signaling through S-nitrosylation of phosphatase with sequence homology to tensin (PTEN) Proc Natl Acad Sci USA. 2011;108:10349–10354. doi: 10.1073/pnas.1103503108. [DOI] [PMC free article] [PubMed] [Google Scholar]
- Nitta A, Zheng WH, Quirion R. Insulin-like growth factor 1 prevents neuronal cell death induced by corticosterone through activation of the PI3k/Akt pathway. J Neurosci Res. 2004;76:98–103. doi: 10.1002/jnr.20057. [DOI] [PubMed] [Google Scholar]
- Park SK, Venable JD, Xu T, Yates JR., III A quantitative analysis software tool for mass spectrometry-based proteomics. Nat Methods. 2008;5:319–322. doi: 10.1038/nmeth.1195. [DOI] [PMC free article] [PubMed] [Google Scholar]
- Potula R, Poluektova L, Knipe B, Chrastil J, Heilman D, Dou H, Takikawa O, Munn DH, Gendelman HE, Persidsky Y. Inhibition of indoleamine 2,3-dioxygenase (IDO) enhances elimination of virus-infected macrophages in an animal model of HIV-1 encephalitis. Blood. 2005;106:2382–2390. doi: 10.1182/blood-2005-04-1403. [DOI] [PMC free article] [PubMed] [Google Scholar]
- Ross A, Kessler W, Krumme D, Menge U, Wissing J, van den Heuvel J, Flohe L. Optimised fermentation strategy for 13C/15N recombinant protein labelling in Escherichia coli for NMR-structure analysis. J Biotechnol. 2004;108:31–39. doi: 10.1016/j.jbiotec.2003.10.014. [DOI] [PubMed] [Google Scholar]
- Schifitto G, Navia BA, Yiannoutsos CT, Marra CM, Chang L, Ernst T, Jarvik JG, Miller EN, Singer EJ, Ellis RJ, Kolson DL, Simpson D, Nath A, Berger J, Shriver SL, Millar LL, Colquhoun D, Lenkinski R, Gonzalez RG, Lipton SA. Memantine and HIV-associated cognitive impairment: a neuropsychological and proton magnetic resonance spectroscopy study. AIDS. 2007;21:1877–1886. doi: 10.1097/QAD.0b013e32813384e8. [DOI] [PubMed] [Google Scholar]
- Schrimpf SP, Meskenaite V, Brunner E, Rutishauser D, Walther P, Eng J, Aebersold R, Sonderegger P. Proteomic analysis of synaptosomes using isotope-coded affinity tags and mass spectrometry. Proteomics. 2005;5:2531–2541. doi: 10.1002/pmic.200401198. [DOI] [PubMed] [Google Scholar]
- Tabb DL, McDonald WH, Yates JR., III DTASelect and Contrast: tools for assembling and comparing protein identifications from shotgun proteomics. J Proteome Res. 2002;1:21–26. doi: 10.1021/pr015504q. [DOI] [PMC free article] [PubMed] [Google Scholar]
- Thorne RG, Pronk GJ, Padmanabhan V, Frey WH., II Delivery of insulin-like growth factor-I to the rat brain and spinal cord along olfactory and trigeminal pathways following intranasal administration. Neuroscience. 2004;127:481–496. doi: 10.1016/j.neuroscience.2004.05.029. [DOI] [PubMed] [Google Scholar]
- Toggas SM, Masliah E, Rockenstein EM, Rall GF, Abraham CR, Mucke L. Central nervous system damage produced by expression of the HIV-1 coat protein gp120 in transgenic mice. Nature. 1994;367:188–193. doi: 10.1038/367188a0. [DOI] [PubMed] [Google Scholar]
- Washburn MP, Wolters D, Yates JR., III Large-scale analysis of the yeast proteome by multidimensional protein identification technology. Nat Biotechnol. 2001;19:242–247. doi: 10.1038/85686. [DOI] [PubMed] [Google Scholar]
- Witzman FA, Arnold RJ, Bai F, Hrncirova P, Kimpel MW, Mechref YS, McBride WJ, Novotny MV, Pedrick NM, Ringham HN, Simon JR. A proteomic survey of rat cerebral cortical synaptosomes. Proteomics. 2005;5:2177–2201. doi: 10.1002/pmic.200401102. [DOI] [PMC free article] [PubMed] [Google Scholar]
- Yao H, Peng F, Dhillon N, Callen S, Bokhari S, Stehno-Bittel L, Ahmad SO, Wang JQ, Buch S. Involvement of TRPC channels in CCL2-mediated neuroprotection against tat toxicity. J Neurosci. 2009;29:1657–1669. doi: 10.1523/JNEUROSCI.2781-08.2009. [DOI] [PMC free article] [PubMed] [Google Scholar]
- Yasukawa T, Tokunaga E, Ota H, Sugita H, Martyn JA, Kaneki M. S-Nitrosylation-dependent inactivation of Akt/protein kinase B in insulin resistance. J Biol Chem. 2005;280:7511–7518. doi: 10.1074/jbc.M411871200. [DOI] [PubMed] [Google Scholar]
Associated Data
This section collects any data citations, data availability statements, or supplementary materials included in this article.