

Abstract
B cell antigen receptor (BCR) signaling regulates the activities and fates of B cells. BCR signaling encompasses two feedback loops emanating from Lyn and Fyn, which are Src-family protein tyrosine kinases (SFKs). Positive feedback arises from SFK-mediated trans phosphorylation of BCR and receptor-bound Lyn and Fyn, which increases the kinase activities of Lyn and Fyn. Negative feedback arises from SFK-mediated cis phosphorylation of the transmembrane adapter protein PAG1, which recruits the cytosolic protein tyrosine kinase Csk to the plasma membrane, where it acts to decrease the kinase activities of Lyn and Fyn. To study the effects of the positive and negative feedback loops on the dynamical stability of BCR signaling and the relative contributions of Lyn and Fyn to BCR signaling, we consider here a rule-based model for early events in BCR signaling that encompasses membrane-proximal interactions of six proteins: BCR, Lyn, Fyn, Csk, PAG1 and Syk, a cytosolic protein tyrosine kinase that is activated as a result of SFK-mediated phosphorylation of BCR. The model is consistent with known effects of Lyn and Fyn deletions. We find that BCR signaling can generate a single pulse or oscillations of Syk activation depending on the strength of antigen signal and the relative levels of Lyn and Fyn. We also show that bistability can arise in Lyn or Csk deficient cells.
Keywords: Immunoreceptor signaling, Signal transduction, Combinatorial complexity, Bifurcation analysis, BioNetGen, Rule-based modeling
Introduction
The B cell antigen receptor (BCR) is responsible for antigen recognition and antigen-induced proliferation and differentiation of mature B cells (1). The BCR is a multimeric protein composed of membrane immunoglobulin (mIg) and CD79, a heterodimer of transmembrane disulfide-linked signaling chains, Ig-α (CD79A) and Ig-β (CD79B). The mIg subunit recognizes intact extracellular antigens, and the Ig-α/β heterodimer interacts with signaling proteins. The intracellular tails of Ig-α and Ig-β each contain an immunoreceptor tyrosine-based activation motif (ITAM) (2). These ITAMs each contain two conserved tyrosine residues, which are substrates of Src-family protein tyrosine kinases (SFKs) and Syk (3-5). In immunoreceptor signaling, ITAM phosphotyrosines serve as docking sites for single SH2 domains in SFKs and pairs of tandem SH2 domains in Syk-family protein tyrosine kinases (2). Syk and SFKs, Lyn and Fyn in particular, play important roles in early BCR signaling (6, 7), as described below.
BCR signaling (8) is initiated by interaction of the receptor with an antigen, which leads to phosphorylation of ITAM tyrosines by Lyn and Fyn, which are each tethered to the inner leaflet of the plasma membrane (7). The unique domains of Lyn and Fyn interact weakly and constitutively with the unphosphorylated Ig-α ITAM (9). Phosphorylated ITAMs interact more strongly with the SH2 domains of Lyn and Fyn. Thus, ITAM phosphorylation recruits Lyn and Fyn to receptors (9), which enables activated receptor-dependent trans phosphorylation of the activation-loop tyrosines Y397 and Y420 in receptor-bound Lyn and Fyn, respectively (10, 11). (The numbering of these residues is the same in mouse and human.) An SFK bound at its SH2 domain or phosphorylated at an activation-loop tyrosine has elevated kinase activity (12). The doubly phosphorylated Ig-β ITAM is recognized by the tandem SH2 domains of cytosolic Syk (13). Recruitment of Syk to receptors increases the kinase activity of Syk in two ways. First, Syk kinase activity increases when the SH2 domains of Syk are bound to a doubly phosphorylated ITAM (4, 14). Second, the kinase activity of Syk increases when activation-loop tyrosines (Y519 and Y520 in mouse and Y525 and Y526 in human) are autophosphorylated (13, 15, 16).
BCR signaling encompasses two feedback loops that are initiated by SFKs. A positive feedback loop is initiated upon phosphorylation of the Ig-α ITAM tyrosines. Phosphorylation of these tyrosines has a positive effect on the kinase activities of Lyn and Fyn (3, 9), as discussed above. A negative feedback loop is initiated upon SFK-mediated phosphorylation of the transmembrane adapter protein PAG1 (phosphoprotein associated with glycosphingolipid-enriched microdomains). PAG1 is also called Cbp (Csk-binding protein). The SH3 domains of Lyn and Fyn constitutively associate with proline-rich sequences (PRSs) in PAG1 (17-19). PAG1-associated Lyn and Fyn cis phosphorylate tyrosines in PAG1, which serve as docking sites for the SH2 domains of Lyn, Fyn and Csk, a cytosolic protein tyrosine kinase that negatively regulates SFKs (17-19). The SH2 domain of Lyn docks at pY386 or pY414 in mouse (pY387 or pY417 in human), and the SH2 domain of Fyn docks at pY165 or pY183 in mouse (pY163 or pY181 in human). Csk docks at pY314 in mouse (pY317 in human). At the plasma membrane, Csk phosphorylates the C-terminal regulatory tyrosines of Lyn and Fyn, Y508 and Y531 (20). (The numbering of these residues is the same in mouse and human.) The phosphorylated C-terminal regulatory tyrosine of an SFK can intramolecularly bind to the SH2 domain of the SFK, contributing to the assembly of an autoinhibited configuration of the protein’s domains, which is marked by lowered kinase activity (20, 21).
BCR signaling involves feedback loops in addition to those discussed above, such as SFK-mediated phosphorylation of CD22 and recruitment of the phosphatase SHP-1 to the membrane (22). Interestingly, Syk, like Lyn and Fyn, may also initiate both negative and positive feedback loops. Because Syk is capable of phosphorylating both ITAM tyrosines, a positive feedback loop similar to that initiated by SFKs can in principle be initiated by Syk (6). Syk initiates a negative feedback loop by catalyzing phosphorylation of S197 in Ig-α (23). However, here, we will not consider CD22-initiated, Syk-initiated, or other feedback loops further, and our focus will be on the roles of Lyn and Fyn in the positive ITAM- and negative PAG1/Csk-mediated feedback loops discussed earlier.
The relative contributions of Lyn and Fyn to BCR signaling are poorly understood. Lyn and Fyn appear to function somewhat redundantly, in that these two proteins have many common binding partners and substrates. However, deletion of the kinases suggests that they have distinct roles in BCR signaling (24) as well as in signaling by FcεRI, the high-affinity receptor for IgE antibody (25). Lyn acts both as a positive and negative regulator of BCR and FcεRI signaling (24-31). Early responses to BCR crosslinking are delayed in Lyn-deficient cells (24, 28, 29), but Lyn-deficient B cells eventually exhibit hyper-responsive proliferation and calcium signaling (27-29). In contrast, Fyn acts strictly as a positive regulator of BCR and FcεRI signaling (24, 25). Fyn deletion results in impaired proliferation of B cells (24). In bone marrow-derived mast cells (BMMCs), Fyn deletion impairs FcεRI-mediated degranulation, whereas Lyn deletion enhances degranulation (25).
One possible mechanistic reason for the differential effects of Lyn and Fyn deletion may be in the way that Lyn and Fyn interact with PAG1. Lyn and Fyn have different SH3 and SH2 domain binding sites in PAG1 (17-19). The SH2 and SH3 docking sites for Fyn are more closely spaced (26 aa) than those for Lyn (123 aa) (17-19). The close spacing of the Fyn docking sites in PAG1 may impose steric constraints on Fyn that are absent for Lyn and explain differential phosphorylation of PAG1 by Lyn and Fyn. It has been reported that Lyn alone accounts for 67-92% of PAG1 phosphorylation in response to FcεRI activation in BMMCs (30).
Here, to elucidate the dynamical consequences of the two SFK-mediated feedback loops discussed above and to investigate Lyn and Fyn redundancy, we develop and analyze a mechanistic model for early events in BCR signaling. In the model, we incorporate six signaling proteins: BCR, Lyn, Fyn, Csk, PAG1, and Syk. We formulate the model using the rule-based modeling approach, which is convenient when one is interested in tracking the site-specific details of protein-protein interactions (32). The rules of the model, which formally represent molecular interactions, are specified using the BioNetGen language (BNGL) (33, 34). BioNetGen (33, 34) is then used to obtain the biochemical reaction network and corresponding ordinary differential equations (ODEs) for mass-action kinetics implied by the rules. The well-mixed mass-action kinetics of this network are characterized by 1,122 ODEs. Despite this large number of ODEs, a consequence of combinatorial complexity (35, 36), there are essentially only 25 parameters in the model, which reflects a coarse graining of the reaction kinetics introduced by the rule-based modeling approach.
Our model is consistent with known effects of Lyn and Fyn deletion on BCR signaling. Deletion of Lyn in the model results in delayed but enhanced Syk activation, whereas deletion of Fyn impairs Syk activation. In the model, Lyn and Fyn differ in regulation of PAG1-Csk interaction. Fyn is also taken to have lower kinase activity than Lyn. These differences are sufficient to explain the distinct consequences of Lyn and Fyn deletion. The model shows that BCR signaling can produce a variety of dynamical responses to an antigen signal. Single and repeated pulses (relaxation oscillations) of Syk activation or sustained Syk activation can be produced in response to an antigen signal, depending on the strength of the signal and the relative expression levels of Lyn and Fyn. A bifurcation analysis reveals that bistability can arise if autoinhibition of Lyn is ablated, as in Lyn or PAG1 deficient cells.
Methods
We formulated a rule-based model for early events in BCR signaling. The rule-based modeling approach has been described elsewhere in detail (32, 34), but for completeness, before presenting our model, we will briefly discuss the key concepts of rule-based modeling and BNGL, which we used to specify our model.
Rule-based modeling
The BCR pathway, like other cell signaling systems, is marked by combinatorial complexity, which arises because a typical signaling protein contains multiple binding sites and/or sites of post-translational modification (35, 36). Combinatorial complexity is problematic for traditional modeling approaches, which require an explicit specification of all possible reactions in a system, or the equivalent. For a system marked by combinatorial complexity, there is a large number of possible reactions, and manual and explicit specification of these reactions is impractical, if not impossible. The rule-based approach overcomes the problem of combinatorial complexity by assuming that interactions are modular (32, 34).
A rule-based model is specified using graphs and graph-rewriting rules. Three types of graphs are used: molecule type graphs, chemical species graphs, and pattern graphs. Molecule type graphs define the types of proteins in a system, their components, and the possible internal states of components. (Internal states are abstractions useful for representing properties such as conformation, post-translational modification status, and compartmental location.) Chemical species graphs are instances of molecule type graphs or connected sets of such graphs. The vertices of a graph represent protein components (e.g., linear motifs, domains, and sites of phosphorylation), and variable vertex attributes define internal states of protein components.
Pattern graphs, which are subgraphs of chemical species graphs, appear in rules. A rule provides a definition of a transformation, contextual constraints on when this transformation can occur, and a rate law. A rule has two sides. On the left-hand side, the properties of reactants are identified by a set of pattern graphs. If a pattern graph on the left-hand side of a rule matches multiple chemical species graphs, the rule defines multiple reactions. A set of pattern graphs also appears on the right-hand side of a rule. The difference between the left-hand and right-hand sides defines a transformation. The rate law associated with a rule is assigned to all reactions implied by the rule. Thus, a rule provides a coarse-grained characterization of the kinetics of a class of reactions.
BNGL allows molecule type graphs and rules to be encoded in plain text (34). BNGL is compatible with a variety of software tools (33, 34, 37-43).
Examples of molecule type graphs are A(x, y0,1) and B(z), where A and B are the names of two proteins, x and y are the names of components of A, and z is the name of a component of B. Note that component y has two possible internal states, which are represented by the subscripts 0 and 1. An instance of a molecule type graph, such as A(x, y0), is a chemical species graph. A set of connected instances of molecule type graphs is a complex. An example of a complex is A(x1, y0).B(z1). In this example, the sharing of the superscript 1 indicates that A and B are connected via a bond between x and z. The period between A and B indicates that A and B are connected.
For the purpose of presenting an example of a BNGL-encoded rule, let us consider a rule that implicitly defines bimolecular association reactions that produce the complexes A(x1, y0).B(z1) and A(x1, y1).B(z1) : A(x)+B(z)→A(x1).B(z1). On the left-hand side of this rule, the pattern graph A(x) identifies any chemical species containing a molecule of A with component x free as a reactant, and the pattern graph B(z) identifies free B as a reactant. The two pattern graphs A(x) and B(z) are separated by a plus sign, which indicates that the pattern graphs must match distinct chemical species graphs. The difference between the right-hand and left-hand sides of the rule defines a transformation, namely, addition of a bond between x and z. The pattern graph A(x) matches multiple chemical species graphs, including A(x, y0) and A(x, y1). Thus, this rule defines at least two reactions, each of which is assigned a common rate law. For mass-action kinetics, the rate law associated with a rule can be specified by simply providing a single-site rate constant (34).
Model
The model is illustrated in Fig. 1, which is an extended contact map drawn in accordance with the conventions of Chylek et al. (44). The model incorporates six signaling proteins: BCR, Lyn, Fyn, Csk, PAG1, and Syk. These proteins and their components are each depicted in Fig. 1 as a set of nested boxes. For example, the leftmost set of nested boxes in Fig. 1 represents Lyn and the four functional domains of Lyn: the unique, SH3, SH2, and kinase domains. There are 25 numbered arrows in Fig. 1, each of which corresponds to an interaction and a set of BNGL-encoded rules. Each rule provides a formal representation of an interaction in a particular context and implies a number of distinct chemical reactions. A total of 24,388 unidirectional reactions involving 1,122 chemical species are implied by the BNGL-encoded rules illustrated in Fig. 1. The number of chemical species reflects the large number of ways that the proteins considered in the model can interact to generate distinct protein phosphoforms and protein complexes. The complete model specification, in the form of a BioNetGen input file, is given in Listing S1A (Supplementary Material). Listing S1B, an M-file (or .m file), provides the 1,122 ODEs that characterize the mass-action kinetics of the network implied by the rules of Listing S1A. The M-file can be processed by MATLAB (The MathWorks, Natick, MA), a widely used software package for scientific computing. Listing S1B was generated using BioNetGen (34). Listing S1C provides instructions for generating the reaction network implied by the rules of Listing S1A in SBML format, a standardized format for the exchange of models (45).
Figure 1.

Visualization of rule-based model for early events in BCR signaling. Boxes with rounded corners represent proteins and protein components included in the model. Labeled lines connected to small square boxes, or modification flags, represent possible post-translational modifications of proteins; the labels indicate specific sites of phosphorylation. Numbered arrows represent binding and catalytic interactions; the numbers refer to sets of rules in the model (Listing S1A, Supplementary Material). There are two types of arrows. A line with arrowheads at both ends is an arrow that represents a binding interaction. The arrowheads identify the protein components responsible for the interaction. If one arrowhead points at a solid dot on a modification flag, the interaction is contingent upon phosphorylation. A line with an open circle at one end is an arrow that represents a catalytic interaction. The open circle identifies a phosphorylation reaction; the opposite end of the arrow identifies the protein tyrosine kinase responsible for catalyzing this reaction. Solid lines indicate trans interactions. Dotted lines indicate cis interactions. As a simplification, several pairs of molecular components shown individually in this map are lumped together in the model: Y188 and Y199 in Ig-α, Y197 and Y207 in Ig-β, Y163 and Y181 in PAG1, Y387 and Y417 in PAG1, Y525 and Y526 in Syk, and the tandem SH2 domains of Syk are lumped together.
Below, we give a brief summary of the interactions considered in the model. For simplicity, we assume that there is no phosphorylated BCR or receptor-mediated signaling in the basal state, i.e., in the absence of an antigen signal. In the basal state, the SFKs are predominantly autoinhibited (21), which requires phosphorylation of their C-terminal regulatory tyrosines, indicating that Csk must have sufficient kinase activity to overcome phosphatase activity, which we take to be constant, meaning antigen independent. Therefore, in the model, we allow interactions among Lyn, Fyn, Csk and PAG1 in the basal state that serve to recruit Csk to the plasma membrane, where Csk is allowed to phosphorylate Lyn and Fyn. In Fig. 1, intramolecular interaction between the phosphorylated C-terminal regulatory tyrosine of an SFK and its SH2 domain is represented by Arrow 3 for Lyn and by Arrow 11 for Fyn. An autoinhibited SFK is taken to have no interactions with other proteins. An SFK not in the autoinhibited state is allowed to constitutively associate with unphosphorylated Ig-α ITAM via its unique domain (9). The interactions of the unique domains of Lyn and Fyn with Ig-α ITAM are represented by Arrows 1 and 9 in Fig. 1. An SFK that is neither autoinhibited nor in complex with a receptor or PAG1 is allowed to phosphorylate the activation loop of a second SFK (Arrows 6, 7, 14 and 15). This tonic signaling is assumed to arise from random collisions. Each SFK is allowed to associate with a distinct PRS in PAG1 via its SH3 domain (Arrows 19 and 21) and with a distinct pair of phosphotyrosines in PAG1 via its SH2 domain (Arrows 20 and 22). As a simplification, we lump the two phosphotyrosines of each pair together in the model. An SFK phosphorylated in its activation loop is allowed to cis phosphorylate PAG1 when the SFK is bound to PAG1 (Arrows 8 and 16). PAG1 phosphorylated at Y317 is allowed to interact with the SH2 domain of Csk (Arrow 23). PAG1-associated Csk is allowed to cis phosphorylate the C-terminal regulatory tyrosines of SFKs co-localized on PAG1 (Arrows 24 and 25).
In addition to the basal protein-protein interactions described above, other interactions, described in the following paragraph, are allowed to occur when BCR signaling is triggered by an antigen signal. Currently, there are several conceptual models for how antigen initiates BCR signaling (46). Capturing the exact mechanism of BCR activation is not critical for our purposes, and so in the model, we represent the strength of antigen signal as simply as possible, by a parameter c. This parameter multiplies rate constants for activated receptor-dependent phosphorylation reactions in which receptor-bound SFKs and Syk mediate phosphorylation of other receptor-bound kinases and the Ig-α/β ITAMs. In short, setting c = 0 makes receptor-bound kinases inactive, and setting c > 0 makes these kinases active in proportion to the value c. This approach is partly inspired by recent, related modeling studies (47, 48). It should be noted that there may be a nonlinear relationship between c and antigen dose and the immediate effects of antigen interaction with BCR that impact signaling, which may include antigen-induced receptor conformational changes and (re)ordering of receptor spatial positions and configurations within receptor clusters (46).
When c > 0, a receptor-bound SFK is allowed to trans phosphorylate Ig-α/β ITAM tyrosines (Arrows 4, 5, 12, and 13 in Fig. 1) and the activation loops of other receptor-bound SFKs (Arrows 6, 7, 14, and 15). Phosphorylated Ig-α ITAM is allowed to interact with SH2 domains of SFKs (Arrows 2 and 10). A doubly phosphorylated Ig-β ITAM is allowed to interact with tandem SH2 domains of Syk (Arrow 17). It should be noted that the two tyrosines in each ITAM are lumped together in the model and the lumped site is characterized by three internal states, which are introduced to represent the unphosphorylated form and the singly and doubly phosphorylated forms of an ITAM. Receptor-bound Syk is allowed to trans phosphorylate the activation-loop tyrosines of a second copy of receptor-bound Syk (Arrow 18), which increases the catalytic activity of Syk (13, 49). As a simplification, the two tyrosines in the activation loop of the Syk kinase domain are lumped together and treated as a single site in the model. The interactions involving PAG1 remain the same as in the absence of signaling. However, it should be noted that these interactions are affected by receptor-mediated signaling because PAG1 is phosphorylated to a greater extent when an antigen signal leads to activation of SFKs.
Parameters
Estimates for parameters that characterize the processes captured in the model are summarized in Table I. These estimates are based on the considerations discussed below. Parameter values in Table I are given in the unit system recommended by Faeder et al. (34), whereas parameter values mentioned below are given in customary units.
Table I. Parameter values.
| Parameter | Comment |
|---|---|
| p1 = 3× 10⁵/cell | Protein copy number, the same for all six proteins |
| p2 = 10 s−1 | Reversible SFK autoinhibition, forward rate constant |
| p3 = 3× 10⁻⁴ s−1 | Reversible SFK autoinhibition, reverse rate constant |
| p4 = 3× 10⁻⁷ (molecules/cell)−1s−1 | Reversible SFK unique domain-Ig-α binding, forward rate constant |
| p5 = 30 s−1 | Reversible SFK unique domain-Ig-α binding, reverse rate constant |
| p6 = 3 ×10⁻⁵ (molecules/cell)−1s−1 | SFK SH2 domain-pY association, pY in Ig-α ITAM or PAG1 |
| p7 = 0.3s−1 | SFK SH2 domain-Ig-α dissociation, singly phosphorylated Ig-α ITAM |
| p8 = 0.1 s−1 | SFK SH2 domain-Ig-α dissociation, doubly phosphorylated Ig-α ITAM |
| p9 = 3 ×10⁻⁶ (molecules/cell)−1s−1 | Reversible Syk-Ig-β binding, forward rate constant |
| p10 = 0.3s−1 | Reversible Syk-Ig-β binding, reverse rate constant |
| p11 = 10−5 (molecules/cell)−1s−1 | SFK SH3 domain-PRS association, PRS in PAG1 |
| p12 = 103 s−1 | Two-point attachment of SFK to PAG1, ring-closure rate constant |
| p13 = 30 s−1 | SFK-PAG1 dissociation, breaking SH3 domain-PRS bond only |
| p14 = 0.1s−1 | SFK-PAG1 dissociation, breaking two bonds |
| p15 = 3 × 10⁻⁷ (molecules/cell)−1s−1 | Reversible Csk-PAG1 binding, forward rate constant |
| p16 = 3 × 10⁻³ s−1 | Reversible Csk-PAG1 binding, reverse rate constant |
| p17 = 10−10 (molecules/cell)−1s−1 | Phosphorylation by free SFK with unphosphorylated A-loop |
| p18 = 10−7 (molecules/cell)−1s−1 | Phosphorylation by free SFK with phosphorylated A-loop |
| p19 = 10−7 (molecules/cell)−1s−1 | Phosphorylation by receptor-bound Lyn with unphosphorylated A-loop |
| p20 = 3 ×10⁻⁵ (molecules/cell)−1s−1 | Phosphorylation by receptor-bound Lyn with phosphorylated A-loop |
| p21 = 103 s−1 | PAG1-scaffolded phosphorylation |
| p22 = 3 ×10⁻⁶ (molecules/cell)−1s−1 | Phosphorylation by Syk with unphosphorylated A-loop |
| p23 = 3 ×10⁻⁴ (molecules/cell)−1s−1 | Phosphorylation by Syk with phosphorylated A-loop |
| p24 = 1s−1 | Dephosphorylation, the same for all pY |
| p25 = 5 s−1 | Ratio of catalytic efficiencies (Lyn vs. Fyn) |
Estimates for 25 parameter values are summarized. Unless otherwise indicated, these parameter values were mapped to the six protein copy numbers and 85 rate constants of the model as indicated in Listing S1 (Supplementary Material). In the model, the strength of an antigen signal is characterized by the input parameter c, which sets the level of activated receptor-dependent kinase activity. For example, the value of c determines the ability of receptor-bound kinases to mediate phosphorylation of receptor ITAMs. Parameter values are expressed in the unit system recommended by Faeder et al. (34).
Protein copy number
For simplicity, we assume that all six proteins, BCR, Lyn, Fyn, Csk, PAG1, and Syk, are expressed at the same level. Thus, the copy number of each protein is given by a single parameter, p1. We assume p1 = 3 × 10⁵ molecules per cell (Table I), a reasonable BCR copy number for a murine B cell line (50). This copy number corresponds to a cytoplasmic concentration of 5 μM for a cytoplasmic volume of 0.1 pL (= 100 μm3) (51), which is consistent with a cell diameter of 7 microns (52) and 50% of the total cell volume being cytoplasmic (53).
Reversible SFK autoinhibition
Assembly and disassembly of the autoinhibited conformation of an SFK involve the SH2 and SH3 domains of the SFK (54). As a simplification, we take the kinetics of these processes to be characterized by first-order rate laws with rate constants p2 and p3. We assume that the rate constant for assembly is large relative to that for disassembly, such that SFKs are predominantly autoinhibited in the absence of an antigen signal. For p2 = 10 s−1 and p3 = 3 × 10⁻⁴ s−1 (Table I), 80% of SFKs are autoinhibited in the basal state.
Reversible SFK unique domain-Ig-α binding
We expect interaction of the unique domain of Lyn or Fyn with Ig-α to be characterized by a low affinity and short lifetime (55, 56). We set the forward rate constant, p4, to a value that can be considered lower than usual for specific protein-protein association (57). We then set the reverse rate constant, p5, to a value that yields a low affinity and short lifetime. For p4 = 0.018 μM−1s−1 and p5 = 30 s−1 (Table I), only a small number of receptor-SFK complexes are present in the basal state.
Reversible SFK SH2 domain-Ig-α ITAM pY binding
The forward and reverse rate constants for SFK SH2 domain-Ig-α ITAM pY binding should yield an affinity that is higher than that for unique domain binding to unphosphorylated Ig-α (10). We set the forward rate constant, p6, at 1.8 μM−1s−1 (Table I). Recall that the separate tyrosines in the Ig-α ITAM are lumped together in the model as a single site, which has three different phosphorylation states (unphosphorylated, singly phosphorylated, and doubly phosphorylated). Thus, we consider two reverse rate constants: one for dissociation from a singly phosphorylated Ig-α ITAM, p7, and one for dissociation from a doubly phosphorylated Ig-α ITAM, p8. We set p7 = 0.3 s−1 and p8 = 0.1 s−1 (Table I). The values of p6, p7 and p8 given in Table I are consistent with earlier estimates of similar parameters (56) and measured affinities for Src SH2 domain-pY interactions (58).
Reversible Syk-Ig-β binding
Syk-Ig-β interaction involves both SH2 domains of Syk and both phosphotyrosine docking sites of the Ig-β ITAM (59). Two-point attachment of Syk to Ig-β is destabilized by phosphorylation of the N-terminal region of Syk (60). (The site of phosphorylation is Y130 in mouse and Y131 in human.) We set the effective rate constant for association, p9, at 0.18 μM−1s−1 and the effective rate constant for dissociation, p10, at 0.3 s−1 (Table I). These values were chosen so that p9 p10 is much less than p6 p7, because an isolated Syk-family kinase SH2 domain binds a single ITAM phosphotyrosine with much lower affinity than an SFK SH2 domain (61). With this approach, we are essentially assuming that two-point attachment of Syk to doubly phosphorylated Ig-β ITAM is quickly destabilized by phosphorylation of the N-terminal region of Syk, or equivalently, we are considering a mutant form of Syk with only a single functional SH2 domain. A more careful treatment of Syk interaction with Ig-β is not essential, because in our model, there is no feedback from receptor-bound Syk to upstream processes, and activated Syk is the most downstream readout of the model.
Reversible SFK SH2 domain-PAG1 pY binding
We assume that attachment of an SFK SH2 domain to a phosphotyrosine in PAG1 from the bulk is the same as attachment of an SFK SH2 domain to a phosphotyrosine in the Ig-α ITAM. Once an SFK is attached to a site in PAG1 via its SH2 domain, it can attach at a second site via an SH3 domain-PRS interaction. For simplicity, we model release of an SFK from PAG1 as a one-step process with an effective rate constant that is less than the rate constant for dissociation of an SFK from a singly phosphorylated Ig-α ITAM: p14 = 0.1 s−1.
Reversible Csk SH2 domain-PAG1 pY binding
We assume that the SH2 domain of Csk has a lower affinity for its phosphotyrosine binding site in PAG1 than that of an SFK SH2 domain for a phosphotyrosine binding site, which is consistent with the binding data of Wavreille et al. (62). We also assume that recruitment of Csk to PAG1 is relatively slow, so that SFKs have enough time to initiate BCR signaling before being deactivated by PAG1-associated Csk. Thus, we set p15 = 0.018 μM−1 s−1 and p16 = 3 × 10⁻³ s−1, where p15 is the forward rate constant for Csk SH2 domain binding to pY317 in PAG1 and p16 is the reverse rate constant.
Reversible SFK SH3 domain-PAG1 PRS binding
SH3 domain-PRS interactions typically have lower affinities than SH2 domain-pY interactions (58). Thus, we assume that SFK-PAG1 binding via SH3 domain-PRS interaction is low affinity and short lived relative to SFK-PAG1 binding via SH2 domain-pY interaction. This assumption is consistent with the idea that increased SFK kinase activity, resulting in increased phosphorylation of PAG1, is required to initiate negative feedback via recruitment of Csk to PAG1. We set p11 = 0.6 μM−1 s−1 and p13 = 30 s−1, where p11 is the forward rate constant for SFK SH3 domain binding to a PRS in PAG1 and p13 is the reverse rate constant. These estimates yield an affinity lower than that measured by Solheim et al. (18), but the affinity can still be considered typical for an SH3 domain-PRS interaction (58).
Ring closure
In the model, once an SH2 or SH3 domain of an SFK makes contact with PAG1, the second Src homology domain in the SFK can mediate two-point attachment of the SFK to PAG1. For such an intramolecular ring-closure reaction, we assume a very large rate constant, p12 = 103 s−1, to reflect the effect of tethering.
Phosphorylation
In the model, we allow an SFK that is neither in the autoinhibited conformation nor in complex with a receptor or PAG1 to catalyze the phosphorylation of a second SFK. Such phosphorylation events are intended to yield a low basal level of SFK phosphorylation, i.e., tonic signaling. Accordingly, we assign small rate constants: we set p17 = 6 × 10⁻⁶ μM−1s−1 if phosphorylation is mediated by a partially active SFK (i.e., an SFK that is neither autoinhibited nor autophosphorylated), and we set p18 = 6 × 10⁻³ μM−1s−1 if phosphorylation is mediated by a fully active SFK (i.e., an autophosphorylated SFK). In contrast, for phosphorylation reactions catalyzed by receptor-bound SFKs, we assign large rate constants: we set p19 = 6 × 10⁻³ μM−1s−1 if phosphorylation is mediated by a partially active SFK, and we set p20 = 1.8 μM−1s−1 if phosphorylation is mediated by a fully active SFK. It should be noted that p19 and p20 are multiplied by the input parameter c, and therefore, the value of c ultimately determines the rates of activated receptor-dependent phosphorylation reactions catalyzed by receptor-bound SFKs. For phosphorylation reactions mediated by receptor-bound Syk, we set p22 = 0.18 μM−1s−1 if phosphorylation is mediated by partially active Syk (i.e., Syk bound to a doubly phosphorylated ITAM but not autophosphorylated), and we set p23 = 18 μM−1s−1 if phosphorylation is mediated by fully active Syk (i.e., autophosphorylated Syk). It should be noted that p22 and p23 are each multiplied by c. We assume that a cis phosphorylation reaction taking place on PAG1 is effectively a first-order process characterized by a very large rate constant: p21 = 103 s−1.
Dephosphorylation
We consider all dephosphorylation reactions to be pseudo first-order processes mediated by unspecified phosphatases present in excess. We set p24 = 1 s−1, which is consistent with an earlier model-based analysis of phosphatase activity in the FcεRI pathway (56).
Relative catalytic efficiencies of Lyn and Fyn
We expect receptor-bound Lyn and Fyn to have different catalytic efficiencies for activated receptor-dependent phosphorylation reactions. Thus, for these reactions, we assume that p25 = 5, where p25 is the catalytic efficiency of Lyn relative to that of Fyn.
Simulations
We used BioNetGen (33, 34) to process the rules of our model (Listing S1A) to generate the reaction network implied by these rules (Listing S1B). We then simulated the network using the built-in deterministic and stochastic simulation engines of BioNetGen. The deterministic simulation engine of BioNetGen, which was invoked using the
simulate_ode
command with default settings (34), is CVODE (63, 64), which takes as input the ODEs that characterize the mass-action kinetics of the rule-derived reaction network. These ODEs are given in Listing S1B. The stochastic simulation engine of BioNetGen, which was invoked using the
simulate_ssa
command (34), is an efficient kinetic Monte Carlo algorithm (34, 65), which takes as input a list of rule-derived reactions.
Unless otherwise specified the initial condition used in simulations is the basal steady state, in which a number of chemical species are populated because of basal signaling (e.g., the activity Csk that maintains most copies of Lyn and Fyn in autoinhibited conformations). The population levels of these chemical species are found by setting c = 0 and specifying an initial condition wherein all proteins are free and unphosphorylated. From this initial non-steady-state condition, which was chosen for ease of specification, the model is simulated for a time sufficient to reach the basal steady state.
To confirm that our simulation results are free of numerical errors, we used ODE solvers available in MATLAB to repeat our calculations. The same results were obtained. For example, the M-file of Listing S1B can be used to obtain the results shown in Figure 2A. This file invokes the
ode15s
algorithm available in MATLAB.
Figure 2.

BCR signaling dynamics for antigen signals of different strengths. (A) BCR signaling is transient after introduction of an antigen signal: c = 0 for time t < 0 and c = 3 for t ≥ 0. Before the step increase in c, tonic signaling is in a steady state (the basal state). (B) In contrast, BCR signaling is sustained for a stronger antigen signal: c = 0 for t < 0 and c = 6 for t ≥ 0. In each panel, six quantities are plotted as a function of time: fraction of Fyn in the autoinhibited conformation (Autoinhibited Fyn), fraction of Ig-α with either one or two phosphorylated ITAM tyrosines (Phospho Ig-α), fraction of Syk with a phosphorylated activation loop (Activated Syk), fraction of Ig-β with a doubly phosphorylated ITAM (Phospho Ig-β), fraction of Fyn with a phosphorylated activation loop (Activated Fyn), and fraction of Csk bound to PAG1 (Csk:PAG1). The curves in panel A are labeled and the dash patterns of curves in panel B are consistent with those in panel A. Time courses for the fractions of autoinhibited and activated Lyn are essentially the same as those shown for Fyn. The quantities plotted in these panels are defined precisely in the observables block of the BioNetGen input file BCR.bngl (Listing S1A, Supplementary Material).
Identification of bifurcation types
Bifurcation analysis is a powerful tool for characterizing dynamical systems (66). Systems with the same bifurcations exhibit the same range of qualitative dynamics. To characterize the dynamics captured in our model for BCR signaling for wild type cells, as well as Lyn-, Fyn- and Csk-deficient cells, we performed a bifurcation analysis taking c to be the bifurcation parameter, i.e., the model parameter to be varied. With this choice, a bifurcation is a qualitative change in dynamical behavior upon a small, smooth change in the value of c. Bifurcations were identified through systematic simulations designed to reveal selected bifurcation types. The type of bifurcation at a bifurcation point c=c0 was determined by comparing dynamical behavior at values of c just below and just above c0. For example, because a characteristic feature of a saddle-node bifurcation is hysteresis (i.e., history dependence), we sought to reveal saddle-node bifurcations by running a series of simulations to steady state for increasing values of c starting from a small value of c, and then repeating this process for decreasing values of c starting from a large value of c. In addition to considering saddle-node bifurcations, we considered, as in the study of Hat et al. (67), several common bifurcation types. Among the bifurcation types considered and identified is the saddle-node-on-invariant-circle (SNIC) bifurcation. A characteristic feature of a SNIC bifurcation is birth of oscillations with a finite amplitude and infinite period. We assessed the robustness of bifurcations to parameter uncertainty through a sensitivity analysis.
Results
Based on available mechanistic knowledge, we formulated a rule-based model for early events in BCR signaling suitable for studying the roles played by Lyn and Fyn in responses to antigen signals (Fig. 1; Listing S1A, Supplementary Material). The model characterizes signaling at the single-cell level. The results of analysis of the model are presented below. Unless otherwise indicated the results are based on the parameter values of Table I and deterministic simulations (i.e., ODE-based calculations).
BCR signaling can change qualitatively with a change in signal strength
We consider BCR signaling to be triggered by antigen-receptor interaction and a concomitant increase in the activation of kinases associated with receptors (8). In the model, the effect of antigen is captured by an input parameter c, the value of which determines the effective rate constants for activated receptor-dependent phosphorylation reactions mediated by receptor-bound Lyn, Fyn and Syk. Figure 2 illustrates how BCR signaling dynamics can change qualitatively with a change in the strength of antigen signal, i.e., a change in the value of c. A relatively weak signal is considered in Fig. 2A (c = 0 for time t < 0 and c = 3 for t ≥ 0), and a relatively strong signal is considered in Fig. 2B (c = 6 for t ≥ 0). As can be seen, the weaker signal triggers a pulse of signaling, as measured by receptor phosphorylation, SFK autophosphorylation, or Syk autophosphorylation. In contrast, the stronger signal triggers sustained signaling. In both cases, after a delay, there is a rapid, switch-like induction of receptor, SFK, and Syk phosphorylation followed by a much slower rise in the level of PAG1-associated Csk. The length of the delay is signal dependent. In contrast, recruitment of Csk to PAG1 is similar in the two cases. In the case of Fig. 2A, PAG1-associated Csk is able to drive autoinhibition of the SFKs to completion, which counteracts the effect of antigen on SFK activity. In the case of Fig. 2B, a steady state is established wherein the vast majority of SFKs are autoinhibited but a small pool of uninhibited SFKs is able to maintain a nonzero level of receptor, SFK, and Syk phosphorylation.
Interestingly, recruitment of Csk to PAG1 is adaptive or nearly adaptive, meaning that all or nearly all Csk recruited to PAG1 is eventually released. In the case of Fig. 2A, all recruited Csk is released, and as a result, the pulse seen in Fig. 2A is repeated (not shown). The interval between pulses is approximately 100 min for the case of Fig. 2A, and pulses continue indefinitely if the antigen signal persists. However, the scope of our model is limited and the model is not intended to capture BCR signaling dynamics on a long time scale. The length of the interval between pulses depends on c. Other factors affecting the length of the interval include 1/p3 (Table I), the lifetime of the autoinhibited configuration of an SFK, and the ratio p2/p24 (Table I), which determines the probability that relief of autoinhibition will be reversed before dephosphorylation of the C-terminal regulatory tyrosine.
A systematic survey of responses to step increases in c revealed four qualitatively distinct responses. The type of response depends on the size of the step increase in antigen signal. For small increases in antigen signal, BCR signaling is unresponsive. For larger increases, there is a single pulse of BCR signaling, which is similar to the pulse shown in Fig. 2A. For still larger increases, the pulses of signaling become repetitive, i.e., there are oscillations. Finally, for large increases in antigen signal, BCR signaling is sustained, as in Fig. 2B. In all cases where there is a response to an antigen signal, the response is marked by a rapid off-to-on transition after a delay (Fig. 2). It should be emphasized that our model is intended to characterize BCR signaling in a single cell, and as a result, the pulses predicted by the model would not necessarily be observable at the population level. For example, pulses might be obscured by asynchrony arising from heterogeneity in protein expression levels. We do not expect intrinsic noise to significantly influence BCR signaling dynamics, as results from deterministic and stochastic simulations are indistinguishable (results not shown).
Effects of Lyn, Fyn and Csk deletion on BCR signaling
The results presented above depend both on our assumptions about the structure of the model and on our estimates for parameters in the model. Before investigating the dynamical properties of the model further, it is reasonable to ascertain the extent to which the model is consistent with known properties of BCR signaling. In Fig. 3, we consider the effects of Lyn, Fyn, and Csk deletion on responses to antigen signals. In Fig. 3, deletion of a protein is captured by setting the total copy number of that protein to zero. Step increases at t = 0 in the strength of antigen signal c from 0 to 1, 3, 6 and 8 are considered in panels A–D of Fig. 3. Each panel shows the time course of Syk autophosphorylation predicted for a wild type (WT) cell (dash-dot curve), a Lyn−/− cell (solid curve), a Fyn−/− cell (broken curve), and a Csk−/− cell (dotted curve). Each deletion is discussed in detail below.
Figure 3.

Effects of knockouts on BCR signaling dynamics. In each panel, the fraction of Syk with a phosphorylated activation loop (Activated Syk) is plotted as a function of time after introduction of an antigen signal for a wild type (WT) cell, a Lyn knockout (Lyn−/−) cell, a Fyn knockout (Fyn−/−) cell, and a Csk knockout (Csk−/−) cell. These cell types are indicated by dash-dot, solid, broken, and dotted lines, respectively. Knockout of a protein means setting the copy number for that protein to zero in the model. In all panels, for time t < 0, c = 0, and tonic signaling is in a steady state (the basal state). For t ≥ 0, c = 1 in (A), c = 3 in (B), c = 6 in (C), and c = 8 in (D).
In several studies, Lyn deletion has been reported to yield delayed hyperactive BCR signaling (26-29). This behavior is recapitulated by the model. In the case of a very weak stimulus, WT and Lyn−/− cells are both predicted to be nonresponsive (Fig. 3A). For stronger stimuli, a Lyn−/− cell is predicted to eventually produce sustained Syk autophosphorylation, at a level exceeding that in a WT cell at long times (Fig. 3, B–D). In either a WT or Lyn−/− cell, the rise in Syk autophosphorylation is sharp, as before (Fig. 2), and this rise occurs after a signal-dependent delay. The length of the delay, for a WT, Fyn−/−, or Lyn−/− cell, decreases as the strength of the antigen signal increases. For all stimuli considered that elicit responses, the delay for a Lyn−/− cell is predicted to be longer than that for a WT cell. For example, the delay for a Lyn−/− cell is more than 3-fold longer than that for a WT cell in the case of Fig. 3B. This effect depends on Fyn having a catalytic efficiency less than that of Lyn (Fig. S1, Supplementary Material).
Fyn deletion has been reported to yield hypoactive BCR signaling, an effect distinct from that of Lyn deletion (24). As can be seen in Fig. 3, the observed effect of Fyn deletion is recapitulated by the model. The negative effect of Fyn deletion on BCR signaling is most apparent in Fig. 3C. At long times, a Fyn−/− cell is predicted to produce less Syk autophosphorylation than a WT cell. Indeed, for the antigen signal considered in Fig. 3C, a Fyn−/− cell is predicted to generate only a pulse of Syk autophosphorylation, whereas a WT cell is predicted to generate sustained Syk autophosphorylation. Interestingly, the model predicts that a Fyn−/− cell has a faster response to a stimulus than a WT cell for all stimuli considered that yield significant Syk activation (Fig. 3, B–D). Although there are differences between a Fyn−/− and a WT cell, a Fyn−/− cell is predicted to behave more like a WT cell than a Lyn−/− cell.
In the model, Lyn and Fyn are treated identically with two exceptions. First, Lyn is assumed to have 5-fold greater kinase activity than Fyn. This difference explains why BCR signaling is delayed in the case of Lyn deletion and accelerated in the case of Fyn deletion. Second, Lyn is assumed to be capable of cis phosphorylation of more SFK docking sites in PAG1 than Fyn (four vs. two), including its own docking sites (Y387 and Y417). In contrast, Fyn is assumed to be incapable of phosphorylating its own docking sites in PAG1 (Y163 and Y181). This difference explains why Lyn deletion but not Fyn deletion leads to a loss of Csk-mediated negative feedback and hyperactive BCR signaling.
We expect that Csk deletion should lead to an absence of phosphorylation of the C-terminal regulatory tyrosines in Lyn and Fyn. As a result, SFK autoinhibition should be ablated. Thus, we expect Csk deletion to be similar to the knock-in mutation studied by Hibbs et al. (68), which replaced WT Lyn with a form of Lyn lacking the regulatory C-terminal tyrosine (Lynup/up). We explicitly consider this form of Lyn in Fig. 4. An effect of Lynup/up is chronic stimulation of BCR signaling. As illustrated in Fig. 3A, the predicted effect of Csk deletion results in significant Syk autophosphorylation at levels of antigen stimulation that fail to produce Syk autophosphorylation in Lyn−/−, Fyn−/− and WT cells. Thus, ablation of SFK autoinhibition through deletion of Csk, or mutation in SFK regulatory C-terminal tyrosine has a positive effect on BCR signaling as expected.
Figure 4.

Effects of mutating the C-terminal regulatory tyrosine of Lyn on BCR signaling dynamics. The case considered here corresponds to that of a Lynup/up mutant. As can be seen, this case is similar to that of Csk−/− cell (Fig. 3A).
In summary, the results of Figs. 3 and 4 demonstrate that the model is consistent with known effects of Lyn deletion, Fyn deletion, and ablation of SFK autoinhibition.
Bifurcation analysis
To more fully elucidate the range of dynamical behavior that can arise in BCR signaling, we carried out a bifurcation analysis in which c (antigen signal strength) was taken as the bifurcation parameter. The analysis was performed for WT, Lyn−/−, Fyn−/−, and Csk−/− cells. Bifurcation diagrams are shown in Fig. 5. Because our analysis relied on simulation, only stable fixed points and stable limit cycles are represented in Fig. 5. (Unstable fixed points and unstable limit cycles are difficult to detect through simulations.)
Figure 5.

Summary of bifurcation analysis. Bifurcation diagrams are shown for four types of cell: (A) wild type (WT), (B) Lyn knockout (Lyn−/−), (C) Fyn knockout (Fyn−/−), and (D) Csk knockout (Csk−/−). In each diagram, the value of the bifurcation parameter c (the strength of an antigen signal) is indicated on the horizontal axis and possible steady-state levels of activated Syk are indicated on the vertical axis. The level of activated Syk is the fraction of Syk with a phosphorylated activation loop. Solid lines correspond to stable fixed points. Pairs of dotted lines correspond to stable limit cycles. The top dotted line of a pair indicates the upper limit of a stable limit-cycle oscillation, and the bottom dotted line indicates the lower limit. Unstable fixed points and unstable limit cycles are not indicated in these diagrams.
Let us first consider Lyn−/− and Csk−/− cells. In these cell types, SFK-initiated negative feedback is ablated but SFK-initiated positive feedback is intact. It is generally appreciated that systems with positive feedback have the potential to exhibit bistability. As can be seen in panels B and D of Fig. 5, bistability in BCR signaling in Lyn−/− and Csk−/− cells is possible. In the case of a Lyn−/− cell, for values of c less than about 1, there is a single stable steady state, which is characterized by insignificant activation of Syk. As c increases, a second stable steady state appears at c ≈ 1 through a saddle-node bifurcation. The type of bifurcation was determined as explained in the Methods section. The second steady state is characterized by significant activation of Syk. As c continues to increase, steady states with low (near zero) and high levels of Syk co-exist (i.e., there is bistability) until c ≈ 2.8 at which point the first steady state vanishes (again through a saddle-node bifurcation). For values of c greater than about 2.8, only a steady state with significant activation of Syk exists. The bifurcation diagram for the case of a Csk−/− cell is similar to that for a Lyn−/− cell except that the regime of bistability is shifted to much lower values of c, i.e., there is bistability for c ∈ (0.28, 0.43). This result is explained by the lower level of SFK kinase activity in a Lyn−/− cell compared to a Csk−/− cell. Thus, to achieve a given level of activated Syk, a Lyn−/− cell requires a stronger antigen signal than a Csk−/− cell.
Let us now consider WT and Fyn−/− cells. In these cell types, BCR signaling dynamics are influenced by SFK-initiated positive and negative feedback loops. After introduction of an antigen signal, positive feedback (activated receptor-dependent receptor phosphorylation and SFK autophosphorylation) is immediate. In contrast, negative feedback is much slower, because recruitment of Csk to PAG1, which is governed by the value of the parameter p15 (Table I), is slow (for example, see Fig. 2). It is generally appreciated that such systems have the potential to exhibit repeated pulses, i.e., relaxation oscillations. Relaxation oscillations are characterized by an amplitude that remains fairly constant as the value of a bifurcation parameter changes and by a period that depends on the value of the bifurcation parameter. As indicated in Fig. 5, in either a WT or Fyn−/− cell, oscillations in Syk activation are obtained for a range of c values, and the amplitude is independent of the value of c.
The reason that relaxation oscillations arise can be explained as follows. Because negative feedback is much slower than positive feedback, the effect of negative feedback (Csk-mediated autoinhibition of the SFKs) is initially insignificant. Thus, on a short time scale, BCR signaling in a WT or Fyn−/− cell behaves like a Lyn−/− cell (i.e., like a bistable system), and as a result, there is switch-like transition from an inactive state to an active state. It should be noted that the upper limit of oscillations in a WT or Fyn−/− cell corresponds to the sustained activated steady state of a Lyn−/− cell, which can be seen, for example, in a comparison of panels A and B in Fig. 5. Later, negative feedback becomes dominant, and the lower limit of oscillations in a WT or Fyn−/− cell corresponds to the inactive steady state of a Lyn−/− cell (cf. Fig. 5, A and B). Additional results that provide insight into delay time and pulse duration are provided in Fig. S2 (Supplementary Material). In short, for c ∈ (2.8, 5.5) in the case of a WT cell or for ∈ c ∈ (2.8, 7.1) in the case of Fyn−/− cell, slow negative feedback causes sharp transitions between inactive and active states, and the time spent near the active (inactive) state increases (decreases) with the strength of antigen signal c (Fig. S2A).
Although the amplitude of oscillations is independent of c (Fig. 5, A and C), the length of the initial delay before Syk is activated and the duration of a pulse of Syk activation are dependent on the value of c (Fig. S2A): the initial delay decreases with increasing step changes in c, whereas pulse duration increases. The delay time also depends on the copy numbers of Lyn and Fyn (Fig. S2B). In Lyn- or Fyn-deficient cells, the initial delay time monotonically decreases with SFK copy number (dotted lines). When the copy number of Lyn is varied and the copy number of Fyn is fixed (Fig. S2B, solid black line), the delay time first increases as Lyn copy number increases—which occurs because the presence of even a small amount Lyn causes autoinhibition of Fyn in the resting state—then sharply decreases because of the increasing SFK activity. The dependence of delay time on Fyn copy number level when Lyn copy number is fixed is complex (Fig. S2B, solid red line). The delay gradually increases as Fyn copy number increases. This behavior is caused by the competition of catalytically less active Fyn (relative to Lyn) for receptor binding sites. Then, where Fyn is much more abundant than Lyn, the delay decreases as Fyn copy number increases. This behavior is caused by the increasing SFK activity. At even higher Fyn levels, a second locally maximal delay time is observed because Fyn (in the presence of Lyn) mediates negative feedback. The second locally maximal delay time is not observed in Lyn-deficient cells.
We note that the bifurcation diagrams for WT and Fyn−/− cells shown in Fig. 5 are somewhat more complicated than they appear. In each cell type, there are three bifurcations. At c = c1 ≈ 2.8, there is a SNIC bifurcation, where the inactive steady state vanishes and relaxation oscillations appear. At c = c2 ≈ 5.5 for a WT cell (or c = c2 ≈ 7.1 for a Fyn−/− cell), there is a subcritical Hopf bifurcation. At c = c3 where c3 is slightly greater than c2, there is a cyclic-fold bifurcation. Thus, for values of c between c2 and c3, a stable limit cycle and stable fixed point co-exist; however, given the small difference between c2 and c3, it is unlikely that this dynamical behavior is observable. The bifurcation types were identified as described in the Methods section.
From the bifurcation analysis of Fig. 5, it can be seen that Csk deletion has the most severe effect on system dynamics. Csk−/− cells can be activated more easily than any of the other cell types considered. This finding is consistent with the experimental observation that Csk deletion results in constitutively active Lyn and Syk (69).
Dynamical behavior can be tuned by varying Lyn and Fyn expression levels
BCR signaling dynamics can be changed by manipulating the relative expression levels of Lyn and Fyn, as summarized in Fig. 6. This figure delineates combinations of Lyn and Fyn copy numbers that yield each of four possible qualitative responses of a WT cell to a particular antigen signal, a step change in c from 0 to 3. For example, no response to antigen is obtained for combinations of (low) Lyn and Fyn copy numbers that fall into the smallest region (Area I). Sustained responses to antigen are obtained when Lyn and Fyn are expressed at high levels (Area IV). Such responses can also be obtained when either SFK is expressed at a low level if the other SFK is expressed at a sufficiently high level. High-level expression of Lyn can more easily overcome low-level expression of Fyn than in the opposite scenario. Single and repeated pulses of Syk activation are obtained in Areas II and III, respectively. The results summarized in Fig. 6 suggest that qualitatively distinct BCR signaling dynamics can be revealed by systematic manipulation of the expression levels of Lyn and Fyn. For example, sufficient knockdown or overexpression of Lyn or Fyn can be expected to bring about a qualitative change in the dynamical response to a given antigen signal.
Figure 6.
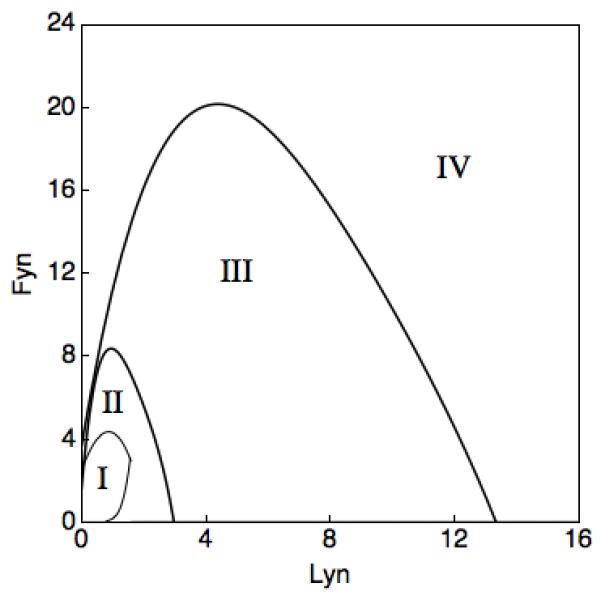
Dependence of BCR signaling dynamics on Lyn and Fyn copy numbers. Responses to an antigen signal were systematically simulated for different combinations of Lyn and Fyn copy numbers. The antigen signal was a step increase in c to 3. In all cases, the initial state was the basal steady state with c = 0. Each numbered region in this plot corresponds to one of four qualitative responses seen in simulations. These responses to the antigen signal are I) no Syk activation, II) a single pulse of Syk activation, III) repeated pulses of Syk activation, and IV) sustained Syk activation, as in Fig. 2B. Note that a value of 1 on either the horizontal or vertical axis corresponds to 105 molecules/cell.
Effects of knockdown or redundancy
SFKs not considered in our model (e.g., Blk), or perhaps even omitted interactions of Fyn, may partially compensate for Lyn deletion. Likewise, PAG1 may be redundant to some extent (70). Because of pools of Lyn-like and PAG1-like proteins, deletion of Lyn or PAG1 may only attenuate, rather than ablate, Csk-mediated negative feedback in BCR signaling. In contrast, negative feedback appears to strictly depend on Csk, as deletion of Csk leads to constitutive activation of Lyn and Syk (69). In Fig. 7, we consider the effects of attenuation of negative feedback through a reduction in the copy number of Lyn, and PAG1. The lowered level of Lyn or PAG1 is intended to reflect a knockdown or compensatory proteins that maintain negative feedback in Lyn−/− and PAG1−/− cells.
Figure 7.

Effects of PAG1 and Lyn knockdowns on BCR signaling dynamics. (A) Time dependence of Fyn activation and phosphorylation of Y317 in PAG1 after introduction of an antigen signal (a step change from c = 0 to = c = 5 at time t = 0) for a wild type (WT) cell. (B) Same as (A) except for the case of a cell in which Lyn copy number is reduced to 10% of the WT copy number. (C) Bifurcation diagram for a cell with a knockdown of PAG1 copy number to 10% of the WT copy number. (D) Bifurcation diagram for a cell with a knockdown of Lyn copy number to 10% of the WT copy number.
In Fig. 7A, we consider a WT cell with the nominal number of Lyn molecules; there is a transient pulse of Fyn and PAG1 phosphorylation in response to an antigen signal. In Fig. 7B, we consider a cell with 10-fold less Lyn (30,000 copies per cell), and in contrast, there is a sustained response to the same antigen signal. These results are consistent with data for WT and Lyn-deficient mast cells (31).
A bifurcation diagram is shown in Fig. 7C for the case of a cell with 10-fold less PAG1 than in a WT cell and in Fig. 7D for the case of a cell with 10-fold less Lyn than in a WT cell (cf. Fig. 5B). Knockdown of PAG1 has a less severe effect on the dynamics of BCR signaling than deletion of Csk (cf. Fig. 5D), as the range of qualitative behaviors accessible to a cell with a knockdown of PAG1 (or knockout of PAG1 and a pool of compensatory PAG1-like proteins) is the same as that for a WT cell. The results of a more detailed analysis are given in Supplemental Table S1. These results indicate that the effect of negative feedback is robust to large changes in the copy number of PAG1 and the rate of PAG1 dephosphorylation. In contrast, the range of qualitative behaviors accessible to a cell with a knockdown of Lyn (or knockout of Lyn and a pool of compensatory Lyn-like proteins) is different from that of a WT cell and the same as that for a Lyn−/− cell (without a pool of Lyn-like proteins), although hysteresis may be less apparent. These results are consistent with those of Fig. 6, where it can be seen that pulse-like and oscillatory responses are possible at low levels of Lyn. The reason is that a low level of Lyn, or Lyn-like proteins, can lead to significant phosphorylation of Fyn, as illustrated in Fig. 7B.
Sensitivity analysis
The results presented above indicate that our model can produce one of four qualitatively distinct dynamical responses to an antigen signal: no response, a pulse, oscillations, or a sustained response. Moreover, changes in the qualitative behavior are marked by certain bifurcations. To assess the robustness of these findings to parameter uncertainty, we varied the value of each parameter of the model, p1 through p25, over a 100-fold range above and a 100-fold range below the nominal value, and at each parameter value considered, we determined the response to an antigen signal (a step change in c from 0 to 3). For comparison, we similarly varied c for nominal parameter values (Table I). The results are summarized in Fig. 8. For some parameters, model behavior is insensitive to the value of the parameter, meaning that the nominal value can be replaced with any or almost any of the parameter values considered (10,000-fold range) without changing the qualitative behavior of the model. For other parameters, changes in qualitative behavior are seen as the value of a parameter deviates from its nominal value. However, our sensitivity analysis indicates a high degree of structural stability.
Figure 8.

Parameter sensitivity analysis. These plots summarize how Syk activation dynamics change qualitatively as the value of each of the 25 model parameters (p1, p2,…, p25) is varied around its nominal value. Recall that nominal parameter values are given in Table I. The value of each parameter was systematically varied over a 100-fold range above and a 100-fold range below its nominal value. For purposes of comparison, we also show how Syk activation dynamics change qualitatively as the input parameter c is similarly varied, with parameter values fixed at their nominal values. In either panel A or B, the parameter varied is indicated along the x-axis, and the nominal value of the parameter corresponds to zero on the y-axis. For the set of parameters considered in panel A, increasing the value of a parameter eventually leads to sustained Syk activation. For the set of parameters considered in panel B, decreasing the value of a parameter eventually leads to sustained Syk activation. The qualitative Syk activation dynamics seen at a given value of a parameter, relative to its nominal value, is indicated by shading of the bar corresponding to the parameter. White (or open) shading indicates no response to antigen signal. Shading with diagonal lines indicates a pulse response. Gray shading indicates an oscillatory response. Black (or solid) shading indicates a sustained response. A step change in c from 0 to 3 was considered as the signal for all cases, except when c itself was varied as indicated.
Structural stability is indicated by the following observations. First, even for the most sensitive parameters (e.g., p6, p1 and p11), nominal behavior is exhibited over a 2- to 3-fold range of values (Fig. 8). (Note the logarithmic scale.) To be precise, we define sensitivity of a parameter as the inverse of the height of the combined “single pulse” and “oscillations” regions of the corresponding bar in Fig. 8. We lump the two regions together because on a short time scale, the time scale for which our model was formulated, a single pulse is indistinguishable from a series of pulses. Second, no parameter is more sensitive than the input c. Third, the pattern of qualitative behaviors exhibited as a sensitive parameter is varied is the same as that seen when c is varied. For example, for p6, p1, p20, p3, and p16 (Fig. 8A), the qualitative behaviors that are exhibited as c increases from a relatively small value to a relatively large value appear in the following order: no response, single pulse, oscillations, and sustained response. Similarly, for p11, p7, p2, p15, p25 and p24 (Fig. 8B), the qualitative behaviors that are exhibited as c decreases from a relatively large value to a relatively small value appear in this same order.
The three most sensitive parameters are p6, p1, and p11, in that order. The parameter p6 is the forward rate constant for SFK SH2 domain binding to phosphotyrosine. Thus, it characterizes the positive feedback loop in the model. The parameter p1 is the copy number assigned to proteins included in the model. Responses to perturbations of individual protein copy numbers were considered in detail above (cf. Figs. 3, 5-7). The parameter p11 is the forward rate constant for SFK SH3 domain binding to a PRS in PAG1. Thus, it characterizes the negative feedback loop in the model. The least sensitive parameters, such as p9, tend to characterize interactions of Syk, which are not involved in the feedback loops captured in the model.
Discussion
To study the roles of Lyn and Fyn in BCR signaling, we applied the rule-based modeling framework of BioNetGen (34) to formulate and analyze a computational model that captures membrane-proximal signaling events involving the receptor, Lyn, Fyn, Csk, PAG1 and Syk (Fig. 1). The model tracks 10 functionally distinct sites of tyrosine phosphorylation (and dephosphorylation) in six polypeptide chains, 8 phosphorylation-dependent interactions involving SH2 domains and phosphotyrosines, two constitutive interactions between the receptor and the unique domains of Lyn and Fyn, and two constitutive interactions involving SH3 domains (in the SFKs) and proline-rich sequences (in PAG1). The model accounts for 1,122 chemical species that are connected in a network of 24,388 unidirectional reactions. This network is defined precisely but implicitly by the rules of the model (Listing S1A, Supplementary Material). To enable simulations, the network and corresponding ODEs were generated from the rules using the algorithm implemented in BioNetGen (34). The chemical kinetics are characterized by rate laws associated with the rules of the model. Thus, all reactions derived from the same rule are assigned a common rate law. As a result of this coarse-grained description of the chemical kinetics and various other simplifications, the model has only 25 parameters (Table I).
The model reproduces the known effects of Lyn and Fyn deletion (Fig. 3). For example, the model predicts that the response to an antigen signal in a Lyn−/− cell is slower than that in a WT cell (compare the dash-dot and solid curves in Fig. 3, panels B, C and D). In the model, Fyn is assumed to have lower catalytic efficiency than Lyn, and this parametric feature of the model accounts for the slower response predicted for a Lyn−/− cell. For the same reason, the model predicts that a Fyn−/− cell should respond to an antigen signal faster than a WT cell (compare the dash-dot and broken curves in Fig. 3, panels B, C and D). This prediction could perhaps be tested.
Analysis of the model through simulation, including the bifurcation analysis summarized in Fig. 5, revealed that an antigen signal can elicit several qualitatively distinct responses depending on the strength of the signal (Figs. 2 and 5) as well as the expression levels of Lyn and Fyn (Fig. 6). For example, an antigen signal can induce a pulse of Syk activation (Fig. 2A) or a sustained steady level of Syk activation (Fig. 2B). It should be noted that our bifurcation analysis demonstrates a benefit of the rule-based modeling approach that has perhaps not previously been appreciated. The model considered here is equivalent to a coupled system of 1,122 ODEs. A model of this size would not ordinarily be amenable to bifurcation analysis. However, the high-level rule-based representations of molecular interactions in the model are sufficiently intuitive that we were able to discover and characterize several interesting bifurcations (Fig. 5).
One possible response to an antigen signal is none at all (Fig. 3A), which may be important for B cell anergy and prevention of autoimmunity. Below a certain threshold, an antigen signal is unable to elicit Syk activation (Fig. 5A). The threshold for responsiveness is determined by the SFK-triggered negative feedback loop involving PAG1/Csk-mediated phosphorylation of the SFKs Lyn and Fyn (Fig. 3A; cf. panels B and D in Fig. 5). In the model, Fyn contributes to negative feedback but to a much lesser extent in the absence of Lyn, because we assume that Fyn is unable to mediate phosphorylation of its own SH2 domain binding sites in PAG1, consistent with the reported importance of Lyn in phosphorylation of PAG1 (30). Thus, Lyn plays a more important role than Fyn in setting the threshold of responsiveness. Indeed, the threshold in a Fyn−/− cell is comparable to that in a WT cell (cf. panels A and C in Fig. 5). However, Fyn does lower the strength of antigen signal required to elicit a sustained steady level of Syk activation rather than a mere pulse of Syk activation (cf. panels A and C in Fig. 5).
Above the threshold required for a response to an antigen signal, the response is sharp, with a sudden switch from off to on, after a delay (Fig. 2). The length of the delay, which can be significant (for example, see Fig. 3B), decreases with increasing signal strength. The sharpness of the response can be attributed to the positive feedback loop involving SFK-mediated phosphorylation of receptor ITAM tyrosines, recruitment of SFKs to receptors via SH2 domain-phosphotyrosine interactions, and activated receptor-dependent trans (auto)phosphorylation of tyrosines in the activation loops of receptor-bound SFKs. In a Lyn−/− cell, the positive feedback loop is responsible for the bistable hysteretic switch illustrated in Fig. 5B. In a WT or Fyn−/− cell, the bistable switching behavior is preserved at short times, because engagement of positive feedback is fast, whereas engagement of negative feedback is slow. As a result, the positive and negative feedback loops are engaged sequentially, and at intermediate signal strengths, the effects of the positive and negative feedback loops lead to relaxation oscillations, as illustrated in panels A and C of Fig. 5. In a WT or Fyn−/− cell, for a sufficiently strong antigen signal, Syk activation is sustained and steady after BCR signaling is ignited (Fig. 2B; panels A and C in Fig. 5). Based on the above considerations, we conclude that Lyn and Fyn are redundant with respect to generation of switch-like responses to antigen. However, Lyn is required for a transient response (cf. panels B and C in Fig. 5).
Our model accounts explicitly only for two SFKs expressed in B cells, Lyn and Fyn, and then only a circumscribed set of interactions of these SFKs. Other SFKs, such as Blk, Src, and Yes, and interactions of Lyn and Fyn not considered in our model may contribute to BCR signaling. Moreover, it has been suggested that PAG1 is dispensable in T cells (70). Thus, the deletions as considered in our analysis may not reproduce the true effects of these deletions if there is redundancy unaccounted for in our model. To evaluate the potential effects of redundancy, we considered knockdowns (vs. knockouts) of Lyn and PAG1 (Fig. 7). We did not consider knockdown of Fyn (which putatively contributes to negative feedback only in the presence of Lyn) or Csk, because it appears that Csk is essential for Csk/PAG1-mediated negative feedback (69). Interestingly, we found that PAG1 knockdown has a less severe effect on BCR signaling dynamics than Csk knockout. We take PAG1 knockdown to be equivalent to PAG1 knockout if there is a protein that can take the place of PAG1. Thus, under the assumption that a protein exists that can compensate for PAG1 deletion, our results are consistent with the observed relative severities of Csk and PAG1 knockouts (69, 70).
In the model, positive feedback is engaged quickly, whereas negative feedback is engaged slowly. This feature of the model, which is dependent on our parameter estimates, is supported by the following considerations. SFK-mediated phosphorylation of the Ig-α/β ITAMs and the sequelae are among the earliest events in BCR signaling (8). Thus, it seems reasonable to expect fast engagement of positive feedback. Negative feedback requires enhanced SFK-mediated phosphorylation of PAG1 and enhanced recruitment of Csk to PAG1. In the model, the rate constant for Csk binding to PAG1, p15, is smaller by two orders of magnitude than the rate constant for SFK SH2 domain-mediated binding reactions, p6 (Table I). The rationale is that slow engagement of negative feedback is needed to allow ignition of BCR signaling, because in the model, the effect of negative feedback, SFK autoinhibition, is long lasting and dominant. Autoinhibition is dominant because we assume that an autoinhibited SFK is excluded from signaling. We expect autoinhibition to be long lasting because autoinhibition is maintained by multiple intramolecular interactions (21). Consistent with this expectation, we set the rate constant for disassembly of the autoinhibited configuration of a SFK, p3, to a value that yields a half-life of ≈ 38 minutes for escape from autoinhibition (Table I). Parameter estimates are considerably uncertain, but the qualitative features of BCR signaling dynamics that we have uncovered in our analysis are likely to be robust to parameter uncertainty so long as negative feedback is slower than positive feedback.
Through analyses of low-dimensional ODE models, Fuss et al. (71, 72) and Kaimachnikov and Kholodenko (73) have demonstrated that SFK regulation by Csk and PAG1 can produce bistability and excitable behavior. Our analysis, based on a high-dimensional model incorporating mechanistic details for a specific cell signaling system, demonstrates that these dynamical properties are expected features of BCR signaling. Moreover, our results go beyond the earlier related results by demonstrating, for example, that bistable switching and excitable behavior are influenced by the relative expression levels of SFKs (Fig. 6). SFKs have been included in a number of computational models for early events in immunoreceptor signaling (56, 74-76). However, the model presented here may be the first to explicitly include antigen-responsive regulation of SFK activity by Csk and PAG1. Models for FcεRI signaling (56, 76) have assumed that a small pool of Lyn of constant size is available to interact with receptors. In our model, the SFK pool is also small but the size is not constant. The amount of SFK available to participate in signaling changes during the response to antigen (Fig. 2).
A curious predicted dynamical property of BCR signaling is the potential for an antigen signal to trigger a pulse of receptor ITAM phosphorylation (Fig. 2A). Intriguingly, Hernandez-Hansen et al. (31) have reported that phosphorylation of FcεRI, as measured by Western blotting, is more transient in WT than in Lyn−/− BMMCs. A FRET assay developed by Pierce and co-workers (77), which has been applied to monitor Lyn association with BCR (78), could perhaps be used in combination with knockdown or overexpression of Lyn or Fyn to directly observe pulses at the single-cell level. As indicated in Fig. 6, changing the copy number of Lyn or Fyn can push BCR signaling toward (or away from) relaxation oscillations.
Studies of Lyn deletion have revealed that Lyn’s role in immunoreceptor signaling is redundant to some extent and that Lyn has negative as well as positive effects on signaling (24-31). Indeed, Lyn knockout mice are highly susceptible to autoimmune diseases (26, 27). The model that we have formulated and analyzed here reproduces known effects of Lyn deletion and provides mechanistic explanations for them. Slower responses to antigen signals in Lyn−/− cells can be explained by Lyn having higher kinase activity than other SFKs, such as Fyn. Negative effects of Lyn can arise, at least in part, from the ability of Lyn to mediate phosphorylation of SH2 domain binding sites in PAG1 (for its own SH2 domain as well as the SH2 domain of Fyn), which is crucial for antigen-responsive negative feedback. Our analysis suggests that Lyn plays an important role in setting the threshold for responsiveness to antigen signals and that Lyn is responsible for generation of pulse-like, transient responses to antigen signals at the single-cell level.
Because BCR signaling, particularly Syk activation, is coupled to downstream calcium signaling, and because differences in the dynamics of calcium signaling can lead to different patterns of gene regulation in B cells (79), Lyn, acting as a pulse generator, may be especially important for eliciting appropriate cellular responses to antigen signals just above the threshold of responsiveness. Pulses generated by the action of Lyn have a signal-independent amplitude (Fig. 5A) and a signal-dependent duration (Fig. S2A, Supplementary Material). We have demonstrated that a change in the copy number of Lyn or Fyn can qualitatively change the response to an antigen signal, shifting a response from a pulse to a sustained steady output or vice versa. This insight suggests that regulation of Lyn and Fyn expression levels might play an important role in controlling B cell responses to antigen and that a search for relaxation oscillations in BCR signaling might be feasible in the future with single-cell assays and systematic knockdown and overexpression experiments. In addition, the results presented here could potentially serve as a guide for a synthetic biology approach to the study of design principles in cell signaling (80).
Supplementary Material
Acknowledgements
We thank the anonymous reviewers for their helpful critiques.
This work was supported by Foundation for Polish Science grant No. TEAM 2009-3/6, Polish Ministry for Science and Higher Education Grant N N501 132936, National Institutes of Health grants No. GM076570 and GM085273, and U.S. Department of Energy contract No. DE-AC52-06NA25396.
Abbreviations used in this paper
- SFK
Src family protein tyrosine kinase
- mIg
membrane immunoglobulin
- pY
phosphorylated tyrosine
- PRS
proline-rich sequence
- SH2
Src homology 2
- SH3
Src homology 3
- FcεRI
high-affinity IgE receptor
- BMMC
bone marrow-derived mast cell
- BNGL
BioNetGen language
- ODE
ordinary differential equation
- SNIC
saddle-node-on-invariant-circle
- WT
wild type
- Lyn−/−
Lyn-deleted
- Fyn−/−
Fyn-deleted
- PAG1−/−
PAG1-deleted
- Csk−/−
Csk deleted
- Lynup/up
Lyn C-terminal regulatory tyrosine mutated
- FRET
Förster resonance energy transfer
References
- 1.Kurosaki T, Shinohara H, Baba Y. B cell signaling and fate decision. Annu. Rev. Immunol. 2010;28:21–55. doi: 10.1146/annurev.immunol.021908.132541. [DOI] [PubMed] [Google Scholar]
- 2.Cambier JC. Antigen and Fc receptor signaling: the awesome power of the immunoreceptor tyrosine-based activation motif (ITAM) J. Immunol. 1995;155:3281–3285. [PubMed] [Google Scholar]
- 3.Flaswinkel H, Reth M. Dual role of the tyrosine activation motif of the Ig-α protein during signal transduction via the B cell antigen receptor. Embo J. 1994;13:83–89. doi: 10.1002/j.1460-2075.1994.tb06237.x. [DOI] [PMC free article] [PubMed] [Google Scholar]
- 4.Rolli V, Gallwitz M, Wossning T, Flemming A, Schamel WWA, Zürn C, Reth M. Amplification of B cell antigen receptor signaling by a Syk/ITAM positive feedback loop. Mol Cell. 2002;10:1057–1069. doi: 10.1016/s1097-2765(02)00739-6. [DOI] [PubMed] [Google Scholar]
- 5.Kurosaki T, Hikida M. Tyrosine kinases and their substrates in B lymphocytes. Immunol. Rev. 2009;228:132–148. doi: 10.1111/j.1600-065X.2008.00748.x. [DOI] [PubMed] [Google Scholar]
- 6.Geahlen RL. Syk and pTyr’d: signaling through the B cell antigen receptor. Biochim. Biophys. Acta. 2009;1793:1115–1127. doi: 10.1016/j.bbamcr.2009.03.004. [DOI] [PMC free article] [PubMed] [Google Scholar]
- 7.Gauld SB, Cambier JC. Src-family kinases in B-cell development and signaling. Oncogene. 2004;23:8001–8006. doi: 10.1038/sj.onc.1208075. [DOI] [PubMed] [Google Scholar]
- 8.Dal Porto JM, Gauld SB, Merrell KT, Mills D, Pugh-Bernard AE, Cambier J. B cell antigen receptor signaling 101. Mol Immunol. 2004;41:599–613. doi: 10.1016/j.molimm.2004.04.008. [DOI] [PubMed] [Google Scholar]
- 9.Pleiman CM, Abrams C, Gauen LT, Bedzyk W, Jongstra J, Shaw AS, Cambier JC. Distinct p53/56lyn and p59fyn domains associate with nonphosphorylated and phosphorylated Ig-α. Proc Natl Acad Sci USA. 1994;91:4268–4272. doi: 10.1073/pnas.91.10.4268. [DOI] [PMC free article] [PubMed] [Google Scholar]
- 10.Clark MR, Johnson SA, Cambier JC. Analysis of Ig-α--tyrosine kinase interaction reveals two levels of binding specificity and tyrosine phosphorylated Ig-α stimulation of Fyn activity. EMBO J. 1994;13:1911–1919. doi: 10.1002/j.1460-2075.1994.tb06460.x. [DOI] [PMC free article] [PubMed] [Google Scholar]
- 11.Sotirellis N, Johnson TM, Hibbs ML, Stanley IJ, Stanley E, Dunn AR, Cheng HC. Autophosphorylation induces autoactivation and a decrease in the Src homology 2 domain accessibility of the Lyn protein kinase. J Biol Chem. 1995;270:29773–29780. doi: 10.1074/jbc.270.50.29773. [DOI] [PubMed] [Google Scholar]
- 12.Parsons SJ, Parsons JT. Src family kinases, key regulators of signal transduction. Oncogene. 2004;23:7906–7909. doi: 10.1038/sj.onc.1208160. [DOI] [PubMed] [Google Scholar]
- 13.Kurosaki T, Johnson SA, Pao L, Sada K, Yamamura H, Cambier JC. Role of the Syk autophosphorylation site and SH2 domains in B cell antigen receptor signaling. J Exp Med. 1995;182:1815–1823. doi: 10.1084/jem.182.6.1815. [DOI] [PMC free article] [PubMed] [Google Scholar]
- 14.DeFranco AL. Transmembrane signaling by antigen receptors of B and T lymphocytes. Curr Opin Cell Biol. 1995;7:163–175. doi: 10.1016/0955-0674(95)80024-7. [DOI] [PubMed] [Google Scholar]
- 15.Rowley RB, Burkhardt AL, Chao HG, Matsueda GR, Bolen JB. Syk protein-tyrosine kinase is regulated by tyrosine-phosphorylated Igα/Igβ immunoreceptor tyrosine activation motif binding and autophosphorylation. J Biol Chem. 1995;270:11590–11594. doi: 10.1074/jbc.270.19.11590. [DOI] [PubMed] [Google Scholar]
- 16.Sada K, Takano T, Yanagi S, Yamamura H. Structure and function of Syk protein-tyrosine kinase. J Biochem. 2001;130:177–186. doi: 10.1093/oxfordjournals.jbchem.a002970. [DOI] [PubMed] [Google Scholar]
- 17.Ingley E, Schneider JR, Payne CJ, McCarthy DJ, Harder KW, Hibbs ML, Klinken SP. Csk-binding protein mediates sequential enzymatic down-regulation and degradation of Lyn in erythropoietin-stimulated cells. J Biol Chem. 2006;281:31920–31929. doi: 10.1074/jbc.M602637200. [DOI] [PubMed] [Google Scholar]
- 18.Solheim SA, Petsalaki E, Stokka AJ, Russell RB, Taskén K, Berge T. Interactions between the Fyn SH3-domain and adaptor protein Cbp/PAG derived ligands, effects on kinase activity and affinity. FEBS J. 2008;275:4863–4874. doi: 10.1111/j.1742-4658.2008.06626.x. [DOI] [PubMed] [Google Scholar]
- 19.Solheim SA, Torgersen KM, Taskén K, Berge T. Regulation of FynT function by dual domain docking on PAG/Cbp. J Biol Chem. 2008;283:2773–2783. doi: 10.1074/jbc.M705215200. [DOI] [PubMed] [Google Scholar]
- 20.Okada M, Nada S, Yamanashi Y, Yamamoto T, Nakagawa H. CSK: a protein-tyrosine kinase involved in regulation of src family kinases. J Biol Chem. 1991;266:24249–24252. [PubMed] [Google Scholar]
- 21.Ingley E. Src family kinases: regulation of their activities, levels and identification of new pathways. Biochim Biophys Acta. 2008;1784:56–65. doi: 10.1016/j.bbapap.2007.08.012. [DOI] [PubMed] [Google Scholar]
- 22.Walker JA, Smith KGC. CD22: an inhibitory enigma. Immunology. 2007;123:314–325. doi: 10.1111/j.1365-2567.2007.02752.x. [DOI] [PMC free article] [PubMed] [Google Scholar]
- 23.Heizmann B, Reth M, Infantino S. Syk is a dual-specificity kinase that self-regulates the signal output from the B-cell antigen receptor. Proc. Natl. Acad. Sci. USA. 2010;107:18563–18568. doi: 10.1073/pnas.1009048107. [DOI] [PMC free article] [PubMed] [Google Scholar]
- 24.Horikawa K, Nishizumi H, Umemori H, Aizawa S, Takatsu K, Yamamoto T. Distinctive roles of Fyn and Lyn in IgD- and IgM-mediated signaling. Int Immunol. 1999;11:1441–1449. doi: 10.1093/intimm/11.9.1441. [DOI] [PubMed] [Google Scholar]
- 25.Yamashita Y, Charles N, Furumoto Y, Odom S, Yamashita T, Gilfillan AM, Constant S, Bower MA, Ryan JJ, Rivera J. Cutting edge: genetic variation influences FcεRI-induced mast cell activation and allergic responses. J Immunol. 2007;179:740–743. doi: 10.4049/jimmunol.179.2.740. [DOI] [PubMed] [Google Scholar]
- 26.Hibbs ML, Tarlinton DM, Armes J, Grail D, Hodgson G, Maglitto R, Stacker SA, Dunn AR. Multiple defects in the immune system of Lyn-deficient mice, culminating in autoimmune disease. Cell. 1995;83:301–311. doi: 10.1016/0092-8674(95)90171-x. [DOI] [PubMed] [Google Scholar]
- 27.Nishizumi H, Taniuchi I, Yamanashi Y, Kitamura D, Ilic D, Mori S, Watanabe T, Yamamoto T. Impaired proliferation of peripheral B cells and indication of autoimmune disease in lyn-deficient mice. Immunity. 1995;3:549–560. doi: 10.1016/1074-7613(95)90126-4. [DOI] [PubMed] [Google Scholar]
- 28.Chan VW, Meng F, Soriano P, DeFranco AL, Lowell CA. Characterization of the B lymphocyte populations in Lyn-deficient mice and the role of Lyn in signal initiation and down-regulation. Immunity. 1997;7:69–81. doi: 10.1016/s1074-7613(00)80511-7. [DOI] [PubMed] [Google Scholar]
- 29.Chan VW, Lowell CA, DeFranco AL. Defective negative regulation of antigen receptor signaling in Lyn-deficient B lymphocytes. Curr Biol. 1998;8:545–553. doi: 10.1016/s0960-9822(98)70223-4. [DOI] [PubMed] [Google Scholar]
- 30.Odom S, Gomez G, Kovarova M, Furumoto Y, Ryan JJ, Wright HV, Gonzalez-Espinosa C, Hibbs ML, Harder KW, Rivera J. Negative regulation of immunoglobulin E-dependent allergic responses by Lyn kinase. J Exp Med. 2004;199:1491–1502. doi: 10.1084/jem.20040382. [DOI] [PMC free article] [PubMed] [Google Scholar]
- 31.Hernandez-Hansen V, Smith AJ, Surviladze Z, Chigaev A, Mazel T, Kalesnikoff J, Lowell CA, Krystal G, Sklar LA, Wilson BS, Oliver JM. Dysregulated FcεRI signaling and altered Fyn and SHIP activities in Lyn-deficient mast cells. J Immunol. 2004;173:100–112. doi: 10.4049/jimmunol.173.1.100. [DOI] [PubMed] [Google Scholar]
- 32.Hlavacek WS, Faeder JR, Blinov ML, Posner RG, Hucka M, Fontana W. Rules for modeling signal-transduction systems. Sci STKE. 2006;2006:re6. doi: 10.1126/stke.3442006re6. [DOI] [PubMed] [Google Scholar]
- 33.Blinov ML, Faeder JR, Goldstein B, Hlavacek WS. BioNetGen: software for rule-based modeling of signal transduction based on the interactions of molecular domains. Bioinformatics. 2004;20:3289–3291. doi: 10.1093/bioinformatics/bth378. [DOI] [PubMed] [Google Scholar]
- 34.Faeder JR, Blinov ML, Hlavacek WS. Rule-based modeling of biochemical systems with BioNetGen. Methods Mol Biol. 2009;500:113–167. doi: 10.1007/978-1-59745-525-1_5. [DOI] [PubMed] [Google Scholar]
- 35.Hlavacek WS, Faeder JR, Blinov ML, Perelson AS, Goldstein B. The complexity of complexes in signal transduction. Biotechnol Bioeng. 2003;84:783–794. doi: 10.1002/bit.10842. [DOI] [PubMed] [Google Scholar]
- 36.Mayer BJ, Blinov ML, Loew LM. Molecular machines or pleiomorphic ensembles: signaling complexes revisited. J Biol. 2009;8:81. doi: 10.1186/jbiol185. [DOI] [PMC free article] [PubMed] [Google Scholar]
- 37.Moraru II, Schaff JC, Slepchenko BM, Blinov ML, Morgan F, Lakshminarayana A, Gao F, Li Y, Loew LM. Virtual Cell modelling and simulation software environment. IET Syst Biol. 2008;2:352–362. doi: 10.1049/iet-syb:20080102. [DOI] [PMC free article] [PubMed] [Google Scholar]
- 38.Clarke EM, Faeder JR, Langmead CJ, Harris LA, Jha SK, Legay A. Statistical model checking in BioLab: applications to the automated analysis of T-cell receptor signaling pathway. Lect. Notes Comput. Sci. 2008;5307:231–250. [Google Scholar]
- 39.Colvin J, Monine MI, Faeder JR, Hlavacek WS, Von Hoff DD, Posner RG. Simulation of large-scale rule-based models. Bioinformatics. 2009;25:910–917. doi: 10.1093/bioinformatics/btp066. [DOI] [PMC free article] [PubMed] [Google Scholar]
- 40.Gruenert G, Ibrahim B, Lenser T, Lohel M, Hinze T, Dittrich P. Rule-based spatial modeling with diffusing, geometrically constrained molecules. BMC Bioinformatics. 2010;11:307. doi: 10.1186/1471-2105-11-307. [DOI] [PMC free article] [PubMed] [Google Scholar]
- 41.Colvin J, Monine MI, Gutenkunst RN, Hlavacek WS, Von Hoff DD, Posner RG. RuleMonkey: software for stochastic simulation of rule-based models. BMC Bioinformatics. 2010;11:404. doi: 10.1186/1471-2105-11-404. [DOI] [PMC free article] [PubMed] [Google Scholar]
- 42.Sneddon MW, Faeder JR, Emonet T. Efficient modeling, simulation and coarse-graining of biological complexity with NFsim. Nat Methods. 2011;8:177–183. doi: 10.1038/nmeth.1546. [DOI] [PubMed] [Google Scholar]
- 43.Xu W, Smith AM, Faeder JR, Marai GE. RuleBender: a visual interface for rule-based modeling. Bioinformatics. 2011;27:1721–1722. doi: 10.1093/bioinformatics/btr197. [DOI] [PMC free article] [PubMed] [Google Scholar]
- 44.Chylek LA, Hu B, Blinov ML, Emonet T, Faeder JR, Goldstein B, Gutenkunst RN, Haugh JM, Lipniacki T, Posner RG, Yang J, Hlavacek WS. Guidelines for visualizing and annotating rule-based models. Mol Biosyst. 2011 doi: 10.1039/c1mb05077j. doi:10.1039/c1031mb05077j. [DOI] [PMC free article] [PubMed] [Google Scholar]
- 45.Hucka M, Finney A, Sauro HM, Bolouri H, Doyle JC, Kitano H, Arkin AP, Bornstein BJ, Bray D, Cornish-Bowden A, Cuellar AA, Dronov S, Gilles ED, Ginkel M, Goryanin V. Gor, II, Hedley WJ, Hodgman TC, Hofmeyr JH, Hunter PJ, Juty NS, Kasberger JL, Kremling A, Kummer U, Le Novere N, Loew LM, Lucio D, Mendes P, Minch E, Mjolsness ED, Nakayama Y, Nelson MR, Nielsen PF, Sakurada T, Schaff JC, Shapiro BE, Shimizu TS, Spence HD, Stelling J, Takahashi K, Tomita M, Wagner J, Wang J. The systems biology markup language (SBML): a medium for representation and exchange of biochemical network models. Bioinformatics. 2003;19:524–531. doi: 10.1093/bioinformatics/btg015. [DOI] [PubMed] [Google Scholar]
- 46.Treanor B. B cell receptor: from resting state to activate. Immunology. 2012 doi: 10.1111/j.1365-2567.2012.03564.x. doi: 10.1111/j.1365-2567.2012.03564.x. [DOI] [PMC free article] [PubMed] [Google Scholar]
- 47.Szopa P, Lipniacki T, Kazmierczak B. Exact solutions to a spatially extended model of kinase-receptor interaction. Phys Biol. 2011;8:055005. doi: 10.1088/1478-3975/8/5/055005. [DOI] [PubMed] [Google Scholar]
- 48.Hat B, Kazmierczak B, Lipniacki T. B cell activation triggered by the formation of the small receptor cluster: a computational study. PLoS Comput Biol. 2011;7:e1002197. doi: 10.1371/journal.pcbi.1002197. [DOI] [PMC free article] [PubMed] [Google Scholar]
- 49.Couture C, Williams S, Gauthier N, Tailor P, Mustelin T. Role of Tyr518 and Tyr519 in the regulation of catalytic activity and substrate phosphorylation by Syk protein-tyrosine kinase. Eur J Biochem. 1997;246:447–451. doi: 10.1111/j.1432-1033.1997.00447.x. [DOI] [PubMed] [Google Scholar]
- 50.Woodard SL, Aldo-Benson M, Roess DA, Barisas BG. Flow cytometric analysis of T-independent antigen binding to dinitrophenyl-specific cells. J Immunol. 1995;155:163–171. [PubMed] [Google Scholar]
- 51.Wiest DL, Burkhardt JK, Hester S, Hortsch M, Meyer DI, Argon Y. Membrane biogenesis during B cell differentiation: most endoplasmic reticulum proteins are expressed coordinately. J. Cell Biol. 1990;110:1501–1511. doi: 10.1083/jcb.110.5.1501. [DOI] [PMC free article] [PubMed] [Google Scholar]
- 52.Strokotov DI, Yurkin MA, Gilev KV, van Bockstaele DR, Hoekstra AG, Rubtsov NB, Maltsev VP. Is there a difference between T- and B-lymphocyte morphology? J Biomed Opt. 2009;14:064036. doi: 10.1117/1.3275471. [DOI] [PubMed] [Google Scholar]
- 53.Heiniger HJ, Riedwyl H, Giger H, Sordat B, Cottier H. Ultrastructural differences between thymic and lymph node small lymphocytes of mice: nucleolar size and cytoplasmic volume. Blood. 1967;30:288–300. [PubMed] [Google Scholar]
- 54.Boggon TJ, Eck MJ. Structure and function of Src family kinases. Oncogene. 2004;23:7918–7927. doi: 10.1038/sj.onc.1208081. [DOI] [PubMed] [Google Scholar]
- 55.Wofsy C, Torigoe C, Kent UM, Metzger H, Goldstein B. Exploiting the difference between intrinsic and extrinsic kinases: implications of regulation of signaling by immunoreceptors. J. Immunol. 1997;159:5984–5992. [PubMed] [Google Scholar]
- 56.Faeder JR, Hlavacek WS, Reischl I, Blinov ML, Metzger H, Redondo A, Wofsy C, Goldstein B. Investigation of early events in FcεRI-mediated signaling using a detailed mathematical model. J. Immunol. 2003;170:3769–3781. doi: 10.4049/jimmunol.170.7.3769. [DOI] [PubMed] [Google Scholar]
- 57.Bai H, Yang K, Yu D, Zhang C, Chen F, Lai L. Predicting kinetic constants of protein-protein interactions based on structural properties. Proteins. 2011;79:720–734. doi: 10.1002/prot.22904. [DOI] [PubMed] [Google Scholar]
- 58.Ladbury JE, Arold ST. Energetics of Src homology domain interactions in receptor tyrosine kinase-mediated signaling. Methods Enzymol. 2011;488:147–183. doi: 10.1016/B978-0-12-381268-1.00007-0. [DOI] [PubMed] [Google Scholar]
- 59.de Mol NJ, Catalina MI, Dekker FJ, Fischer MJE, Heck AJR, Liskamp RMJ. Protein flexibility and ligand rigidity: a thermodynamic and kinetic study of ITAM-based ligand binding to Syk tandem SH2. ChemBioChem. 2005;6:2261–2270. doi: 10.1002/cbic.200500141. [DOI] [PubMed] [Google Scholar]
- 60.Zhang Y, Oh H, Burton RA, Burgner JW, Geahlen RL, Post CB. Tyr130 phosphorylation triggers Syk release from antigen receptor by long-distance conformational uncoupling. Proc. Natl. Acad. Sci. USA. 2008;105:11760–11765. doi: 10.1073/pnas.0708583105. [DOI] [PMC free article] [PubMed] [Google Scholar]
- 61.Labadia ME, Ingraham RH, Schembri-King J, Morelock MM, Jakes S. Binding affinities of the SH2 domains of ZAP-70, p56 lck and Shc to the ζ chain ITAMs of the T-cell receptor determined by surface plasmon resonance. J. Leukoc. Biol. 1996;59:740–746. [PubMed] [Google Scholar]
- 62.Wavreille A-S, Garaud M, Zhang Y, Pei D. Defining SH2 domain and PTP specificity by screening combinatorial peptide libraries. Methods. 2007;42:207–219. doi: 10.1016/j.ymeth.2007.02.010. [DOI] [PMC free article] [PubMed] [Google Scholar]
- 63.Cohen SD, Hindmarsh AC. CVODE, A stiff/nonstiff ODE solver in C. Comp Phys. 1996;10:138–143. [Google Scholar]
- 64.Hindmarsh AC, Brown PN, Grant KE, Lee SL, Serban R, Shumaker DE, Woodward CS. SUNDIALS: Suite of nonlinear and differential/algebraic equation solvers. ACM Trans Math Softw. 2005;31:363–396. [Google Scholar]
- 65.Faeder JR, Blinov ML, Goldstein B, Hlavacek WS. Rule-based modeling of biochemical networks. Complexity. 2005;10:22–41. [Google Scholar]
- 66.Wiggins S. Introduction to Applied Nonlinear Dynamical Systems and Chaos. Springer-Verlag; 1990. [Google Scholar]
- 67.Hat B, Puszynski K, Lipniacki T. Exploring mechanisms of oscillations in p53 and nuclear factor-κB systems. IET Syst Biol. 2009;3:342–355. doi: 10.1049/iet-syb.2008.0156. [DOI] [PubMed] [Google Scholar]
- 68.Hibbs ML, Harder KW, Armes J, Kountouri N, Quilici C, Casagranda F, Dunn AR, Tarlinton DM. Sustained activation of Lyn tyrosine kinase in vivo leads to autoimmunity. J. Exp. Med. 2002;196:1593–1604. doi: 10.1084/jem.20020515. [DOI] [PMC free article] [PubMed] [Google Scholar]
- 69.Hata A, Sabe H, Kurosaki T, Takata M, Hanafusa H. Functional analysis of Csk in signal transduction through the B-cell antigen receptor. Mol Cell Biol. 1994;14:7306–7313. doi: 10.1128/mcb.14.11.7306. [DOI] [PMC free article] [PubMed] [Google Scholar]
- 70.Dobenecker MW, Schmedt C, Okada M, Tarakhovsky A. The ubiquitously expressed Csk adaptor protein Cbp is dispensable for embryogenesis and T-cell development and function. Mol Cell Biol. 2005;25:10533–10542. doi: 10.1128/MCB.25.23.10533-10542.2005. [DOI] [PMC free article] [PubMed] [Google Scholar]
- 71.Fuss H, Dubitzky W, Downes S, Kurth MJ. Bistable switching and excitable behaviour in the activation of Src at mitosis. Bioinformatics. 2006;22:e158–e165. doi: 10.1093/bioinformatics/btl201. [DOI] [PubMed] [Google Scholar]
- 72.Fuss H, Dubitzky W, Downes CS, Kurth MJ. Deactivation of Src family kinases: hypothesis testing using a Monte Carlo sensitivity analysis of systems-level properties. J. Comput. Biol. 2007;14:1185–1200. doi: 10.1089/cmb.2007.0095. [DOI] [PubMed] [Google Scholar]
- 73.Kaimachnikov NP, Kholodenko BN. Toggle switches, pulses and oscillations are intrinsic properties of the Src activation/deactivation cycle. FEBS J. 2009;276:4102–4118. doi: 10.1111/j.1742-4658.2009.07117.x. [DOI] [PMC free article] [PubMed] [Google Scholar]
- 74.Li Q-J, Dinner AR, Qi S, Irvine DJ, Huppa JB, Davis MM, Chakraborty AK. CD4 enhances T cell sensitivity to antigen by coordinating Lck accumulation at the immunological synapse. Nat. Immunol. 2004;5:791–799. doi: 10.1038/ni1095. [DOI] [PubMed] [Google Scholar]
- 75.Artyomov MN, Lis M, Devadas S, Davis MM, Chakraborty AK. CD4 and CD8 binding to MHC molecules primarily acts to enhance Lck delivery. Proc. Natl. Acad. Sci. USA. 2010;107:16916–16921. doi: 10.1073/pnas.1010568107. [DOI] [PMC free article] [PubMed] [Google Scholar]
- 76.Nag A, Monine MI, Blinov ML, Goldstein B. A detailed mathematical model predicts that serial engagement of IgE-FcεRI complexes can enhance Syk activation in mast cells. J. Immunol. 2010:3268. doi: 10.4049/jimmunol.1000326. [DOI] [PMC free article] [PubMed] [Google Scholar]
- 77.Sohn HW, Tolar P, Brzostowski J, Pierce SK. A method for analyzing protein-protein interactions in the plasma membrane of live B cells by fluorescence resonance energy transfer imaging as acquired by total internal reflection fluorescence microscopy. Methods Mol. Biol. 2010;591:159–183. doi: 10.1007/978-1-60761-404-3_10. [DOI] [PMC free article] [PubMed] [Google Scholar]
- 78.Sohn HW, Tolar P, Pierce SK. Membrane heterogeneities in the formation of B cell receptor-Lyn kinase microclusters and the immune synapse. J Cell Biol. 2008;182:367–379. doi: 10.1083/jcb.200802007. [DOI] [PMC free article] [PubMed] [Google Scholar]
- 79.Dolmetsch RE, Lewis RS, Goodnow CC, Healy JI. Differential activation of transcription factors induced by Ca2+ response amplitude and duration. Nature. 1997;386:855–858. doi: 10.1038/386855a0. [DOI] [PubMed] [Google Scholar]
- 80.Lim WA. Designing customized cell signalling circuits. Nat. Rev. Mol. Cell Biol. 2010;11:393–403. doi: 10.1038/nrm2904. [DOI] [PMC free article] [PubMed] [Google Scholar]
Associated Data
This section collects any data citations, data availability statements, or supplementary materials included in this article.