Abstract
Diaquacobinamide (H2O)2Cbi2+ or its conjugate base hydroxyaquacobinamide (OH(H2O)Cbi+)) can bind up to two cyanide ions, making dicyanocobinamide. This transition is accompanied by a significant change in color, previously exploited for cyanide determination. The reagent OH(H2O)Cbi+ is used in excess; when trace amounts of cyanide are added, CN(H2O)Cbi+ should be formed. But the spectral absorption of CN(H2O)Cbi+ is virtually the same as that of OH(H2O)Cbi+. It has been inexplicable how trace amounts of cyanide are sensitively measured by this reaction. It is shown here that even with excess OH(H2O)Cbi+, (CN)2Cbi is formed first due to kinetic reasons; this only slowly forms CN(H2O)Cbi+. This understanding implies that CN(H2O)Cbi+ will itself be a better reagent.
We describe a single valve merging zone flow analyzer that allows both sample and reagent economy. With a 50 cm liquid core waveguide (LCW) flow cell and an inexpensive fiber optic - charge coupled device array spectrometer, a S/N=3 limit of detection of 8 nM, a linear dynamic range to 6 μM, and excellent precision (RSD 0.49% and 1.07% at 50 and 100 nM, respectively, n=5 each) are formed. At 1% carryover, sample throughput is 40 h−1. The setup is readily used to measure thiocyanate with different reagents. We demonstrate applicability to real samples by analyzing human saliva samples and hydrolyzed extracts of apple seeds, peach pits, and almonds.
Keywords: Cyanide, Cobinamide, Merging-Zone, Liquid Core waveguide
1. Introduction
Cyanide is extremely toxic to a wide variety of life. Cyanide detection methods are of current interest because of the potential use of HCN as a weapon of terror and the role of HCN in smoke inhalation poisoning [1].
There are several recent reviews on cyanide determination [1–4]; however, more than 20 relevant publications have appeared since. A listing of these is given in the Supplementary Information (SI); few of these address biological samples. In the present context, Co(III)-center corrinoids are particularly promising for optical cyanide sensing; they are highly sensitive and selective towards [CN−] and real applications for cyanide sensing have been demonstrated [1]. Although corrinoids may contain the central Co in the +1, +2 or +3 oxidation state [5], we refer here exclusively to Co(III) – cobinamide (hereinafter Cbi). A series of CN(H2O)Cbi+ and related corrinoids lacking the nucleotide backbone (see Figure 1) has been reported [6] and the application of these compounds for optical measurement of cyanide extensively studied [7–9].
Figure 1.
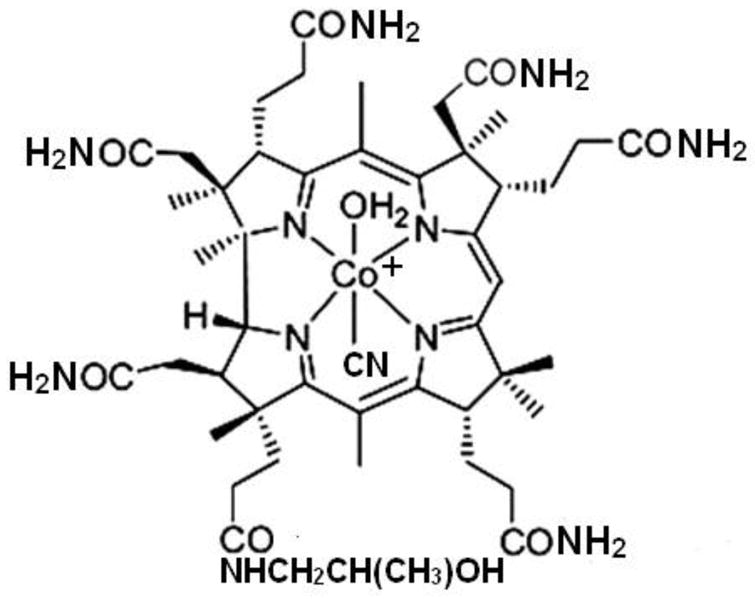
α-Cyano β-aquacobinamide. The β-cyano α-aqua diastereomer (H2O below, −CN on top) is typically present in an equal amount. Cyanoaquacobinamide used in the present paper was prepared in situ as an equimolar mixture of diastereromeric hydroxyaquacobinamide and KCN.
Boss et al. described a facile synthesis of (H2O)2Cbi2+ (Figure 1) [10]. Both water molecules are readily displaced by cyanide and it is a fast-acting high-capacity cyanide antidote [11,12]. For analytical purposes, reactions with cyanide are normally carried out in an alkaline medium; whence (H2O)2Cbi2+ (pKa ~6, [13]) is present as OH(H2O)Cbi+. Adding cyanide to OH(H2O)Cbi+ markedly changes its spectral absorption and the resulting spectral change has been used for the following purposes: (i) laboratory-based measurements of blood cyanide concentrations [14]; (ii) establishing the temperature dependent aqueous solubility of gaseous HCN [15]; (iii) as the basis of a zone penetration flow injection (FI) analyzer permitting a limit of detection (LOD) of 30 nM CN− [16]; and (iv) for point of care blood cyanide measurements using reagent-impregnated filters [17].
Although an LOD of 30 nM is very respectable for a visible absorbance-based method, relatively small improvements in LODs can be important in early warning applications. As the edge of a toxic gas plume reaches a sensor, even small gains in LOD translate to precious seconds. Rapid gas measurements by solution-phase chromogenic reactions are well known [18–20]. It is also desirable to reduce reagent consumption per assay.
Two different groups of researchers, Boss, Dasgupta et al. in the US [1, 10–12, 14–17] and Zelder et al. in Switzerland [3, 6, 7, 9, 21, 22] have independently worked in recent years on the reaction of CN− with cobinamide and related compounds, respectively using OH(H2O)Cbi+ and CN(H2O)Cbi+ or its derivatives as the preferred reagents for measuring CN−; neither choice has been rationalized. While the US researchers worked towards a more sensitive quantitative assay, the Swiss researchers focused on field-usable visual testing techniques in solution and assays on reagent-impregnated matrices.
When excess OH(H2O)Cbi+ reacts with trace CN−, OHCNCbi is presumably formed (this would protonate to form CN(H2O)Cbi+ (pKa 11.0) under most pH conditions). On the other hand, CN(H2O)Cbi+ will react with CN− to form (CN)2Cbi. We undertook this joint effort to devise the most sensitive cobinamide-based quantitative assay for CN− and thus choose the best reagent. In assessing completion of the reaction of CN− using OH(H2O)Cbi+ as the reagent, surprisingly, the sensitivity decreased with increasing reaction time despite that CN(H2O)Cbi+ is known to be very stable. In addition, if the CN−: reagent ratio exceeded 1:1 so that (CN)2Cbi must form, temporal stability of the color formed was actually higher than at lower CN− levels.
We further noted with surprise that independently synthesized authentic OH(H2O)Cbi+ and CN(H2O)Cbi+ are spectrally very similar; conversion of the former to the latter cannot possibly lead to a sensitive assay for CN−. This paper demonstrates the reactions that occur when CN− is added to OH(H2O)Cbi+ and also unequivocally identifies CN(H2O)Cbi+ as the more sensitive reagent. This reagent is used for the first time in an automated flow analyzer in a merging zone configuration [23] that permits efficient reagent use and provides, to our knowledge, the lowest LOD for cyanide (8 nM). We demonstrate several practical applications.
2. Cobinamide nomenclature, proton and cyanide binding equilibria
The nomenclature and the stereochemistry of cobinamide derivatives are important in the present context. The ligands bound axially to the central Co atom occupy either the top (β-) or the bottom (α-) face (Figure 1). The two diastereomers are thus α-hydroxy, β-aquacobinamide (OH(H2O)Cbi+, sometimes called hydroxyaquacobinamide) and β-hydroxy, α-aquacobinamide ((H2O)OHCbi+, aquahydroxycobinamide). It is possible to determine the absolute configuration [22] but here we make no differentiation; OH(H2O)Cbi+ will connote both isomers. Such diastereomers are chemically separate entities, their spectral absorption or binding constants with other ligands may differ [22–25]. We use the current nomenclature practice that specifies the anionic substituent(s) first, followed by any neutral ligand, without regard to the precise configuration.
The proton dissociation constants of (H2O)2Cbi+ reported by Baldwin et al. [26] are 5.9 (a similar value is in [13]) and 10.3 for pKa1 and pKa2, respectively. The proton dissociation constant (referred hereinafter as Ka3) of CN(H2O)Cbi+ has been determined (pKa3 = 11.0) [27]. The OH(H2O)Cbi+ diastereoisomers are readily separated by HPLC under neutral conditions and the same is true of CN(H2O)Cbi+ (Figures S1 and S2); these protic equilibria are therefore far from instantaneous. However, the reaction can be ligand-catalyzed: CN− for example, has a pronounced catalytic effect [24]. Cyanide substitution rate in some corrinoids can be faster than what can be measured by stopped-flow techniques [28]. Marques et al. [29] determined the cumulative equilibrium constant β2 for the conversion of OH(H2O)Cbi+ to (CN)2Cbi to be 1019.0. Previously Hayward et al. [13] and George et al. [30] respectively reported K1 and K2 for the stepwise formation of CN(H2O)Cbi+ and (CN)2Cbi from (H2O)2Cbi2+ as ≥1014 and 108. From the other data listed above, a self-consistent value of K1 will be 1019. All the major equilibria involved in this complex system have not been compiled, and estimates provided in some publications are incorrect. Figure 2 provides this information; explanatory algebraic relationships are given in the SI.
Figure 2.

Equilibria in the cyanide- water- hydroxide - cobinamide system. Each arm of a triangle represents a given equilibrium with the equilibrium constant indicated and the source citation is indicated in parentheses. The equilibrium constants for any arm involved in a triangle can be algebraically derived if the equilibrium constant for the other two equilibria are known. Asterisked values were thus computed; details appear in the SI. The present values are self-consistent and a specific value for the formation of cyanoaquacobinamide from diaquacobinamide is indicated for the first time; this was not available previously due to the difficulty of measuring very high equilibrium constants.
3. Experimental
3.1 Reagents
All chemicals used were reagent grade or better and 18.2 MΩ·cm Milli-Q water (www.Millipore.com) was used throughout. Pure CN(H2O)Cbi+ was synthesized according to [6]. Pure OH(H2O)Cbi+ was produced by base hydrolysis of hydroxocobalamin [14]. The stock cyanide solution was KCN in 1 mM NaOH, assayed titrimetrically [31] and stored refrigerated. The carrier solution was 100 mM carbonate buffer solution (pH 10.44) [16]. The cyanide working solution was prepared in the carrier solution daily. Unbuffered CN(H2O)Cbi+ was prepared in water at 10 μM concentration by adding cyanide and OH(H2O)Cbi+ in equimolar concentrations in water.
3.2. System configuration
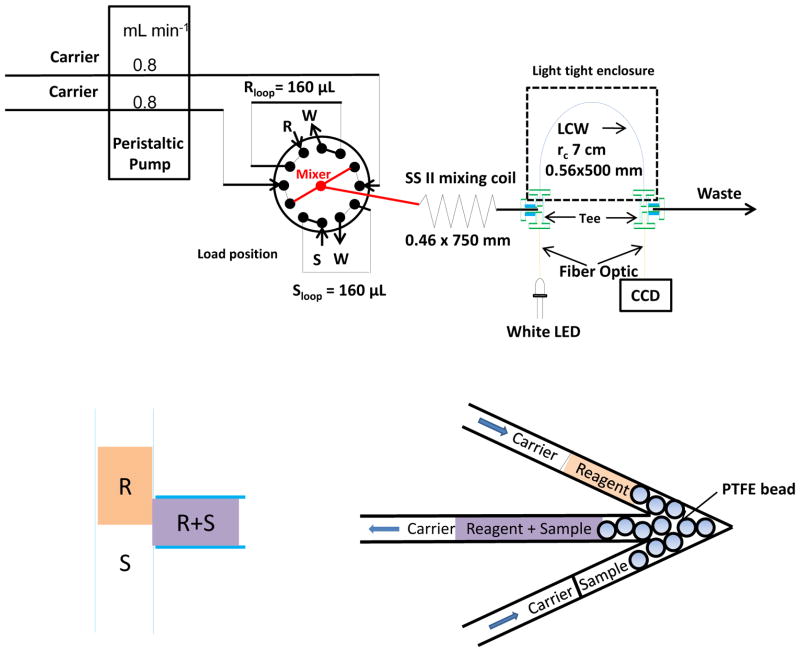
The system used a 12-port electrically controlled injection valve with PAEK wetted parts (www.vici.com) as shown (Figure 3). The peristaltic pump used had multiple channels and two were used; a single pump channel teed into the two valve inlet ports is also readily used. In the inject mode, the sample and reagent (160 μL each) are propelled to merge at a T- or an arrow-mixer (vide infra). PTFE tubing (0.81 mm i. d. type SW, www.zeusinc.com) was used throughout, except as stated.
Figure 3.
System schematic. The bottom illustration shows how the reagent mixes with the sample (left: a commercial Tee for mixing; right: arrow mixer with PTFE bead to induce mixing).
For efficient mixing, we tested a standard commercial tee (P-727, http://webstore.idex-hs.com) and a laboratory-made arrow mixer, machined from an acrylic block consisting of a 60°-V of (1.6 mm bore) with a central exit arm, each active arm length being ~1 cm, and filled with 1.0 mm dia. PTFE beads. PTFE tubes, cut at an angle to prevent blocking by a bead, were push-fit into the mixer. Either mixer was followed by a PTFE mixing coil (MC) that served as the conduit to a Teflon AF® LCW cell (L = 50 cm, Vcell = 123 μL) [16,32,33] coupled to a CCD spectrometer (USB2000, www.oceanoptics.com) and a white LED source [16]. The absorbance at 583 nm was initially used for optimization. Prior to storage or use, the LCW cell was sequentially flushed with pure water, 1 M NaOH (10 mL) and 1 M HCl (10 mL) and finally again with pure water (30 mL) [34].
3.3. Cyanide in fruit seeds
Seeds removed from fresh fruits were air-dried and ground in a micro-grinder (Wig-L-Bug MSD, www.pattersondental.com). Ground seeds (~200–400 mg) were weighed in tared 50 mL centrifuge tubes and extracted ultrasonically with carbonate buffer (pH 10.4, 10–15 mL, 100 mM) for 30 min. Following centrifugation, cyanide was determined in the supernatant, injected via a 1.2 μm nylon syringe filter. For high concentration samples, 10-fold dilution was used.
3.4. Cyanide in saliva samples
Unstimulated saliva samples were collected from healthy volunteers directly into tared 15 mL polypropylene centrifuge tubes using a protocol approved by the institutional review board at the University of Texas at Arlington. Carbonate buffer (pH 10.4, 10 mL 100 mM) was added immediately for dilution and matrix matching the sample. The tube was then reweighed. The samples were kept at 4 °C and cyanide determined within 2 h after syringe filtration. The same experimental setup in Figure 2 was also utilized for thiocyanate determination using 0.5% (v/v) HNO3 as carrier and 10 mM Fe(NO3)3 in 0.5% HNO3 as reagent. The same saliva samples were adjusted with 5% HNO3 (~1.25 mL) before injection to match the pH with the carrier.
To determine the applicability of the method to salivary CN− and SCN− after cigarette smoking, the saliva of two volunteer subjects was tested. One was a heavy (20+ cigarettes a day) smoker and the other smoked very occasionally (~≤ 3/month). Prior to sample collection, subjects did not smoke for at least one hour. Both subjects then provided a “baseline” saliva sample and smoked a standard (84 mm) non-menthol filter cigarette. Saliva samples were collected immediately after the cessation of smoking and at specified intervals thereafter.
3.5. Caution
Cyanide is toxic and hazardous. Inhalation, ingestion and skin contact must be avoided and all experiments performed in a well-ventilated hood.
4. Results and discussion
4.1 Spectral and kinetic behavior of cyanide added to hydroxoaquocobinamide
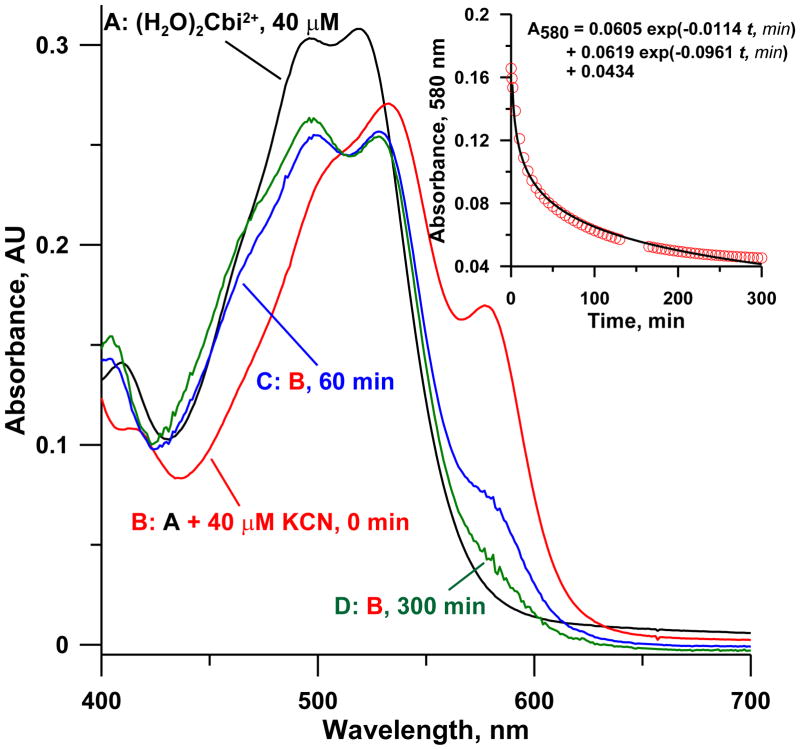
The spectral behavior of CN− added to OH(H2O)Cbi+ in a 1: 1 molar ratio is shown in Figure 4 as a function of time. An immediate spectral change occurs on adding CN−, with a new band appearing at ~580 nm that disappears very gradually. If CN− is added to OH(H2O)Cbi+ in a ≥2: 1 molar ratio, this band is also observed (vide infra) but is stable over time; this is therefore ascribed to (CN)2Cbi. The data in Figure 4 thus suggests the formation of the dicyano-species as a kinetically trapped product. Baldwin et al. [26] observed that “cyanoaquacobinamide reacts with cyanide much faster than either diaquacobinamide or hydroxyaquacobinamide” due presumably to the stronger trans-labilizing effect of CN− compared to OH− [26,30]. When OH(H2O)Cbi+ is mixed with CN− in a molar ratio greater than 1:1 as in typical assays, the formation of CN(H2O)Cbi+ is expected. Instead, both due to favorable thermodynamic and kinetic reasons, CN(OH)Cbi is formed first, and this is readily attacked by available CN− to form (CN)2Cbi, in preference to the CN− reacting with the excess OH(H2O)Cbi+ present. The (CN)2Cbi thus formed is slowly converted to the CN(H2O)Cbi+: hours are needed in water or pH 9–10 phosphate or borate buffers. Conversion to CN(OH)Cbi in more basic media (60 mM NaOH, pH 12.7) is faster and maybe base-catalyzed. But even so, ~20 min are needed to reach stable values [15]. The spectrum of CN(H2O)Cbi+ formed after long periods (D, Fig. 4) is very similar to that of OH(H2O)Cbi+; indeed if CN(H2O)Cbi+ were to form first on CN− addition, no analytical use for this as a chromogenic reagent for CN− would exist.
Figure 4.
Spectra of (A) 40 μM (H2O)2Cbi2+ in water, (B) 40 μM (H2O)2Cbi2+ immediately after spiking sufficient KCN to bring total cyanide concentration to 40 μM, (C) solution in B, after 1 h, (D) Solution in B, after 5 h. The inset shows the 580 nm absorbance due (CN)2Cbi. The decay of (CN)2Cbi to either diastereoisomer of CN(H2O)Cbi+ proceeds at two different rates. The fit to the sum of the two independent decay paths to the two diastereoisomers are depicted; the best fit half-lives are 7.2 and 61 min, respectively.
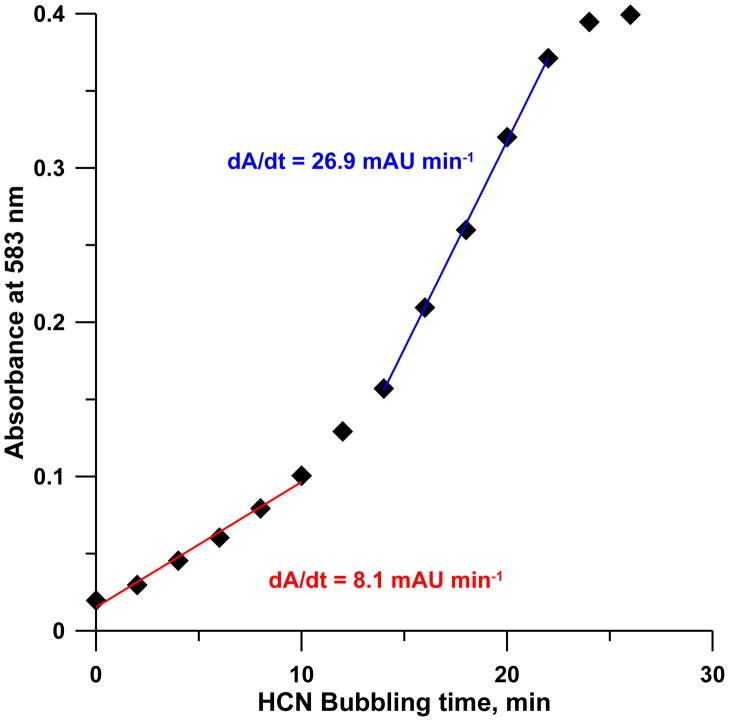
Figure 4 inset shows the fit to a model that invokes the formation of the two CN(H2O)Cbi+ diastereomers as independent first order processes such that the decay of the 580 nm band due to (CN)2Cbi can be represented as a sum of these two different routes (t1/2 ~61 and 7.2 min, respectively). Other observations support this reaction paradigm as well. When any reagents A and B are manually mixed, local excess patterns will be different if A is added to B or vice-versa. Aside from the behavior of concentrated H2SO4 and water, there are notable examples in the analytical context [35]; presently very different absorbances were observed on adding CN− to pH 9 buffered OH(H2O)Cbi+ than vice-versa. When cyanide is added to OH(H2O)Cbi+ in water in less than 1:1 molar ratio, in addition to CN(H2O)Cbi+, other poorly resolved moieties can be observed in a reversed phase HPLC separation even after days (Figure S3). When low levels of HCN(g) [15] is continuously bubbled through a 50 μM OH(H2O)Cbi+ in 0.1 M pH 9 borate buffer, a near-tripling of the d(Absorbance)/dt slope is clearly evident beginning at about the halfway point to saturation, (Figure 5). Note, however, although total reaction times are short in the early stages of this experiment, (CN)2Cbi is formed nevertheless.
Figure 5.
Parts per billion level gaseous HCN [15] is bubbled through a 50 μM OH(H2O)Cbi+ solution (pH 9.0); absorbance at 583 nm was continuously monitored. Note change in slope approximately halfway to saturation.
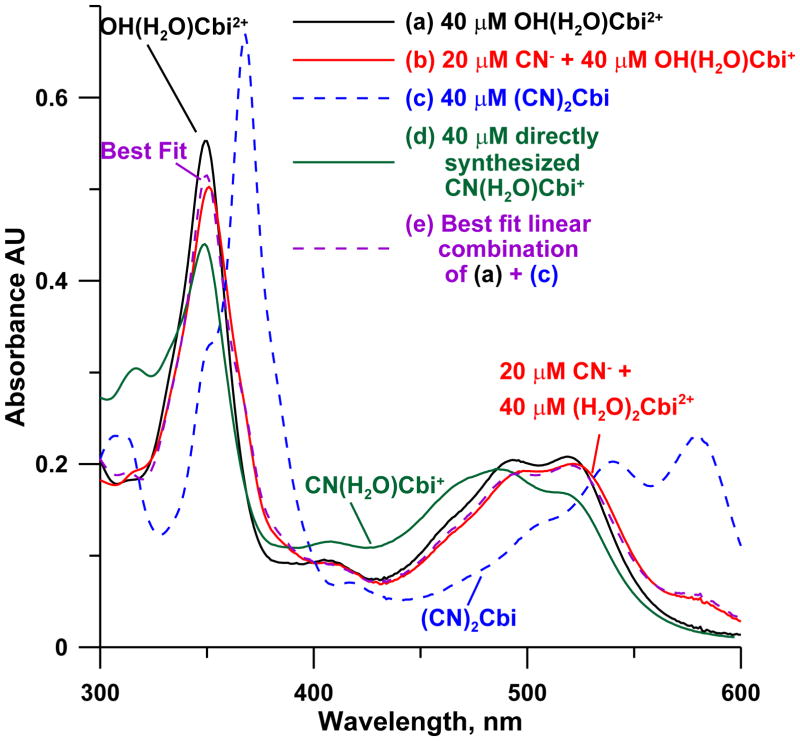
The data in Figure 6 unequivocally show that immediately upon mixing, a mixture of (H2O)2Cbi2+ with less than 1 molar equivalent of cyanide yields almost exclusively (CN)2Cbi; the observed spectra correspond closely to a linear combination of the spectra of (H2O)2Cbi2+ and (CN)2Cbi, rather than CN(H2O)Cbi+.
Figure 6.
The spectra of (a) 40 μM OH(H2O)Cbi+, (b) sufficient CN− spiked to a to bring total CN− concentration to 20 μM, immediately after mixing, (c) >80 μM CN− spiked into a, (d) spectra of 40 μM CN(H2O)Cbi+ directly synthesized according to [6]. The spectrum in b is a poor match to d but matches (e) a linear combination of a and c, showing (CN)2Cbi and not CN(H2O)Cbi+ must be initially formed.
Starting from CN(H2O)Cbi+ rather than OH(H2O)Cbi+ also provides a more sensitive temporally stable response. In manual experiments in 1 cm cells, the calibration slope was 8.19 ± 0.11 AU mM−1 CN− vs. 4.01–4.22 AU mM−1 CN− reported for OH(H2O)Cbi+ [15]. If OH(H2O)Cbi has the same spectral absorption as CN(H2O)Cbi+, and both form (CN)2Cbi on CN− addition, then CN(H2O)Cbi+ will generate twice as much (CN)2Cbi on CN− addition. Thus the calibration slope with CN(H2O)Cbi+ should be two-fold higher. Preparations of CN(H2O)Cbi+ in high pH carbonate buffers (10.4 [16]) are, however, unstable, with unreactive (OH)2Cbi formed over time [7,26]. In a merging zone arrangement, an alkaline carrier suffices.
4.2. Parametric optimization
Sample and reagent loop volumes, carrier flow rate, and mixing conditions were varied to optimize sensitivity and throughput rate. Each experiment was conducted in triplicate; results are reported as average ± standard deviation (SD).
4.2.1. Effect of sample/reagent loop volume and flow rate
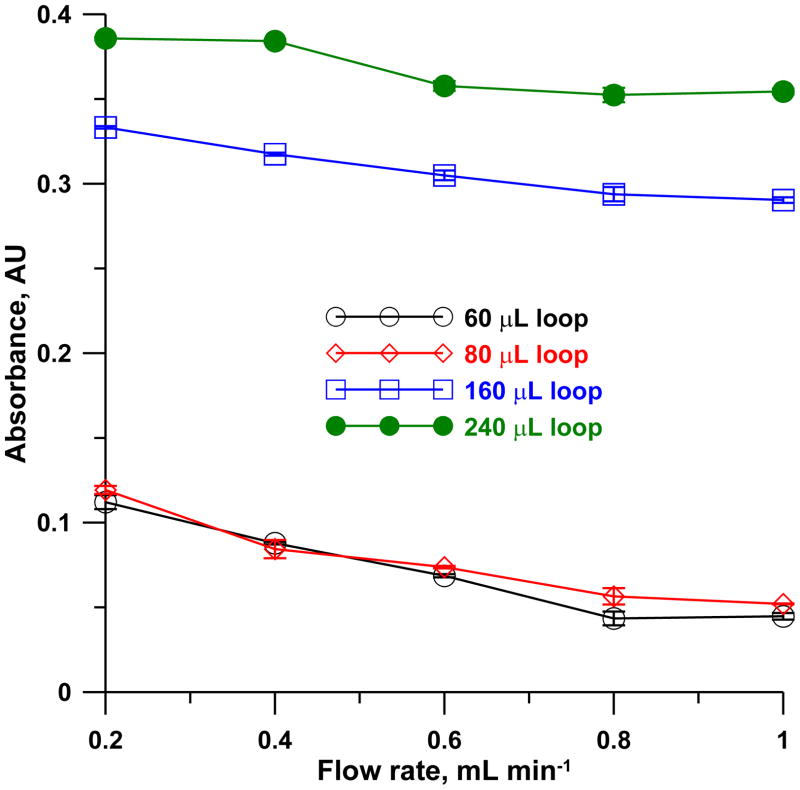
In a merging zone arrangement, unequal sample and reagent volumes present no advantages; volumetric excess of one largely trails behind the other and remains unreacted. The data for different sample/reagent loop volumes (Vloop = 60, 80, 160 and 240 μL) at different carrier flow rates are shown in Figure 7. The signals have little dependence on flow rate but increase with increasing sample volumes. In going from Vloop = 160 to 240 μL, however, the sensitivity gain was ~20% for 50% greater expenditure of an expensive reagent. This was not deemed worthwhile. A total carrier flow rate of 0.8 mL min−1 and Vloop = 160 μL was, therefore, chosen.
Figure 7.
Effect of reagent-sample loop volumes as a function of flow rate on the net absorbance at 583 nm of a 2 μM cyanide sample (CN(H2O)Cbi+ concentration of 10 μM, arrow mixer, mixing coil 250 mm × 0.81 mm i.d. in 1.0 cm coiled diameter, detector 500 mm × 0.56 mm i.d. LCW). Error bars indicate ±1 SD (n=3).
4.2.2. Effect of mixing conditions
A merging zone arrangement provides better mixing and makes more efficient use of a reagent. The laboratory-designed, pearl-string style, bead-filled arrow mixer outperformed the commercial tee under all conditions, especially at higher flow rates. A similar glass bead-filled Y-mixer has been described;36 we used the reportedly superior37 arrow design. Details are presented in Figures S4 and S5 but as an example, 2 μM CN− produced a signal of 0.138 ± 0.002 and 0.294 ± 0.004 AU with the tee and the arrow mixer, respectively.
Different lengths of mixing coils (MC, following the arrow mixer) were evaluated in two geometries: 0.81 mm i. d. tubing as a 1.0 cm dia. coil and 0.46 mm i. d. tubing in the superserpentine II (SS2) design [38]. The difference was not marked; there was also little dependence on the MC length (Figure S5) suggesting that the arrow mixer already achieves good mixing and the reaction is fast. A 75 cm long MC in the SS2 design provided the best precision and was thence used.
4.3. Summing and baseline correction
Merging zone sample/reagent injection with the present chemistry leads to a substantial blank signal. Although the analyte signal is greatest at 583 nm, the analyte/blank signal ratio (note: this is not signal to noise) maximizes at slightly higher wavelengths, between 588–592 nm (See Figure S6). We summed the response from 588, 589, 590, 591 and 592 nm and used the response at 670 nm as a reference. The binning itself reduces noise compared to any single wavelength measurement and a two-fold gain in limit of detection was observed by summing the five wavelength counts rather than any single wavelength response. Absorbance was calculated as previously described [16].
4.4. Performance
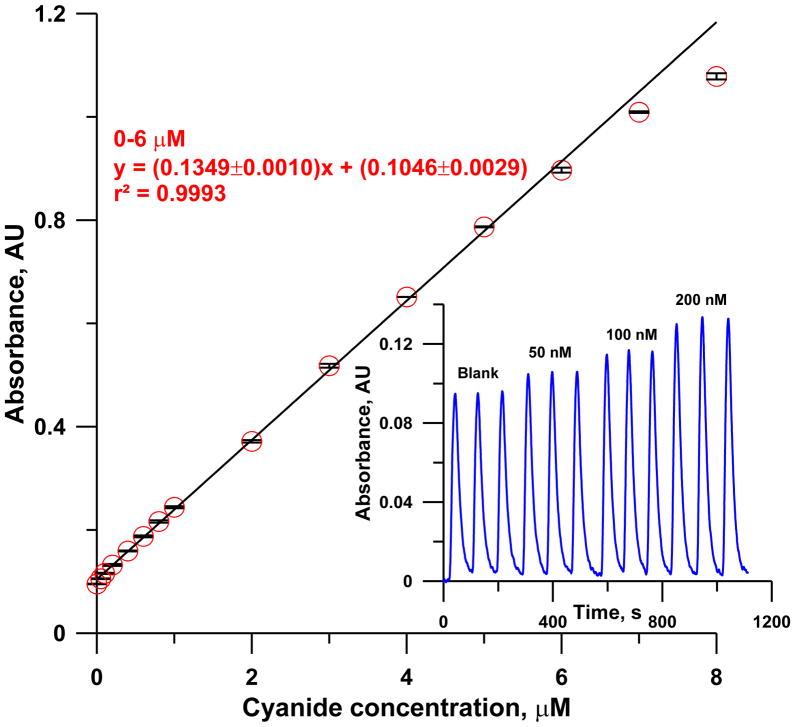
Under the optimized conditions stated above, system response to 0–8 μM CN− is shown in Figure 8. The response was linear up to 6 μM and deviated from linearity at higher concentrations. The maximum sampling frequency (with <1% carryover) was 40 h−1, sufficient to permit gas phase HCN measurement with 90 s time resolution.
Figure 8.
Calibration curve: [CN(H2O)Cbi+] = 10 μM, arrow mixer, mixing coil: 750 mm × 0.46 mm i.d. in SS2 design, detector: 500 mm × 0.56 mm i.d. LCW, flow rate: 0.8 mL min−1). The inset shows response of system to low concentrations of cyanide (0, 50, 100 and 200 nM). Error bars indicate ±1 SD (n=3).
The analyzer response to 0, 50, 100 and 200 nM cyanide samples, which are already below the LOD of most methods [1], are shown in the inset of Figure 8. The relative standard deviation of 50 and 100 nM samples were 0.49% and 1.07% (n=5 each), respectively. Based on standard deviation of the blank (Figure S7), the LOD is 8 nM, 2.5x better than the best LOD reported thus far [16].
5. Applications
5.1. Cyanide content of fruit seeds
Many plant species/products contain cyanoglucosides that release cyanide on hydrolysis [39]. Mild alkaline hydrolytic extraction used here is as effective as aggressive acid hydrolysis [16]. We measured the cyanide content of the hydrolytic extract of apple seeds, peach pits and almonds; detailed data are given in Table S1. Three batches of apple seeds were found to contain 1.75 ± 0.02, 1.30 ± 0.02 and 1.03 ± 0.06 mg CN− kg−1 seed; the corresponding values for peach pits and almonds were much higher: 14.7 ± 0.08, 6.78 ± 0.22, 9.22 ± 0.46 and 8.55 ± 0.37, 6.60 ± 0.16 and 6.24 ± 0.14 mg kg−1, respectively. In separate experiments, 1 μM spike recoveries in these extracts ranged between 94.7–104.3%.
5.2. Cyanide and thiocyanate in saliva
Saliva analysis is increasingly attractive for large scale use due to its non-invasive nature and low cost. We measured salivary [CN−] in several healthy non-smoking volunteers as 3.92 ± 0.01, 3.95 ± 0.12, 4.54 ± 0.14, 4.79 ± 0.15, and 6.07 ± 0.57 μM. Spike recoveries ranged from 91.1–104.3% (Table S2). Literature values for salivary [CN−] in non-smokers range from <0.4 μM to >11 μM [40–44]. Some flavored sodas markedly increased salivary [CN−]; in one case the baseline salivary [CN−] (~4–5 μM) increased to 14 μM shortly after consuming the beverage. Rhodanese [45] detoxifies CN− to SCN−, it is primarily present in the liver but some may be present in saliva. Either for 3 h at 4 °C or ~2 h at room temperature, cyanide loss was statistically insignificant (Figure S8). No interference from SCN− was found: 1 mM SCN− caused < ±5% error in the determination of 0.2 μM salivary CN−.
Cigarette smoke pHCN levels range up to 210 parts per million by volume (ppmv) [46]. Levels of salivary SCN− are very different in nonsmokers and smokers [47]. Flow injection based measurement of SCN− with excess [Fe(OH2)6]3+ to form colored [Fe(OH2)5SCN]2+is well known [48], readily implemented in the present analyzer and CN− does not interfere in this reaction [4]; it has already been used for measuring salivary [SCN−] [49,50]. The same setup was used as in Figure 2, except with a shorter LCW length of 20 cm to cover the sample concentration range, with the absorbance measured at 490 nm. The effects of acidity and carrier flow rate were studied with 100 μM SCN− standards, with carrier acidity of 0.5% HNO3 chosen (Figure S9). The system provided linear response (r2 = 0.9995) over the 0 to 200 μM [SCN−] range (Figure S10).
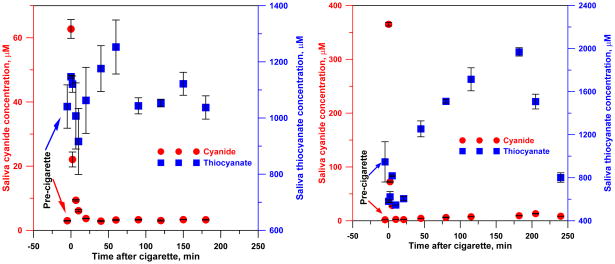
Figure 9 shows data on salivary cyanide and thiocyanate concentrations after cigarette smoking for a heavy smoker (left panel); the trend is similar to literature reports on post-smoking blood cyanide concentrations [51]. Immediately following smoking, the salivary CN− concentration rose 20-fold from a baseline value of ~3 μM, and then decayed in an approximately first order fashion (for 0–10 min, r2 = 0.92 for a first order fit) with a half-life of ~3 min. The baseline [SCN−] (1.04 mM) increased by ~0.1 mM immediately after smoking, and then decreased to 0.9 mM in 10 min before increasing monotonically to a peak of 1.25 mM at 60 min and declining to baseline values at t > 90 min. The saliva sample for the occasional smoker showed a different temporal profile. The 2 μM baseline [CN−] rose 180-fold to 365 μM immediately after smoking, comparable to ~600 μM predicted by a Henry’s law constant of 3 M atm−1 at 37 °C [15] and pHCN= 2.10 × 10⁻⁴ atm. Over the first 10 min, [CN−] decreased exponentially (linear r2 for a first order fit 0.98) with t1/2 = 1.5 min. But thereafter, [CN−] varied erratically, even after 4 h, [CN−] was 8 μM, much higher than the pre-smoking value. The baseline [SCN−] (0.95 mM) decreased upon smoking to 0.55 mM at 10 min and then monotonically increased to a peak of 1.97 mM at 3 h before starting to decline. In both subjects, [SCN−] decreased in the first 10 min after smoking and reached a peak value long after [CN−] had decreased, suggesting processes other than [CN−] conversion to [SCN−] in saliva may be involved.
Figure 9.
Saliva cyanide and thiocyanate concentrations before and after smoking a cigarette. Left: heavy smoker; right: occasional smoker. The cyanide and thiocyanate time profiles are shown for illustrative purposes. The number of subjects is insufficient to infer any statistically meaningful difference between occasional vs. heavy smokers.
6. Conclusions
Cobinamide presently provides the most sensitive means of absorbance-based measurement of cyanide. Both OH(H2O)Cbi+ and CN(H2O)Cbi+ have been used in the past as reagents and presumed respectively to form CN(H2O)Cbi+ and (CN)2Cbi. Paradoxically, the spectral absorption of OH(H2O)Cbi+ is shown here to be nearly the same as that of CN(H2O)Cbi+; formation of (CN)H2OCbi+ from OH(H2O)Cbi+ cannot therefore provide a sensitive measurement. It is shown that (CN)2Cbi is actually formed in both cases. With CN(H2O)Cbi+ as the basis of a new low reagent consumption, high-throughput analyzer, the lowest LOD to date for CN− is reported. Analyzers for HCN(g) that utilize the gas collection tube as the waveguide [52,53] will be described soon elsewhere.
Supplementary Material
Highlights.
Complete equilibrium constant data for the cyanide- water- hydroxide- cobinamide (Cbi) system
Elucidation: spectral and kinetic behavior of CN− added to OH(H2O)Cbi
Best ever reported LOD for cyanide (8 nM) with 40 sample h−1 throughput
Pattern of salivary CN− and SCN− after cigarette smoking
Acknowledgments
This work was supported in part by the CounterACT Program, Office of the Director, National Institutes of Health and the National Institute of Neurological Disorders and Stroke (NINDS), Grant No. NINDS U01 NS058030.
Footnotes
Supplementary data associated with this article can be found in the online version.
Publisher's Disclaimer: This is a PDF file of an unedited manuscript that has been accepted for publication. As a service to our customers we are providing this early version of the manuscript. The manuscript will undergo copyediting, typesetting, and review of the resulting proof before it is published in its final citable form. Please note that during the production process errors may be discovered which could affect the content, and all legal disclaimers that apply to the journal pertain.
LITERATURE CITED
- 1.Ma J, Dasgupta PK. Anal Chim Acta. 2010;673:117–125. doi: 10.1016/j.aca.2010.05.042. [DOI] [PMC free article] [PubMed] [Google Scholar]
- 2.Xu Z, Chen X, Kim HN, Yoon J. J Chem Soc Rev. 2010;39:127–137. doi: 10.1039/b907368j. [DOI] [PubMed] [Google Scholar]
- 3.Zelder FH, Männel-Croisé CM. Chimia. 2009;63:58–62. [Google Scholar]
- 4.Logue BA, Hinkends DM, Baskin SI, Rockwood GA. Crit Rev Anal Chem. 2010;40:122–147. [Google Scholar]
- 5.Pratt M, editor. Inorganic Chemistry of Vitamin B12. Academic Press; New York: 1972. [Google Scholar]
- 6.Männel-Croisé C, Zelder FH. Inorg Chem. 2009;48:1272–1274. doi: 10.1021/ic900053h. [DOI] [PubMed] [Google Scholar]
- 7.Männel-Croisé C, Probst B, Zelder FH. Anal Chem. 2009;81:9493–9498. doi: 10.1021/ac901977u. [DOI] [PubMed] [Google Scholar]
- 8.Powell SC. Anal Chem. 2009;81:9535. [Google Scholar]
- 9.Männel-Croisé C, Zelder FH. Appl Mat Interfac. 2012;81:725–729. doi: 10.1021/am201357u. [DOI] [PubMed] [Google Scholar]
- 10.Broderick KE, Singh V, Zhuang S, Kambo A, Chen JC, Sharma VS, Pilz RB, Boss GR. J Biol Chem. 2005;280:8678–8685. doi: 10.1074/jbc.M410498200. [DOI] [PubMed] [Google Scholar]
- 11.Brenner M, Mahon SB, Lee J, Kim J, Mukai D, Goodman S, Kreuter KA, Ahdout R, Mohammad O, Sharma VS, Blackledge WC, Boss GR. J Biomed Opt. 2010;15:017001–8. doi: 10.1117/1.3290816. [DOI] [PMC free article] [PubMed] [Google Scholar]
- 12.Chan A, Balasubramanian M, Blackledge W, Mohammad OM, Alvarez L, Boss GR, Bigby TD. Clin Toxicol. 2010;48:709–717. doi: 10.3109/15563650.2010.505197. [DOI] [PMC free article] [PubMed] [Google Scholar]
- 13.Hayward GC, Hill HAO, Pratt JM, Vanston NJ, Williams ARW. J Chem Soc. 1965:6485–6493. [PubMed] [Google Scholar]
- 14.Blackledge WC, Blackledge CW, Griesel A, Mahon SB, Brenner M, Pilz B, Boss GR. Anal Chem. 2010;82:4216–4221. doi: 10.1021/ac100519z. [DOI] [PMC free article] [PubMed] [Google Scholar]
- 15.Ma J, Dasgupta PK, Blackledge WC, Boss GR. Environ Sci Technol. 2010;44:3028–3034. doi: 10.1021/es1001192. [DOI] [PMC free article] [PubMed] [Google Scholar]
- 16.Ma J, Dasgupta PK, Blackledge WC, Boss GR. Anal Chem. 2010;82:6244–6250. doi: 10.1021/ac101158d. [DOI] [PMC free article] [PubMed] [Google Scholar]
- 17.Ma J, Ohira SI, Mishra SK, Puanngam M, Dasgupta PK, Mahon SB, Brenner M, Blackledge W, Boss GR. Anal Chem. 2011;83:4319–4324. doi: 10.1021/ac200768t. [DOI] [PMC free article] [PubMed] [Google Scholar]
- 18.Dasgupta PK, Genfa Z, Poruthoor SK, Caldwell S, Dong S. Anal Chem. 1998;70:4661–4669. [Google Scholar]
- 19.Toda K, Yoshioka KI, Ohira SI, Li J, Dasgupta PK. Anal Chem. 2003;73:4050–4056. doi: 10.1021/ac0341719. [DOI] [PubMed] [Google Scholar]
- 20.Li J, Li QY, Dyke JV, Dasgupta PK. Talanta. 2008;74:958–964. doi: 10.1016/j.talanta.2007.08.002. [DOI] [PubMed] [Google Scholar]
- 21.Männel-Croisé C, Meister C, Zelder FH. Inorg Chem. 2010;49:10220–10222. doi: 10.1021/ic1015115. [DOI] [PubMed] [Google Scholar]
- 22.Zhou K, Zelder FH. Eur J Inorg Chem. 2011:53–57. [Google Scholar]
- 23.Bergamin H, Zagatto FEAG, Krug FJ, Reis BF. Anal Chim Acta. 1978;101:17–23. [Google Scholar]
- 24.Reenstra WW, Jencks WP. J Am Chem Soc. 1979;101:5780–5791. [Google Scholar]
- 25.Friedrich W, Ohlms H, Sandeck W, Bieganow R. Z Naturforsch B. 1967;22:839–850. [PubMed] [Google Scholar]
- 26.Baldwin DA, Betterton EA, Pratt JM. J Chem Soc Dalton Trans. 1983:217–223. [Google Scholar]
- 27.Offenhartz BH, George P. Biochemistry. 1963;2:142–145. doi: 10.1021/bi00901a025. [DOI] [PubMed] [Google Scholar]
- 28.Chemaly SM, Brown KL, Fernandes MA, Munro OQ, Grimmer C, Marques HM. Inorg Chem. 2011;50:8700–8718. doi: 10.1021/ic200285k. [DOI] [PubMed] [Google Scholar]
- 29.Marques HM, Bradley JC, Brown KL, Brooks H. Inorg Chim Acta. 1993;209:161–169. [Google Scholar]
- 30.George P, Irvine DH, Glauser SC. Ann NY Acad Sci. 1960;88:393–415. doi: 10.1111/j.1749-6632.1960.tb20038.x. [DOI] [PubMed] [Google Scholar]
- 31.American Public Health Association. Standard Methods for the Examination of Water and Wastewater. 21. Washington, DC: 2005. Method 4500-CN− D: Titrimetric Method. [Google Scholar]
- 32.Dallas T, Dasgupta PK. Trends Anal Chem. 2004;23:385–392. [Google Scholar]
- 33.Li Q, Morris KJ, Dasgupta PK, Raimundo IM, Jr, Temkin H. Anal Chim Acta. 2003;499:151–165. [Google Scholar]
- 34.Gimbert LJ, Worsfold PJ. Trends Anal Chem. 2007;26:914–930. [Google Scholar]
- 35.Dasgupta PK, DeCesare K, Ullrey JC. Anal Chem. 1980;52:1912–1922. [Google Scholar]
- 36.Marques KL, Pires CK, Santos JLM, Zagatto EAG, Lima JLFC. Int J Environ Anal Chem. 2007;87:77–85. [Google Scholar]
- 37.Frei RW, Michel L. W Santi J Chromatogr A. 1977;142:261–270. [Google Scholar]
- 38.Waiz S, Cedillo BM, Jambunathan S, Hohnholt SG, Dasgupta PK, Wolcott DK. Anal Chim Acta. 2001;428:163–171. [Google Scholar]
- 39.Holzbecher MD, Morris MA, Ellenberger HA. Clin Toxicol. 1984;22:341–347. doi: 10.3109/15563658408992565. [DOI] [PubMed] [Google Scholar]
- 40.Jermak S, Pranaitytè B, Padarauskas A. Electrophoresis. 2006;27:4538–4544. doi: 10.1002/elps.200600295. [DOI] [PubMed] [Google Scholar]
- 41.Meng L, Liu X, Wang B, Shen G, Wang Z, Guo M. J Chromatorgr B. 2009;877:3645–3651. doi: 10.1016/j.jchromb.2009.09.006. [DOI] [PubMed] [Google Scholar]
- 42.Tsuge K, Kataoka M, Seto YJ. Health Sci. 2000;46:343–350. [Google Scholar]
- 43.Themelis DG, Tzanavaras PD. Anal Chim Acta. 2002;452:295–302. [Google Scholar]
- 44.Paul BD, Smith ML. J Anal Toxicol. 2006;30:511–515. doi: 10.1093/jat/30.8.511. [DOI] [PubMed] [Google Scholar]
- 45.Saidu Y. Afr J Biotechnol. 2004;3:370–374. [Google Scholar]
- 46.Bigourd D, Cuisset A, Hindle F, Matton S, Fertein E, Bocquet R, Mouret G. Optics Lett. 2006;31:2356–2358. doi: 10.1364/ol.31.002356. [DOI] [PubMed] [Google Scholar]
- 47.Valdés MG, Díaz-García ME. Crit Rev Anal Chem. 2004;34:9–23. [Google Scholar]
- 48.Recalde-Ruiz DL, Andrés-García E, Díaz-García ME. Anal Lett. 2000;33:1603–1614. [Google Scholar]
- 49.Lahti M, Vilpo J. J Chem Educ. 1999;76:1281–1282. [Google Scholar]
- 50.Júnior JJS, Farias MA, Silva VL, Montenegro MCBSM, Araújo AN, Lavorante AF, Paim APS. Spectrosc Lett. 2010;43:213–219. [Google Scholar]
- 51.Lundquist P, Rosling H, Sörbo B, Tibbling L. Clin Chem. 1987;33:1228–1230. [PubMed] [Google Scholar]
- 52.Dasgupta PK, Genfa Z, Poruthoor SK, Caldwell S, Dong S, Liu SY. Anal Chem. 1998;70:4661–4669. [Google Scholar]
- 53.Toda K, Yoshioka KI, Ohira SI, Li JZ, Dasgupta PK. Anal Chem. 2003;75:4050–4056. doi: 10.1021/ac0341719. [DOI] [PubMed] [Google Scholar]
Associated Data
This section collects any data citations, data availability statements, or supplementary materials included in this article.


