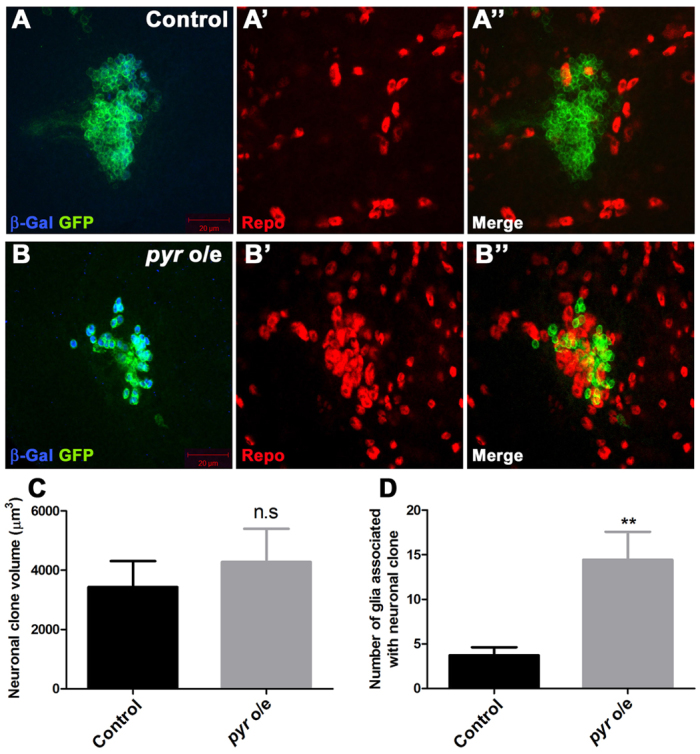
Fig. 6.

pyr overexpression in neurons induces gliogenesis. (A-B″) Control (A-A″) or pyr-overexpressing (B-B″) elav-MARCM clones stained for β-Gal (blue) and Repo (red) expression. Note the cluster of glial cells surrounding the clone in B″. (C) Quantification of neuronal clone volume for control or pyr-overexpressing neuronal clones (pyr o/e) (n=10 clones per genotype). (D) Quantification of glia associated with neuronal clones for control or pyr-overexpressing neuronal clones (pyr o/e) (n=10 clones per genotype). Error bars indicate s.e.m. **P<0.01; n.s, not significant.
