

Abstract
Genome-wide characterization of the retinal transcriptome is central to understanding development, physiology and disorders of the visual system. Massively parallel, short-read sequencing of mRNA libraries was used to generate an extensive map of the transcriptome of the adult, murine neural retina. RNA-seq data strongly corroborates prior transcriptome studies by microarray and SAGE. However, several novel features of the retinal transcriptome were discovered. For example, retinal disease genes were discovered to be among the most highly expressed in the transcriptome. We also demonstrate other interesting features of the retinal transcriptome, for example, that the retina appears to employ a very specific and restricted set of synaptic vesicle genes, and also that there is persistence of expression of a majority of “neurodevelopmental” genes into adulthood. Retina transcriptome studies utilizing novel sequencing methods have been highly informative and these data may also serve as a resource for the community of researchers.
Keywords: retina, transcriptome, RNA-seq, mouse, alternative splicing
1. Introduction
The neural retina is an excellent model for studies in neurogenetic disease [1; 2; 3; 4]. There are over 200 mapped loci for genetic eye diseases for which simple Mendelian mutations have been found in approximately 170 genes (http://www.sph.uth.tmc.edu/retnet/sum-dis.htm). Genetic mutations lead to visual impairment or blindness in most, and such patients may be characterized functionally (by visual acuity), electrophysiologically (by electroretinogram), and also morphologically through fundoscopic exam. Further still, the cell types of the neural retina are exquisitely well characterized morphologically and biochemically [5]. The approachable layered structure of the neural retina provides critical advantages for experimental studies of genetic eye disease. Finally, in a majority of situations mouse models of human neurogenetic diseases have been highly informative [6]. Thereby, the neural retina specifically offers an important opportunity to examine some of the fundamental features of neurogenetic disease.
Novel, massively-parallel, high-throughput sequencing technologies provide an opportunity for genome-wide observations of the transcriptional architecture of retina genes in a fashion which has not be been previously attainable. The transcriptome is the complete set of transcripts in a cell at a specific stage or under given physiological condition [7]. Genome-wide characterization of the retinal transcriptome is central to understanding cell development, physiology and disease [2; 8; 9]. High-throughput mRNA sequencing (RNA-Seq) allows simultaneous transcript discovery and abundance estimation [10]. Until recently, microarray platforms (hybridization-based technologies) as well as Serial Analysis of Gene Expression (SAGE) have been used, each with distinct strengths and weaknesses [8; 9; 11; 12; 13]. RNA-Seq utilizing next generation sequencing technology (NGS) has overcome many of the challenges of the previous technologies [14; 15]. NGS data have a wide dynamic range of transcript expression for quantification and identification of low abundance transcripts. Furthermore, RNA-Seq discovers all transcripts present in the library within the constraints of the depth of coverage. With microarray technologies, transcripts will only be detected based on prior knowledge as required for probe placement [16]. Also, the size of transcripts may be accurately measured by RNA-seq, as opposed to array hybridization which does not provide information on transcript size.
In this study, we have applied high-throughput RNA sequencing to all mRNAs from the murine neural retina. These data may serve as a resource for the community interested in gene expression in the neural retina. In addition, our analyses have revealed fundamental aspects of the transcriptional architecture of disease genes. We clearly demonstrate that genes that are associated with retinal disease are among the most highly expressed and largest in the transcriptome. We also present other features of interest regarding the transcriptome including that the retina appears to utilize a distinct subset of synaptic vesicle genes, and also, that there is a persistence of expression of many “neurodevelopmental” genes into adulthood. The data presented support the promise of RNA sequencing on NGS platforms for in depth study of gene expression.
2. Results
2.1. Genome-wide transcript profiling in mouse neural retina by RNA-seq
To gain a genome-wide view of gene expression in the neural retina, high-throughput RNA sequencing (RNA-seq) was performed on adult neural retina dissected free from other ocular tissue at postnatal day 21. Two distinct cDNA libraries were prepared to assure biologic replication. Each library was derived from poly(A)+ transcripts pooled within one litter of mouse pups from the CD1 line acquired from Charles River Laboratories. Each library was constructed from pooling 8 neural retinae dissected free of other ocular tissue. Libraries were sequenced on the Illumina GAIIx instrument by paired-end chemistry with results as described in Table 1. A total of 49,305,140 reads were obtained for library EMA and 50,818,317 for library EMB. Coverage plots of the five most abundant genes in addition to the transcription factor Crx are shown in Figure 1a-f. Quality scores for each lane of sequence were plotted separately and all sequence was determined to be of high quality with scores above 32 (Supplementary Figure 1). A transcriptome analysis path was adopted as shown in Figure 2. Sequenced reads were aligned to the Mus musculus (July 2007 NCBI37/mm9) using Bowtie [17]. Splice junctions were then identified using TopHat [18] and transcript abundances were calculated using Cufflinks [10] (Figure 2). Gene annotations were derived from the Aceview database (Mouse Jun07) [19]. For EMA, in total 45.2 million reads were aligned to the genome with 40 million mapping to unique locations, representing >40X sequence coverage of the 60 Mb Mus musculus transcriptome. Data for EMB were similar (Table I). Aceview represents a well established model of gene annotation for mouse and is among the most comprehensive set of gene models available. Other annotations include RefSeq, Vega, Ensembl, Gene Trap, Geneid, MGC and Genescan are available from the UCSC browser (www.genome.ucsc.edu). For purposes of completeness, we compared an analysis across these two databases. Concordance for expression levels when reads were aligned to Aceview and UCSC gene models was high and plotted with R-squared values of over 0.97 for EMA (Supplementary Figure 2a). Comparison of expression levels obtained for EMB when mapped to the alternative reference libraries showed a similar concordance of findings with R-squared values of 0.94 (data not shown).
Table 1.
RNA sequencing in murine neural retina
| Library | Read Length (bp) | Reads Produced (million) | Sequenced Bases (Mb) | Aligned Reads (millions) | Reads Uniquely (millions) | Unique Overlapping Exons (%) |
|---|---|---|---|---|---|---|
| EMA | 60 | 49.3 | 2958.3 | 45.2 | 40.0 | 83.1 |
| EMB | 60 | 50.8 | 3049.1 | 45.2 | 41.7 | 80.7 |
Fig. 1.

Coverage plots of most abundant genes (a) Rho, (b) Gnat1, (c) Sag, (d) Gnb1, (e) Gngt1 and (f) Crx
Fig. 2.
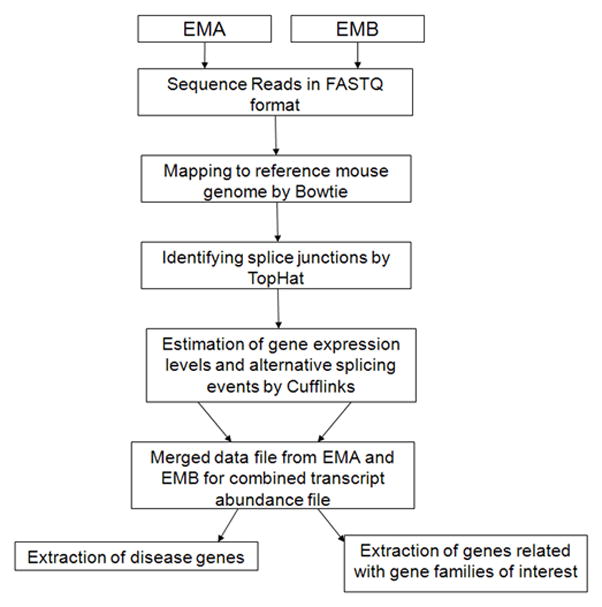
The data analysis steps in the computational pipeline to analyze RNA-Seq data from mouse retina to obtain expressed known transcripts with expression levels and number of isoforms as well as to extract disease genes.
Comparison of results of the two libraries, i.e. biologic replicates, EMA and EMB, also showed a high degree of concordance. As described, each library was sequenced to a similar depth of coverage (Table I). Utilizing the analysis path as shown (Figure 2), 29,580 transcripts were identified in EMA and 31,685 transcripts were identified in EMB. 70% of all transcripts identified were discovered in both EMA and EMB, and expression levels showed high concordance (R-squared of 0.86) across trials (Supplementary Figure 2b). Transcripts which we discovered in only one of EMA or EMB were dropped from general analyses described below. In total, 15,251 known genes and 20,558 transcripts were coordinately identified using RNA-Seq in our two libraries from mouse retina. Two or more isoforms were found in 3,655 genes. The complete list of genes with alternative splicing, transcript sizes and abundances is included in Supplementary Table 1.
2.2. Transcripts associated with disease are among the most abundant and largest in the transcriptome
Gene abundances were quantified in Fragments Per Kilobase of exon model per Million mapped fragments (FPKM) and exhibited a range between 0.125 and 2481.5 (Table 2) [10]. Based on transcripts discovered in both replicates the mean and median expression levels were 10.07 FPKM and 4.11 FPKM respectively. The twenty most abundantly expressed genes are listed in Table 3. Genes related with eye diseases were taken from Retinal Information Network (RetNet) (http://www.sph.uth.tmc.edu/retnet/sum-dis.htm) which list 159 genes in total associated with retinal disease as of 12/5/2010. Across both biologic replicates, transcripts for 114 genes associated with retinal disease were identified (127 in EMA and 132 in EMB), and many of these genes were among the most abundantly expressed. For example, the three genes with highest expression in both replicates were three retinal disease genes: rhodopsin (2481.5 +/− 232.01 FPKM) is associated with dominant retinitis pigmentosa, dominant congenital stationary and night blindness; guanine nucleotide-binding protein G(t) subunit alpha-1 (also known as the transducin alpha-1 chain) (2092.48 +/− 281.38 FPKM) is associated with dominant congenital stationary and night blindness; and retinal S-antigen (1046.75 +/−393.9 FPKM) is associated with recessive Oguchi disease and recessive retinitis pigmentosa (Table 4). Further still, while disease genes represent less than 1% of the genes in the transcriptome (114 total disease genes of 15251 genes), 30% (6 of 20) of the 20 most highly expressed genes were associated with disease (Figure 3a, 3b and Table 3). Statistical analysis indicates clearly that the expression level of disease genes is significantly higher than those of non-disease genes (Chi-Square 72.07, DF=1, p<0.0001). The gene expression scores demonstrated a profound skewness calculated as 40.79 using the univariate procedure; however, the statistically significance was strongly maintained when alternative, non-parametric test procedures were utilized which do not assume a normalized data distribution such as the Wilcoxon Rank Sums/Kruskal-Wallis (Chi-Square 72.07, DF=1, p<0.0001).
Table 2.
Summary analysis of transcript expression and splicing
| Range | Mean | Median | |
|---|---|---|---|
| Gene Expression(FPKM) | 0.125–2481.5 | 10.07 | 4.11 |
| Number of Transcripts/Gene | 1–8 | 1.35 | 1 |
Table 3.
Most highly expressed known genes from Aceview database
| Gene | Number of Isoforms | Average Expression (FPKM) |
|---|---|---|
| Rho | 1 | 2481.5 ± 164.1 |
| Gnat1 | 2 | 2092.5 ± 199 |
| Sag | 2 | 1046.7 ± 278.5 |
| Gnb1 | 2 | 625.5 ± 158.5 |
| Gngt1 | 1 | 560.7 ± 73.5 |
| Hcn1 | 1 | 546.8 ± 165.5 |
| Loc218963 | 1 | 482.8 ± 36.1 |
| Rasana | 1 | 409.9 ± 100.2 |
| Jarid2 | 4 | 386.3 ± 19 .0 |
| Yukowara | 1 | 380.1 ± 97 .0 |
| Rbp3 | 1 | 375.5 ± 13.8 |
| Pde6g | 1 | 370.4 ± 237.8 |
| Prph2 | 1 | 367.9 ± 70.8 |
| Pdc | 1 | 345.1 ± 78.9 |
| Cpe | 1 | 340 ± 6.7 |
| Seyjaw | 1 | 334.8 ± 132.8 |
| Hexb | 1 | 321.1 ± 309.9 |
| Snap25 | 3 | 320.7 ± 27.5 |
| Surera | 1 | 296.0 ± 91.6 |
| Syp | 1 | 276.0 ± 25.1 |
Table 4.
Most highly expressed known genes related with eye diseases
| Gene | Isoforms | Average Expression (FPKM) | Disease |
|---|---|---|---|
| Rho | Rho.a | 2481.5 ± 164.1 | retinitis pigmentosa, congenital stationary night blindness |
| Gnat1 | Gnat1.g | 2092.5 ± 199.0 | congenital stationary night blindness |
| Gnat1.a | 136.9 ± 136.3 | ||
| Sag | Sag.h | 1046.7 ± 278.5 | Oguchi disease, retinitis pigmentosa |
| Sag.i | 214.8 ± 36.3 | ||
| Rbp3 | Rbp3.a | 375.5 ± 13.8 | retinitis pigmentosa |
| Pde6g | Pde6g.b | 370.4 ± 237.8 | retinitis pigmentosa |
| Prph2 | Prph2.a | 367.9 ± 70.8 | retinitis pigmentosa, macular dystrophy, adult vitelliform macular dystrophy |
| Pde6a | Pde6a.a | 210.8 ± 0.8 | retinitis pigmentosa |
| Pde6a.c | 106.2 ± 27.0 | ||
| Pde6b | Pde6b.h | 169.0 ± 143.1 | retinitis pigmentosa, congenital stationary night blindness |
| Pde6b.a | 58.1 ± 2.1 | ||
| Pde6b.b | 4.8 ± 0.0 | ||
| Rdh12 | Rdh12.b | 156.1 ± 3.5 | Leber congenital amaurosis with severe childhood retinal dystrophy |
| Prom1 | Prom1.o | 143.4 ± 13.0 | macular dystrophy, bull’s-eye, retinitis pigmentosa with macular degeneration, Stargardt-like macular dystrophy, macular dystrophy, bull’s-eye, cone rod dystrophy |
| Prom1.k | 12.2 ± 3.6 | ||
| Prom1.m | 0.7 ± 0.2 | ||
| Prom1.l | 0.4 ± 0.2 |
Fig. 3.

Comparison of disease and non-disease genes expressed in EMA and EMB. (a) Expression levels in FPKM versus transcript number, (b) expression levels in FPKM versus transcript length (bp), (c) Analysis of gene expression level (FPKM) based on gene category, (c) Histogram of number of genes expressed in given GO Term category
Of the 159 disease genes identified in the RetNet database (http://www.sph.uth.tmc.edu/retnet/sum-dis.htm), 126 were identified concordantly in our RNA-seq experiments (Supplementary Table 2). Six genes were discovered only in one of the two replicates. The 33 genes which were not identified are listed in Supplementary Table 3. Of these 33 genes, 18 genes which were not identified in neural retina had cogent rationale for the absence. For example, ten of these genes are known to be expressed exclusively in retinal pigment epithelium, lens, vitreous, vascular elements or exclusively during development (i.e. are not expressed in adult neural retina). (Recall that our tissue sample was neural retina dissected free of other ocular tissue.) Several (an additional three) clearly function at a systemic level with extra-ocular gene expression, for example, complement factor H or Abcc6 which are secreted by non-neuronal cells. Finally, five of the known disease genes which were not identified were strict mitochondrial expressed genes.
We sought to identify differences between the most abundantly expressed disease genes and those which were not abundantly expressed. We performed pathway analysis on the most abundant and least abundant twenty genes using Gene Ontology Enrichment Analysis Software Toolkit (GOEAST)[20]. There were several similarities between the most highly expressed disease genes as compared to the least abundantly expressed disease genes (Supplementary Table 4 and 5 as well as Supplementary Figure 3 and 4 for most abundant and least abundant twenty disease genes, respectively). Among the common features were biological processes which included sensory perception, development of retinal structures and retinol metabolic processes. Also in common were cellular processes which involved photoreceptor outer segment, inner segment and connecting cilium. Differences included in the top group phototransduction (p<2.46e-10) which involved four of the top twenty genes, nucleotide metabolism such as cyclic-nucleotide phosphodiesterase activity (p<8.57e-8) which included three genes, and rod cell development (p<1.8e-4) although this last category only involved a single gene of the twenty. Pathways which emerged for the disease genes that were least abundantly expressed which were not shared with the top genes, included molecular mediator of immune response (p<2.29e-4) involving two genes, extracellular matrix genes (p<7.7e-4) involving three genes, and cone cell differentiation (p<2.79e-4) although this only involved a single gene.
On average, transcripts which have been implicated in disease were also larger than non-disease transcripts and had more alternative splicing events. For example, transcripts associated with disease were found to be 4,333.4 kb on average as compared to 3,323.1 kb for non-disease transcripts (Chi-Square 13.3638, DF=1, p=3e-4). Further still, we noticed that transcripts associated with disease showed a small but statistically significant increase in alternative transcripts (number of transcripts were 1.55 and 1.35 for disease and non-disease genes, respectively) (Chi-Square 7.4753, DF=1, p=6.3e-3). To address the possibility that the increased transcript size and increased transcript number were correlated with transcript expression level, we conducted correlation studies of these factors. Across the full dataset, we did not identify a correlation between transcript abundance and size (Pearson’s coefficient=0.07), nor transcript size and alternative transcripts (Pearson’s coefficient=−0.26), nor abundance and alternative transcripts (Pearson’s coefficient=−3e-3). Thereby, the increase in abundance, size and transcript number of genes associated with disease appears to be a novel and fundamental feature of disease genes in the retina transcriptome.
2.3. Cell-type specific gene expression by comparison to transcriptome studies from previous methods
With regard to cell-type specific gene expression, we compared our dataset to previously published transcriptome studies. For example, 43 genes had previously been identified by SAGE to be rod-enriched[8]. We identified 42 of these previously identified genes in our dataset. The average transcript level for these genes is 227.0 FPKM with the range from 1.3 to 2481.5 FPKM (Supplementary Table 6). With regard to bipolar cells, we identified 71/73 previously identified genes [21]. The average transcript level for these bipolar genes is 21.5 FPKM with the range from 0.3 to 125.2 FPKM. For amacrine cells, 86/88 previously identified genes were found to be expressed in our dataset [21]. The average amacrine cell transcript level for these genes was 33.3 FPKM, with a range from 0.3 to 432.0 FPKM. For ganglion cells, we identified expression in 47/49 of the ganglion cell enriched genes previously reported [22], and the range of gene expression was from 0.2 to 126.9 FPKM with an average expression level of 24.4 FPKM. For Muller cells, gene expression was noted in 69/70 genes noted to have highest Muller expression [23]. Average gene expression in Mullers was 39.0 FPKM and ranged from 0.5 to 226.5 FPKM. Failure to find the very small minority of genes described is attributed to nomenclature discrepancies, i.e gene names that were not identified in AceView and could not be otherwise identified. In the case of three genes only (Hmgcs1 and Hub1 in ganglion cells and Prss2 in Mullers), genes noted to be expressed in previous studies were found not to be expressed in our mouse dataset. For the ganglion cell genes, this might reflect species differences. Of interest, some genes which may be predicted to have very low gene expression were discovered in our dataset. For example, Opsin4 (melanopsin) is only expressed in a small fraction (1%) of all ganglion cells (which represent a small fraction of retinal cells) is detected in both of our trials at levels of 1.3 and 1.4 FPKM. Finally, to verify that there was not an overabundance of contamination from retinal pigment epithelium, seven signature RPE genes were found to have no expression or very little expression (0.4 FPKM in only one trial). Our data are therefore consistent with very little contamination from RPE.
2.4 Alternative splicing observed in 24 % of genes
We assessed the extent of alternative splicing and identified 3,655 genes with more than two identical isoforms expressed in both replicates. The number of alternative transcripts per gene was observed to be between 1 and 8. Using conservative measures (the requirement that the isoform be identified in both replicates), we identified alternative splicing in 24% of genes. The average abundance of the most highly expressed transcript for genes with multiple isoforms was 12 FPKM. As indicated, we did not discover a correlation of number of isoforms with transcript abundance or size. Genes with the greatest number of transcripts are shown in Table 5. For example, Abca8a has 8 isoforms in both replicates and the expression of isoforms ranges between 18.4 and 41.9 FPKM.
Table 5.
Genes with greatest number of alternative transcripts
| Gene | Number of Isoforms | Isoforms | Average Expression Level (FPKM) |
|---|---|---|---|
| Abca8a | 8 | Abca8a.a | 42.0 ± 0.5 |
| Abca8a.f | 37.3 ± 0.9 | ||
| Abca8a.e | 35.9 ± 3.9 | ||
| Abca8a.b | 30.2 ± 1.9 | ||
| Abca8a.g | 28.8 ± 0.1 | ||
| Abca8a.d | 22.4 ± 0.6 | ||
| Abca8a.h-unspliced | 19.1 ± 0.7 | ||
| Abca8a.c | 18.4 ± 3.4 | ||
| Med15 | 7 | Med15.o | 104.9 ± 11.8 |
| Med15.d | 21.5 ± 0.4 | ||
| Med15.a | 11.0 ± 10.1 | ||
| Med15.n | 7.8 ± 0.0 | ||
| Med15.s | 3.4 ± 0.1 | ||
| Med15.u | 2.5 ± 0.1 | ||
| Med15.i | 0.8 ± 0.0 | ||
| Atp1a1 | 7 | Atp1a1.a | 49.9 ± 1.2 |
| Atp1a1.i-unspliced | 42.4 ± 1.3 | ||
| Atp1a1.b | 39.2 ± 0.9 | ||
| Atp1a1.f | 37.4 ± 11.9 | ||
| Atp1a1.j-unspliced | 34.4 ± 0.3 | ||
| Atp1a1.h-unspliced | 25.8 ± 4.1 | ||
| Atp1a1.e-unspliced | 14.5 ± 4.6 | ||
| Wdr1 | 7 | Wdr1.g | 35.3 ± 0.5 |
| Wdr1.a | 33.9 ± 2.5 | ||
| Wdr1.h | 24.4 ± 0.8 | ||
| Wdr1.k | 17.3 ± 1.1 | ||
| Wdr1.i | 15.8 ± 3.4 | ||
| Wdr1.j | 15.0 ± 2.5 | ||
| Wdr1.l | 9.4 ± 3.7 | ||
| Anapc1 | 7 | Anapc1.a | 22.3 ± 0.3 |
| Anapc1.f | 19.0 ± 1.6 | ||
| Anapc1.j | 14.7 ± 0.0 | ||
| Anapc1.k | 12.2 ± 4.5 | ||
| Anapc1.l | 6.8 ± 4.6 | ||
| Anapc1.b | 5.7 ± 2.1 | ||
| Anapc1.e | 2.6 ± 0.5 |
In order to compare our alternative transcript results with the prior published results, we curated all data from a Pubmed search on alternative splicing of retina genes as described in Methods section. This search on January 14, 2011 returned 144 references. The studies of alternative splicing in the literature were performed in a variety of tissues (ie including for example retinal pigmented epithelium), species and developmental stages. In situations wherein the tissue, species, or developmental stages were similar, the number of transcripts discovered in our study generally agreed or exceeded published reports (Supplementary Table 7). For example, Crx, Six3 and Nrxn2 were found in our study to have the same number of transcripts as has been determined previously in the literature. For other genes with similar experimental conditions, our study identified more isoforms (concordantly in both biologic replicates), for example, the RNA-seq experiments identified four transcripts for Rpgrip1 while a prior report identified only 2 transcripts [24]. Similarly, for Cabp1, RNA-seq identified five transcripts while two were previously documented in the literature [25]. The complete list of transcripts discovered (including those discovered in both EMA and EMB) is found in Supplementary Table 8, 9 and 10. We validated a test set of approximately thirty transcripts by PCR using exons specific primers. In a majority of transcripts (greater than 85%), the alternative transcripts were identified by PCR (data not shown). For example, in the case of gene Rpgrip1 and Cabp1, wherein transcript numbers exceeded previously reported, all transcripts tested were validated (three of three for Rpgrip1 and four of four tested for Cabp1) which confirms these new predictions of transcripts in excess of prior reports. Similarly, for gene Atp1a1, which was one of the most alternatively spliced genes, seven of seven transcripts tested were validated by PCR testing.
2.5. Retina uses a distinct subset of synaptic vesicle genes
Genome-wide analysis of transcription using RNA-seq also revealed several novel features of the retinal transcriptome. We studied genes in several gene ontology (GO) groups such as axonogenesis, neuron development, neurite morphology, neurotransmitter secretion, synaptic vesicles, synapse part and voltage-gated channel activity. The representation of transcripts within these GO categories is shown in Figures 3c and 3d. Interestingly, despite the derivation of the transcriptome from adult tissue 42 out of 68 neuron development genes (greater than 60%) were expressed in both samples. Expression level of those genes ranges between 0.5 and 123 FPKM (Supplementary Table 11). Average expression level of neuron development genes is 18 FPKM. Also 195 genes of 285 neurite morphology genes (greater than 65%) are expressed adult in both samples and the average expression level is 14.9 FPKM (Supplementary Table 12). Due to the fundamental role of voltage-gated ion channels in neuronal physiology, genes related with this family are expected to be highly expressed in retina (Supplementary Table 13). A surprisingly large percentage of these genes, 124 of 179 genes (nearly 70%) defined to be in this family, were expressed in both of replicates and at high levels. The most abundant gene in this family and among all gene families chosen for our study is Hcn1, Potassium/sodium hyperpolarization-activated cyclic nucleotide-gated channel 1 gene and the average expression level for voltage-gated ion channels was 16.7 FPKM. Synaptic vesicles have critical roles in neurotransmission in a neuron. It was unanticipated that only 81 out of 265 genes (approximately 30%) related with synaptic vesicles were discovered. In spite of the low number of genes expressed in this family, the average of expression level is quite high (28.4 FPKM) (Supplementary Table 14). This result supports a very interesting model: the retina utilizes a relatively specific and restricted subset of synaptic vesicle genes.
3. Discussion
We have generated a comprehensive map of retina transcriptome in mouse using high throughput, paired-end RNA-seq. We are making these data publically available and anticipate this could be a highly accessed resource for researchers interested in gene expression in the neural retina. There have been several transcriptome studies in retina, all were done by using previous technologies such as microarray and serial analysis of gene expression (SAGE) [8; 9]. Dorrell et al. reported 2635 known genes in a microarray study on developing mouse retina [26]. In this study, postnatal mouse retina development was studied including the postnatal day 21 which is the same sampling day as our study. Using SAGE, Blackshaw et al. reported gene expression during retinal development, but focused on genes expressed by mammalian rods [8]. A microarray study done by Livesey et al. focused on transcriptional network controlled by Crx using cDNA microarray [27]. Zhang et al. also used cDNA microarray to study the mouse retinal development from embryonic day 12.5 to postnatal day 21 [28]. In the present study, we used RNA-seq to accurately identify transcript abundances (with a broad dynamic range) and size and alternative splicing information in mouse retina at postnatal day 21. Our study has revealed several novel features of the retina transcriptome, including in particular the architecture of known retinal disease genes. We identified 15251 known genes expressed concordantly with precise alternative splicing information and 3655 of those were found to have more than 2 isoforms.
The neural retina has a large number of known disease genes which act in a simple Mendelian fashion (greater than 150 genes) which lead to visual impairment and blindness (http://www.sph.uth.tmc.edu/retnet/sum-dis.htm). Few other tissues have such a well-characterized and highly specific signature of disease genes. These attributes of the neural retina make this tissue an excellent model to study the transcriptional architecture of neurogenetic disease by genome-wide RNA-seq. Here we have discovered a number of features of the transcriptional architecture of disease genes including disease genes which are among the most abundantly expressed, and are generally larger with more alternative transcripts than non-disease genes. It is possible that the high level of expression of disease genes may be a feature of the retina, but we propose that these attributes may alternatively be fundamental properties of disease genes. One possible interpretation with regard to abundance may be that disease genes are commonly expressed in rod photoreceptors and these cells are among the most abundant cell types in the murine neural retina, representing greater than 70% of cells (Lavail 1980; Morrow 1998). While this observation may explain part of the high abundance of disease genes, the increase in alternative splicing and the larger size of disease-related genes seem likely independent characteristics of the disease gene transcriptional architecture. More work will be necessary in other neural tissues to examine this result in greater detail.
Our data provide interesting findings on alternative splicing in mouse retina. Alternative splicing occurs in 3,655 genes (24%) of the genes identified in both libraries with a large number of genes demonstrating over two transcripts. Our findings are highly consistent with prior estimates of alternatively splicing in human retina where alternative splicing has been estimated to be in 26% of retina genes in a study based on expressed sequence tags (ESTs) [29]. Alternative splicing events in our study showed high concordance in terms of gene abundances (R2=0.85, data not shown) yet we anticipate that our results may represent an underestimate of alternative splicing given our strict criteria for identifying transcripts in our biologic replicates. However, we have provided the full analysis of the conservative list of transcripts (discovered in all replicates) and also all transcripts from individual replicates in Supplementary data.
Finally, genome-wide profiling of retinal transcriptome has revealed other interesting features of retina biology. For example, we noted that of all the synaptic vesicle genes in the genome, only 30% of such genes are expressed in the retina; that is, the retina uses a very specific signature of synaptic vesicle genes. Further work in different neural tissues will likely elucidate distinct signatures which may suggest specific physiologic properties of neurons in different neuronal circuits. In addition, the observation that neuronal development genes show persistent expression in adult tissues is also compelling. This argues that a majority of such genes may have various functions including in neuronal development and potentially in the maintenance of neuronal health.
In summary, this study presents the most comprehensive view of the transcriptome of the murine neural retina to date using novel, massively-parallel sequencing technologies. Our analysis uses the state-of-the-art tools for calculations of transcript abundance, size and alternative splicing. These data are provided as a resource for the community of researchers studying gene expression in retina.
4. Material and Methods
4.1 Sample Collection, Library Preparation and Sequencing
The neural retina was dissected free of any ocular tissue from 21 day old CD1 mice which were purchased from Charles River Laboratories. Poly (A)+ transcripts were isolated by following the manufacturer’s instructions (mirVana™ miRNA Isolation Kit, Ambion®) from dissected retina. EMA and EMB libraries were constructed from duplicate samples based on established protocols by Illumina (mRNA Sequencing Sample Preparation Guide Cat # RS-930-1001). Isolated cDNA libraries were sequenced by paired-end chemistry via Illumina Genome Analyzer IIx. On average 50 million of 60 bp reads were obtained from each library.
4.2 Data Analysis
Sequencing reads in FASTQ format were mapped to build 37.1 of the mouse genome as well as splice junctions were identified using Bowtie version 0.12.5.0 [17] and TopHat version 1.1.0 [18]. Average library size and read length were 280 bp and 60 bp paired-end reads, respectively. Transcript abundances were estimated by using Cufflinks in Fragments per kilobase of transcript per million fragments sequenced (FPKM) [10]. All transcripts identified by Cufflinks version 0.9.1 were matched to the gene annotations taken from Aceview database [19] by Cuffcompare which is a part of Cufflinks. Parameters used to run TopHat and Cufflinks are shown in Supplementary Table 18. The program pipeline used for the data analysis is shown in Figure 2. Output of this pipeline contains files with gene annotations, transcripts, abundances and loci of all transcripts. By using custom-made scripts, these files were further analyzed to extract eye disease genes as well as gene families of interest.
FastQC (http://www.bioinformatics.bbsrc.ac.uk/projects/fastqc/) was used to check the quality of raw sequence data. Each lane (EMA s_5, EMA s_6, EMB s_7 and EMB s_8) was analyzed with FastQC and results were shown in Supplementary Figure 1a–d. According to FastQC quality scores, raw sequencing reads of our samples are high quality.
Coverage plots were prepared by using Bedtools program (http://code.google.com/p/bedtools/). Firstly, the “accepted_hits.bam” file which was generated by TopHat was converted into a BEDgraph file by Bedtools program. BEDgraph file was converted into BigWig file which was used for visualization on UCSC browser (http://genome.ucsc.edu/cgi-bin/hgGateway).
4.3 Curation of Alternative Splicing Genes
Pubmed search was performed to search for genes with alternative splicing isoforms between 1/14/2010 and 1/17/2010. Keywords such as “alternative splicing of retina genes, alternative splicing isoforms in retina” were entered to Pubmed and the abstracts of first 100 results were read. If the corresponding gene in the abstract was expressed in our samples and the abstract indicated experimental findings on alternative splicing isoforms, other sections of the article were examined. Alternative transcripts with solid experimental support were included in Supplementary Table 7.
4.4 Statistics
Correlation between transcript abundance, size and alternative transcripts was calculated by Pearson’s correlation on Excel. For the comparison of disease and non-disease genes in terms of expression level, number of alternative transcripts and transcript length, NPAR1WAY procedure in SAS was used.
Supplementary Material
Supplementary Fig. 1. Quality scores obtained for all bases position by FastQC. Sequencing lanes (a) EMA s_5, (b) EMA s_6, (c) EMB s_7 and (d) EMB s_8
Supplementary Fig. 2. Concordance of expression. (a) Data was mapped to distinct references, UCSC versus Aceview in FPKM for EMA (R2=0.97) and (b) Biologic replicates.
Supplementary Fig. 3. GOEAST pathway analysis results of most highly abundant 20 disease genes for (a) biological processes, (b) cellular components and (c) molecular function Supplementary Fig. 4. GOEAST pathway analysis results of least abundant 20 disease genes for (a) biological processes, (b) cellular components and (c) molecular function
Highlights.
Using RNA-seq, we have generated an extensive map of the transcriptome of the adult, murine neural retina.
15,251 genes were found to be expressed with greater than 3,655 alternatively spliced genes.
New insights into architecture of disease genes.
Gene expression of developmental genes persists into adulthood.
Retina uses a specific and restricted subset of synaptic vesicle genes.
Acknowledgments
EMM holds a Career Award for Medical Scientists from the Burroughs Wellcome Fund. DEG has been supported by a postdoctoral fellowship award from the Center for Vision Research at Brown University. The authors would like to thank Robert Stout PhD for advice with statistical analysis, Lingsheng Dong MD for assistance with bioinformatics, and members of the Morrow lab for helpful discussion. We are grateful to David Berson PhD, Anita Zimmerman PhD, and Connie Cepko PhD for providing feedback on the manuscript. Aspects of this work were presented in a poster at the Annual Association for Research in Vision and Ophthalmology (ARVO) 2011 meeting on May 3, 2011 in Fort Lauderdale.
Footnotes
Publisher's Disclaimer: This is a PDF file of an unedited manuscript that has been accepted for publication. As a service to our customers we are providing this early version of the manuscript. The manuscript will undergo copyediting, typesetting, and review of the resulting proof before it is published in its final citable form. Please note that during the production process errors may be discovered which could affect the content, and all legal disclaimers that apply to the journal pertain.
References
- 1.Cepko CL. Genomics approaches to photoreceptor development and disease. Harvey Lect. 2001;97:85–110. [PubMed] [Google Scholar]
- 2.Swaroop A, Zack DJ. Transcriptome analysis of the retina. Genome Biology. 2002;3:REVIEWS1022. doi: 10.1186/gb-2002-3-8-reviews1022. [DOI] [PMC free article] [PubMed] [Google Scholar]
- 3.Montana CL, Corbo JC. Inherited diseases of photoreceptors and prospects for gene therapy. Pharmacogenomics. 2008;9:335–47. doi: 10.2217/14622416.9.3.335. [DOI] [PubMed] [Google Scholar]
- 4.Bramall AN, Wright AF, Jacobson SG, McInnes RR. The genomic, biochemical, and cellular responses of the retina in inherited photoreceptor degenerations and prospects for the treatment of these disorders. Annu Rev Neurosci. 2010;33:441–72. doi: 10.1146/annurev-neuro-060909-153227. [DOI] [PubMed] [Google Scholar]
- 5.Masland RH. Neuronal cell types. Curr Biol. 2004;14:R497–500. doi: 10.1016/j.cub.2004.06.035. [DOI] [PubMed] [Google Scholar]
- 6.Fletcher EL, Jobling AI, Vessey KA, Luu C, Guymer RH, Baird PN. Animal models of retinal disease. Prog Mol Biol Transl Sci. 2011;100:211–86. doi: 10.1016/B978-0-12-384878-9.00006-6. [DOI] [PubMed] [Google Scholar]
- 7.Wang Z, Gerstein M, Snyder M. RNA-Seq: a revolutionary tool for transcriptomics. Nature Reviews Genetics. 2009;10:57–63. doi: 10.1038/nrg2484. [DOI] [PMC free article] [PubMed] [Google Scholar]
- 8.Blackshaw S, Fraioli RE, Furukawa T, Cepko CL. Comprehensive analysis of photoreceptor gene expression and the identification of candidate retinal disease genes. Cell. 2001;107:579–589. doi: 10.1016/s0092-8674(01)00574-8. [DOI] [PubMed] [Google Scholar]
- 9.Hackam AS, Qian J, Liu DM, Gunatilaka T, Farkas RH, Chowers I, Kageyama M, Parmigiani G, Zack DJ. Comparative gene expression analysis of murine retina and brain. Molecular Vision. 2004;10:637–649. [PubMed] [Google Scholar]
- 10.Trapnell C, Williams BA, Pertea G, Mortazavi A, Kwan G, van Baren MJ, Salzberg SL, Wold BJ, Pachter L. Transcript assembly and quantification by RNA-Seq reveals unannotated transcripts and isoform switching during cell differentiation. Nature Biotechnology. 2010;28:511–U174. doi: 10.1038/nbt.1621. [DOI] [PMC free article] [PubMed] [Google Scholar]
- 11.Sharon D, Blackshaw S, Cepko CL, Dryja TP. Profile of the genes expressed in the human peripheral retina, macula, and retinal pigment epithelium determined through serial analysis of gene expression (SAGE) Proceedings of the National Academy of Sciences of the United States of America. 2002;99:315–320. doi: 10.1073/pnas.012582799. [DOI] [PMC free article] [PubMed] [Google Scholar]
- 12.Chowers I, Gunatilaka TL, Farkas RH, Qian J, Hackam AS, Duh E, Kageyama M, Wang CW, Vora A, Campochiaro PA, Zack DJ. Identification of novel genes preferentially expressed in the retina using a custom human retina cDNA microarray. Investigative Ophthalmology & Visual Science. 2003;44:3732–3741. doi: 10.1167/iovs.02-1080. [DOI] [PubMed] [Google Scholar]
- 13.Lamba DA, Reh TA. Microarray Characterization of Human Embryonic Stem Cell-Derived Retinal Cultures. Invest Ophthalmol Vis Sci. 2011 doi: 10.1167/iovs.10-6504. [DOI] [PMC free article] [PubMed] [Google Scholar]
- 14.Costa V, Angelini C, De Feis I, Ciccodicola A. Uncovering the Complexity of Transcriptomes with RNA-Seq. Journal of Biomedicine and Biotechnology. 2010 doi: 10.1155/2010/853916. [DOI] [PMC free article] [PubMed] [Google Scholar]
- 15.Mortazavi A, Williams BA, Mccue K, Schaeffer L, Wold B. Mapping and quantifying mammalian transcriptomes by RNA-Seq. Nature Methods. 2008;5:621–628. doi: 10.1038/nmeth.1226. [DOI] [PubMed] [Google Scholar]
- 16.Ozsolak F, Milos PM. RNA sequencing: advances, challenges and opportunities. Nature Reviews Genetics. 2011;12:87–98. doi: 10.1038/nrg2934. [DOI] [PMC free article] [PubMed] [Google Scholar]
- 17.Langmead B, Trapnell C, Pop M, Salzberg SL. Ultrafast and memory-efficient alignment of short DNA sequences to the human genome. Genome Biology. 2009;10 doi: 10.1186/gb-2009-10-3-r25. [DOI] [PMC free article] [PubMed] [Google Scholar]
- 18.Trapnell C, Pachter L, Salzberg SL. TopHat: discovering splice junctions with RNA-Seq. Bioinformatics. 2009;25:1105–1111. doi: 10.1093/bioinformatics/btp120. [DOI] [PMC free article] [PubMed] [Google Scholar]
- 19.Thierry-Mieg D, Thierry-Mieg J. AceView: a comprehensive cDNA-supported gene and transcripts annotation. Genome Biol. 2006;7(Suppl 1):S12, 1–14. doi: 10.1186/gb-2006-7-s1-s12. [DOI] [PMC free article] [PubMed] [Google Scholar]
- 20.Zheng Q, Wang XJ. GOEAST: a web-based software toolkit for Gene Ontology enrichment analysis. Nucleic Acids Research. 2008;36:W358–W363. doi: 10.1093/nar/gkn276. [DOI] [PMC free article] [PubMed] [Google Scholar]
- 21.Blackshaw S, Harpavat S, Trimarchi J, Cai L, Huang HY, Kuo WP, Weber G, Lee K, Fraioli RE, Cho SH, Yung R, Asch E, Ohno-Machado L, Wong WH, Cepko CL. Genomic analysis of mouse retinal development. Plos Biology. 2004;2:1411–1431. doi: 10.1371/journal.pbio.0020247. [DOI] [PMC free article] [PubMed] [Google Scholar]
- 22.Ivanov D, Dvoriantchikova G, Nathanson L, McKinnon SJ, SVI Microarray analysis of gene expression in adult retinal ganglion cells. Febs Letters. 2006;580:331–335. doi: 10.1016/j.febslet.2005.12.017. [DOI] [PubMed] [Google Scholar]
- 23.Roesch K, Jadhav AP, Trimarchi JM, Stadler MB, Roska B, Sun BB, Cepko CL. The transcriptome of retinal miller glial cells. Journal of Comparative Neurology. 2008;509:225–238. doi: 10.1002/cne.21730. [DOI] [PMC free article] [PubMed] [Google Scholar]
- 24.Lu X, Ferreira PA. Identification of novel murine- and human-specific RPGRIP1 splice variants with distinct expression profiles and subcellular localization. Invest Ophthalmol Vis Sci. 2005;46:1882–90. doi: 10.1167/iovs.04-1286. [DOI] [PMC free article] [PubMed] [Google Scholar]
- 25.Haeseleer F, Sokal I, Verlinde CL, Erdjument-Bromage H, Tempst P, Pronin AN, Benovic JL, Fariss RN, Palczewski K. Five members of a novel Ca(2+)-binding protein (CABP) subfamily with similarity to calmodulin. J Biol Chem. 2000;275:1247–60. doi: 10.1074/jbc.275.2.1247. [DOI] [PMC free article] [PubMed] [Google Scholar]
- 26.Dorrell MI, Aguilar E, Weber C, Friedlander M. Global gene expression analysis of the developing postnatal mouse retina. Investigative Ophthalmology & Visual Science. 2004;45:1009–1019. doi: 10.1167/iovs.03-0806. [DOI] [PubMed] [Google Scholar]
- 27.Livesey FJ, Furukawa T, Steffen MA, Church GM, Cepko CL. Microarray analysis of the transcriptional network controlled by the photoreceptor homeobox gene Crx. Current Biology. 2000;10:301–310. doi: 10.1016/s0960-9822(00)00379-1. [DOI] [PubMed] [Google Scholar]
- 28.Zhang SS, Xu X, Liu MG, Zhao H, Soares MB, Barnstable CJ, Fu XY. A biphasic pattern of gene expression during mouse retina development. BMC Dev Biol. 2006;6:48. doi: 10.1186/1471-213X-6-48. [DOI] [PMC free article] [PubMed] [Google Scholar]
- 29.Yeo G, Holste D, Kreiman G, Burge CB. Variation in alternative splicing across human tissues. Genome Biology. 2004;5 doi: 10.1186/gb-2004-5-10-r74. [DOI] [PMC free article] [PubMed] [Google Scholar]
Associated Data
This section collects any data citations, data availability statements, or supplementary materials included in this article.
Supplementary Materials
Supplementary Fig. 1. Quality scores obtained for all bases position by FastQC. Sequencing lanes (a) EMA s_5, (b) EMA s_6, (c) EMB s_7 and (d) EMB s_8
Supplementary Fig. 2. Concordance of expression. (a) Data was mapped to distinct references, UCSC versus Aceview in FPKM for EMA (R2=0.97) and (b) Biologic replicates.
Supplementary Fig. 3. GOEAST pathway analysis results of most highly abundant 20 disease genes for (a) biological processes, (b) cellular components and (c) molecular function Supplementary Fig. 4. GOEAST pathway analysis results of least abundant 20 disease genes for (a) biological processes, (b) cellular components and (c) molecular function