Abstract
Signalling through the IGF1R [type 1 IGF (insulin-like growth factor) receptor] and canonical Wnt signalling are two signalling pathways that play critical roles in regulating neural cell generation and growth. To determine whether the signalling through the IGF1R can interact with the canonical Wnt signalling pathway in neural cells in vivo, we studied mutant mice with altered IGF signalling. We found that in mice with blunted IGF1R expression specifically in nestin-expressing neural cells (IGF1RNestin−KO mice) the abundance of neural β-catenin was significantly reduced. Blunting IGF1R expression also markedly decreased: (i) the activity of a LacZ (β-galactosidase) reporter transgene that responds to Wnt nuclear signalling (LacZTCF reporter transgene) and (ii) the number of proliferating neural precursors. In contrast, overexpressing IGF-I (insulin-like growth factor I) in brain markedly increased the activity of the LacZTCF reporter transgene. Consistently, IGF-I treatment also markedly increased the activity of the LacZTCF reporter transgene in embryonic neuron cultures that are derived from LacZTCF Tg (transgenic) mice. Importantly, increasing the abundance of β-catenin in IGF1RNestin−KO embryonic brains by suppressing the activity of GSK3β (glycogen synthase kinase-3β) significantly alleviated the phenotypic changes induced by IGF1R deficiency. These phenotypic changes includes: (i) retarded brain growth, (ii) reduced precursor proliferation and (iii) decreased neuronal number. Our current data, consistent with our previous study of cultured oligodendrocytes, strongly support the concept that IGF signalling interacts with canonical Wnt signalling in the developing brain to promote neural proliferation. The interaction of IGF and canonical Wnt signalling plays an important role in normal brain development by promoting neural precursor proliferation.
Keywords: β-catenin, central nervous system (CNS), insulin-like growth factor (IGF), type 1 IGF receptor (IGF1R), signalling, Wnt
Abbreviations: CA, cornu ammonis; CNS, central nervous system; DAPI, 4′,6-diamidino-2-phenylindole; DG, dentate gyrus; DMEM, Dulbecco's modified Eagle's medium; E, embryonic day; Erk, extracellular-signal-regulated kinase; GSK3β, glycogen synthase kinase-3β; HIP, hippocampus; IGF, insulin-like growth factor; IGF1R, type 1 IGF receptor; KO, knockout; LacZ, β-galactosidase; P, postnatal day; pAkt, phosphorylated Akt; PCL, pyramidal cell layer; PFA, paraformaldehyde; PI3K, phosphoinositide 3-kinase; pH3Ser10, phosphorylated histone H3 at Ser10; qRT-PCR, quantitative real-time-PCR; TCF, T-cell factor; Tg, transgenic; VZ, ventricular zone
INTRODUCTION
The growth and development of both neural stem cells and lineage-restricted neural progenitors in the CNS (central nervous system) is controlled and specified by multiple neural signals and their interactions. During the past two decades, accumulating experimental data have convincingly established an essential role for IGF (insulin-like growth factor) signalling in the normal development and growth of neural cells. IGF-I and IGF-II, two ligands of the IGF system that act predominantly, if not exclusively, by interacting with the IGF1R (type 1 IGF receptor) (Liu et al., 1993; Efstratiadis, 1998), promote the proliferation, survival and maturation of cultured neural cells (see reviews: D'Ercole et al., 1996; Popken et al., 2005). Many of these results have been confirmed in mutant mice. Overexpressing IGF-I in the brain of Tg (transgenic) mice increases neural proliferation (Ye et al., 1995; Ye et al., 1996; Hodge et al., 2004; Popken et al., 2004), promotes neuronal growth (Gutierrez-Ospina et al., 1996; Dentremont et al., 1999) and myelination (Carson et al., 1993; Ye et al., 1995), and reduces neural cell apoptosis (Ye et al., 1996; Chrysis et al., 2001). In contrast, blunting the expression of IGF-I (Beck et al., 1995; Ye et al., 2002) or the IGF1R in specific neural cells (Zeger et al., 2007; Kappeler et al., 2008; Liu et al., 2009b; Lehtinen et al., 2011), or reducing the availability of IGF-I in brain (Ye et al., 1995; Ni et al., 1997) significantly retards brain growth by decreasing the proliferation of neural precursors and the survival of neurons and oligodendrocytes. These data convincingly show that signalling through the IGF1R is essential to the normal development of the CNS. The precise intracellular signalling pathway(s) that mediates each of these IGF actions and IGF interactions with other neural signalling, however, remain to be defined.
Canonical Wnt signalling, mediated through β-catenin (Aberle et al., 1997; Salic et al., 2000; Amit et al., 2002; Liu et al., 2002; Schwarz-Romond et al., 2002), also plays a critical role in neural development and growth. For example, Tg mice overexpressing β-catenin exhibit brain overgrowth with a greater proportion of neural precursors re-entering the cell cycle (Chenn and Walsh, 2002, 2003). Similarly, when β-catenin expression is increased in the SVZ (subventricular zone) of adult mice, the proliferation of neural precursors is increased (Adachi et al., 2007). In contrast, blunting the expression of β-catenin or Wnt3, an extracellular Wnt ligand, leads to a marked retardation of brain growth (Machon et al., 2003; Schuller and Rowitch, 2007), resulting from a decrease in neural proliferation (Machon et al., 2003; Adachi et al., 2007) and an increase in apoptosis of neural precursors (Junghans et al., 2005).
While the role of IGF and canonical Wnt signalling pathways in neurogenesis has been independently studied extensively, the interactions of the two important signalling pathways, as well as the functions of their interactions, during development remain largely unclear. Recently, our studies of oligodendroglial cultures suggest that β-catenin acts as a signalling molecule downstream of the IGF-I-PI3K (phosphoinositide 3-kinase)-Akt pathway, partially mediating IGF proliferative and survival signalling (Ye et al., 2010). To further determine whether this new IGF signalling pathway also exists in neural cells during normal in vivo development, and if so, what role it plays in neurogenesis, we studied mutant mice with ablated IGF1R specifically in nestin-expressing neural cells (IGF1RNestin−KO mice). As almost all IGF1RNestin−KO mice die within 48 h after birth (Liu et al., 2009b), our study focused on prenatal development. In this report, we provide evidence that IGF signalling interacts with canonical Wnt signalling, at least at the level of β-catenin, to promote neural cell proliferation during normal brain development. Our data also strongly suggest that a portion of IGF-I and Wnt signalling converges by regulating the phosphorylation and activity of GSK3β (glycogen synthase kinase-3β) and the abundance of β-catenin.
MATERIALS AND METHODS
Mutant mice
Generation and characterization of IGF1RNestin−KO mice have been described previously (Liu et al., 2009b). Mutant mice carrying a LacZ (β-galactosidase) reporter transgene that is under the control of a promoter containing multiple copies of consensus TCF (T-cell factor)-binding motifs (LacZTCF Tg mice, Maretto et al., 2003) were obtained from the Jackson Laboratory.
To suppress GSK3β activity in embryonic brains, pregnant dams bearing E11.5 IGF1RNestin−KO embryos were treated with LiCl at a concentration of 0.24% for 5–7 days as a supplement in drinking water (Wang et al., 2001; Willing et al., 2002). This concentration has been shown to be well below the level of toxicity for fetuses (Szabo, 1970). Sucrose (5%) was added to improve taste, and NaCl (0.9%) was added to maintain sodium balance and correct diuresis that may be caused by lithium (Leeman et al., 2007; Grunfeld and Rossier, 2009). IGF1RNestin−KO and control mice, given the same amount of sucrose and NaCl, served as treatment controls. No obvious abnormalities in gross brain morphology were observed in mice receiving LiCl. Some pregnant dams bearing E11.5 IGF1RNestin−KO embryos were treated with the GSK3β inhibitor AR-A014418 (EMD Millipore). AR-A014418 was administered by oral gavage at 30 μmol/kg, twice daily for 6 days, as previously reported (Noble et al., 2005). AR-A014418 was reconstituted in a modified solution (Noble et al., 2005) that contains 40% poly(ethylene glycol) 400 and PBS, and dimethylamine was omitted from the original recipe because of its high toxicity in vivo. All procedures used were consistent with the guidelines of National Institutes of Health and approved by the institutional review committees of the University of North Carolina at Chapel Hill.
LacZ histochemistry
Brains were fresh-frozen in liquid N2, and coronally sectioned (18–20 μm in thickness) on a cryostat. Serial sections, comprising every sixth section, were obtained, and subjected to LacZ histochemical staining, as we previously described (Zeger et al., 2007). Briefly, sections were fixed with cold 2% PFA (paraformaldehyde) and 0.02% glutaraldehyde in PBS for 10 min on ice. After extensive washes with cold PBS, sections were incubated with a reaction buffer (Mercer et al., 1991) that contained 1 mg/ml X-Gal (5-bromo-4-chloroindol-3-yl β-d-galactopyranoside) and 2 mM MgCl2. For LacZ and immunohistochemical double staining, LacZ-stained sections were immunostained with Ki67antibody (1:500, Vector Laboratories).
Morphometric analysis of HIP (hippocampus)
Brains from embryos were fixed by immersion in 4% PFA, paraffin-embedded, and sectioned in the coronal plane. Two to three sets of serial sections (8 μm in thickness), comprising every seventh section, were obtained. One set of the series sections was stained with Cresyl Violet. To determine the volume of HIP and CA (cornu ammonis) PCL (pyramidal cell layer), the area of the brain regions on each sections [corresponding to plates between number GD18 Cor. 12 and 14 in Schambra et al. (1992)] was measured under a microscope, assisted with Stereo Investigator software (Microbrightfield). The volume (V) was then estimated using the equation V = ΣA×T×I, where ΣA is the sum of area measured on each section, T is the section thickness and I is the section intervals.
The numerical density of CA pyramidal neurons (neurons per mm3) was determined using previously published methods (Dentremont et al., 1999). Briefly, stained sections corresponding to plate GD18 Cor. 14 in Schambra et al. (1992) from each brain was selected, and cell nuclei within delineated areas of interest were counted, assisted with Stereo Investigator software. The total number of CA neurons was calculated from the estimate of tissue volume and the numerical density of neurons.
Culture of embryonic frontal cortex
Frontal cortex from E14.5 LacZTCF Tg embryos were minced into small pieces and digested with papain (1 unit/ml) at 37°C for 3 min. Single cells, obtained by titration and passing through a screen, were seeded on to poly-l-lysine-coated coverslips individually placed in six-well plates, and cultured with a growth medium [DMEM (Dulbecco's modified Eagle's medium)/F12 medium supplemented with insulin-containing F27 medium (Invitrogen)]. After 2 days in culture, the growth medium was replaced by a low-insulin medium [DMEM/F12 medium supplemented with an alternative F27 medium containing no insulin (Invitrogen) and with 5 ng/ml of insulin]. At the concentration of 5 ng/ml, insulin does not activate IGF1R. Human IGF-I (100 ng/ml, Genentech), mouse Wnt3a (10 ng/ml, R&D Systems), or a combination of both IGF-I (100 ng/ml) and Wnt3a (10 ng/ml) were then added to cultures for 24 h.
To quantify LacZ-positive (+) cells, cells on each of the coverslips were immunostained with an antibody against LacZ (1:400, Abcam). Antibody–antigen complexes were detected by an Alexa Fluor® 488-conjugated secondary antibody (Invitrogen), and cell nuclei were counterstained with the nuclear dye DAPI (4′,6-diamidino-2-phenylindole; Invitrogen). Six random fluorescent images per coverslip were digitally captured using a fluorescent microscope and a Spot Jr. digital camera (Diagnostic Instruments). LacZ+cells, each with a clearly visible nucleus, were scored on the captured images, and their number was calculated as a percentage of total cells (judged by DAPI stained nuclei). More than 970 cells in each group were assessed.
Immunohistochemistry
Brains were fresh-frozen and serially sectioned as described above. After being fixed with 4% PFA and washing with PBS, sections were subjected to immunostaining. Primary antibodies against the following proteins were used: β-catenin (1:500, BD Biosciences), LacZ (1:400, Abcam), activated caspase 3 (1:300, Cell Signaling), pH3Ser10 (histone H3 phosphorylated at Ser10; 1:2000, Cell Signaling), or Ki67 (1:500, Vector Laboratories). Antibody–antigen complexes were detected by an Alexa Fluor® 488-conjugated or Alexa Fluor® 594-conjugated secondary antibody (Invitrogen). Cell nuclei were counterstained with DAPI. Staining without primary antibodies served as negative controls, and no significant non-specific background staining was observed. Fluorescent images were digitally captured and analysed using a fluorescent microscope and a Spot Jr. digital camera.
To quantify the number of pH3Ser10+ proliferating neural precursors in VZ (ventricular zone), the areas of VZ in immuno-stained sections, corresponding to plate GD18 Cor. 10 in Schambra et al. (1992) from each brain, were digitally captured. On captured images, pH3Ser10+cells in VZ, each with a clearly visible nucleus, were scored, and their number within a defined linear length (100 μm) was calculated.
Protein Western immunoblot analysis
Tissues were pulverized on solid CO2, and protein was extracted as previously described (Richards et al., 2001). Aliquots of protein (30–40 μg) were separated on polyacrylamide gels and transferred on to PVDF membranes (Amersham). Proteins of interest were detected using specific antibodies and visualized using ECL® (enhanced chemiluminescence; Amersham). Primary antibodies against the following proteins were used: Akt (1:2000); pAktThr308 [pAkt (phosphorylated Akt) at Thr308; 1:2000]; pAktSer473 (pAkt at Ser473; 1:2000; Cell Signaling), β-catenin (1:5000, BD Biosciences); active β-catenin (1:5000, Millipore); GSK3β (1:1000, R&D Systems); pGSK3βSer9 (GSK3β phosphorylated at Ser9; 1:2500; Millipore); and β-actin (1:8000, Sigma). Images of specific protein bands on X-ray films were digitally scanned and quantitatively analysed using a computer-assisted image analysis system (Image-Pro, Media Cybermetics). The abundance of proteins of interest was normalized against their respective non-phosphorylated counterpart or β-actin.
qRT-PCR (quantitative real-time PCR)
RNA isolation and cDNA reverse-transcription qRT-PCR were performed as previously described (Liu et al., 2009a; Ye et al., 2010). The resultant mRNA-derived cDNA was quantified by qRT-PCR using primers specific for the mRNAs of interest (see Supplementary Table S1 for sequences at http://www.asnneuro.org/an/004/an004e092add.htm). These included mRNA for β-catenin, Wnt1, Wnt3, Wnt3a, Wnt5a, Wnt5b, Wnt7a, Wnt7b, TCF-4, Fzd3, Fzd4, Fzd5v1, Fzd6v1, Fzd10 and β-actin. The abundance of mRNA was determined, based on a standard curve for each target mRNA and normalized against β-actin mRNA abundance, as previously described (Liu et al., 2009a; Ye et al., 2010).
Statistics and data analysis
Either the Student's t test or one-way ANOVA followed by the Newman–Keuls–Student test, assisted with the software SigmaStat for Windows (SPSS Inc.), was used to determine the statistical significance of differences between and among means.
RESULTS
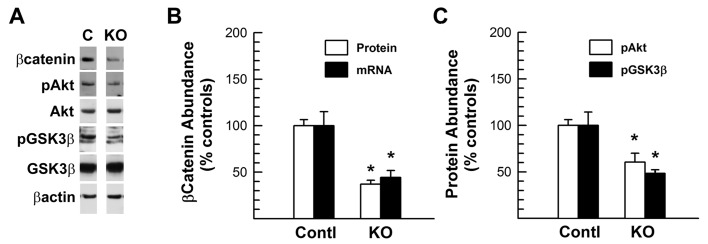
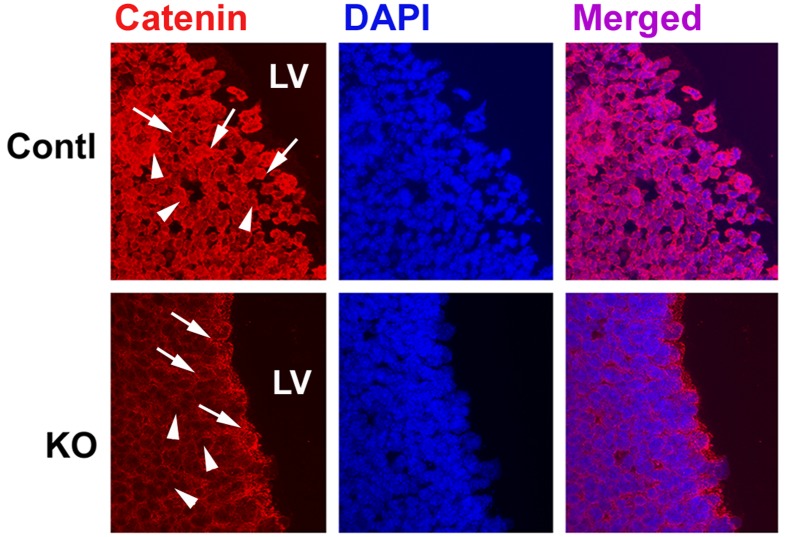
Blunting IGF–IGF1R signalling significantly reduced the expression of β-catenin in embryonic brains, a finding that is consistent with our previous study of cultured oligodendrocytes (Ye et al., 2010). When judged by Western immunoblot analysis, IGF1RNestin−KO mice at E (embryonic day) 17.5 exhibited 60–65% reduction in the abundance of brain β-catenin protein and mRNA (Figures 1A and 1B). In parallel, the abundance of pAkt and pGSK3βSer9, a signalling molecule that is known to regulate β-catenin stability, was also reduced by 40–50% in the brain of IGF1RNestin−KO mice (Figure 1C). In agreement with Western immunoblot analyses, immunoflorescence staining showed that in E17.5 IGF1RNestin−KO mice both nuclear β-catenin and membrane-bond β-catenin were markedly reduced in multiple brain regions, including HIP, VZ and SVZ (Figure 2), brain regions where neural precursors actively proliferate. Similarly, the abundance of β-catenin protein was also significantly decreased in the DG (dentate gyrus) and cerebellum of mice with an IGF-I null mutation [IGF-I KO (knockout) mice (Liu et al., 1993; Ye et al., 2002), see Supplementary Figure S1 at http://www.asnneuro.org/an/004/an004e092add.htm].
Figure 1. β-Catenin expression in IGF1RNestin−KO mice during embryonic development.
(A) Representative Western immunoblot analysis of brain β-catenin, as well as pAkt and pGSK3β, in an E17.5 IGF1RNestin−KO mouse (KO) and its littermate control (C). (B) Quantification of the abundance of brain β-catenin protein and its mRNA in E17.5 IGF1RNestin−KO mice (KO) and their littermate controls (Contl). (C) Quantification of the abundance of brain pAkt and pGSK3β protein in E17.5 IGF1RNestin−KO mice (KO) and their littermate controls (Contl). Values represent means±S.E.M. from 4–5 samples. *P<0.05, compared with controls.
Figure 2. Representative microphotographs of β-catenin immunostaining in the VZ/SVZ of an IGF1RNestin−KO mouse (KO) and a control mouse (Contl) at E17.5.
Arrows indicate membrane-bound β-catenin, and arrowheads show nuclear β-catenin. LV, lateral ventricle.
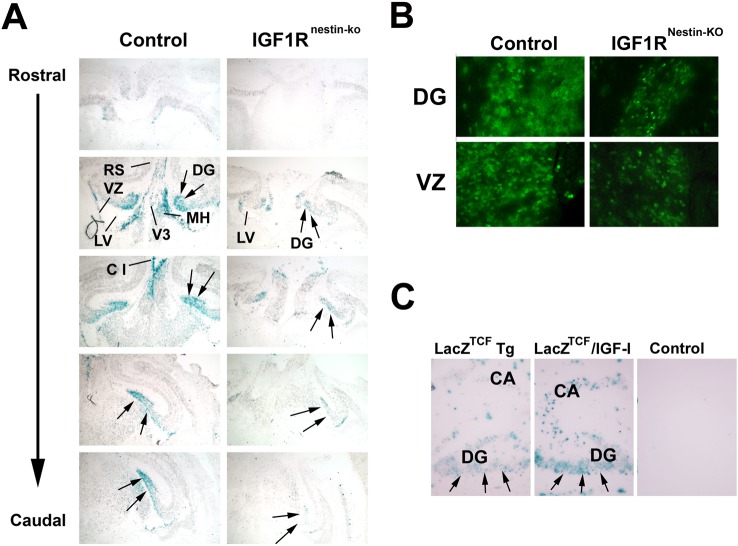
To directly determine whether IGF signalling can influence the nuclear Wnt–β-catenin signalling, we bred LacZTCF reporter Tg mice with IGF1RNestin−KO mice. LacZTCF reporter mice carry a LacZ transgene that is under the control of a promoter containing multiple copies of TCF-binding motifs and respond to β-catenin/TCF signalling (Maretto et al., 2003). Thus, this mouse model allows us to readily assess canonical Wnt–β-catenin signalling in vivo by monitoring the expression pattern of LacZ. At E16.5–E18.5, LacZ+ cells were readily detected in many brain regions, including VZ, SVZ and DG, a finding that is consistent with previous reports (Maretto et al., 2003; Lie et al., 2005). In DG, LacZ expression was predominantly observed in granule cells and subgranule layer cells. When compared with control mice (i.e. LacZTCF Tg mice without altered IGF signalling), blunting IGF1R expression in LacZTCF/IGF1RNestin−KO double mutant mice significantly decreased LacZ staining. Figure 3(A) shows representative images of LacZ staining in the brain of an E18.5 LacZTCF/IGF1RNestin−KO double mutant mouse and that of a LacZTCF Tg control mouse. Immunostaining with a LacZ antibody exhibited a pattern that is identical with LacZ staining (Figure 3B).
Figure 3. IGF signalling alteration of LacZTCF reporter transgene expression in embryonic brain.
(A) Representative microphotographs of LacZ staining in brain sections from an E18.5 LacZTCF/IGF1RNestin−KO double mutant mouse (IGF1RNestin−KO, right panels) or a LacZTCF control Tg mouse (Control, left panels). Arrows indicate DG region. C 1, cortex layer 1; MH, medial habenular nucleus; LV, lateral ventricle; RS, retrosplenial cortex; V3, third ventricle. (B) Representative microphotographs of LacZ immunostaining in the VZ and DG of an IGF1RNestin−KO mouse (KO) and a control mouse (Contl) at age of E17.5. (C) Representative microphotographs of LacZ histochemical staining in the HIP of LacZTCF/IGF-I double Tg mice. Brains of a LacZTCF Tg mouse, a LacZTCF/IGF-I double Tg mouse and its wild-type control were obtained at P12, a time when IGF-IMT−I transgene begins to be highly expressed in HIP and other brain regions (Ye et al., 1995).
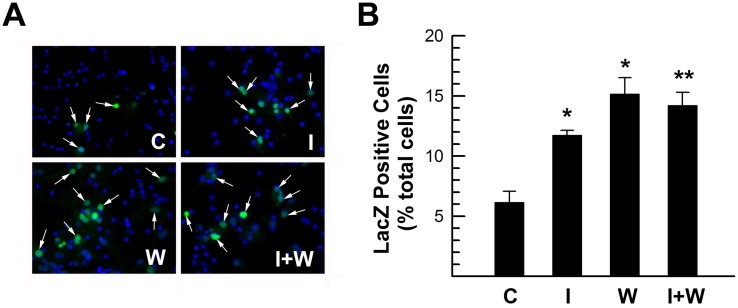
In contrast, when LacZTCF transgene expression was assessed in the brain of IGF-I overexpressing Tg mice [IGF-IMT−I Tg mice, (Ye et al., 1995)] at P (postnatal day) 12, stronger LacZ staining and more LacZ+ cells were observed (Figure 3C). Consistent with these in vivo results, IGF-I treatment of cultured embryonic cells derived from E14.5 LacZTCF frontal cortex also showed significant increases in the intensity of LacZ staining and in the number of LacZ+ cells (Figure 4). When compared with controls, the number of LacZ+ cells in IGF-I treated cultures was almost doubled (Figure 4B). Similarly, IGF-I treatment also increased the activity of a TOP–dGFP (TCF optimal promoter-destabilized green fluorescent protein) reporter gene, which also contains multiple copies of TCF-binding motifs linked to its promoter, in transfected B104 neuroblastoma cells (results not shown). Treatment with Wnt3a appeared to further increase the number of LacZ+ cells, as compared with IGF-I treatment, but the increase did not meet statistical significance (Figure 4B).
Figure 4. IGF-I increase of LacZTCF reporter transgene expression in cultures derived from E14.5 frontal cortex.
(A) Representative microphotographs of LacZ immunostained cortical cultures treated without (C) or with 100 ng/ml IGF-I (I), 10 ng/ml Wnt3a (W), or a combination of IGF-I and Wnt3a (I+W) for 24 h. Arrows indicate LacZ+ cells. (B). Quantification of LacZ+ cells. Values represent means±S.E.M. from 3–4 samples. *P<0.05; **P<0.01, compared with untreated controls.
In both VZ/SVZ and DG regions, LacZ was expressed in a pattern similar to that of Ki67 (Figure 5A), and often co-located in Ki67+ proliferating neural precursors (Figure 5B). These data are consistent with the previous results that Wnt–β-catenin signalling is active in proliferating neural precursors (Lie et al., 2005) and is required for normal cell proliferation during postnatal life (Solberg et al., 2008). IGF1R deficiency significantly decreased the number of LacZ+ cells and Ki67+ cells. In control mice, ∼47% and ∼30% of total cells were LacZ+cells in DG and VZ/SVZ respectively (Figure 5A and Table 1). Compared with controls, the number of LacZ+ cells in IGF1RNestin−KO mice was decreased by ∼53% in DG and by ∼24% in VZ/SVZ. Similarly, the number of Ki67+ cells was also decreased in IGF1RNestin−KO mice by ∼40% and ∼26% in DG and VZ/SVZ respectively (Table 1). Intriguingly, there is only a fraction of Ki67+ proliferating cells that also exhibit active expression of the LacZ reporter transgene. The reason(s) for this is not clear. One of the possible explanations is that β-catenin can activate nuclear Wnt signalling in a TCF-independent manner (Filali et al., 2002). Regardless, however, the number of cells positive for both LacZ and Ki67 in the DG and VZ/SVZ of IGF1RNestin−KO mice was altered in a pattern similar to LacZ+ cells or Ki67+ cells, being ∼30% and ∼63% of that in controls respectively (Table 1).
Figure 5. LacZ+ cells and Ki67+ cells in E17.5 LacZTCF/IGF1RNestin−KO mice.
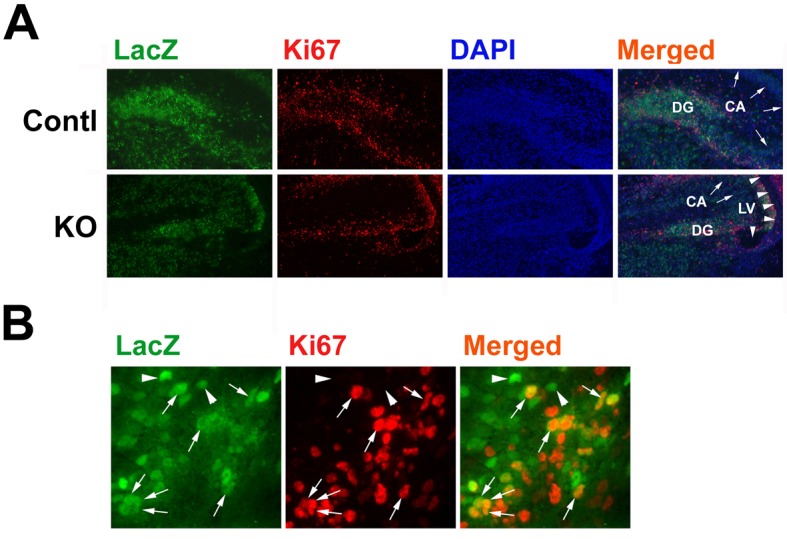
(A) Representative microphotographs of LacZ and Ki67 double immunostaining in the HIP and DG regions of a LacZTCF/IGF1RNestin−KO mouse (KO) or of a LacZTCF control mouse (Contl). DG, dentate gyrus; LV, lateral ventricle. Arrows indicate CA regions and arrowheads point to lateral ventricles. (B) Representative microphotographs of double-immunostained DG at a high magnification. Arrows point to cells that are positive for both LacZ and Ki67, and arrowheads indicate LacZ+ and Ki67− cells.
Table 1. The number of LacZ+ cells, Ki67+ cells and LacZ+/Ki67+ cells in the VZ/SVZ and DG of IGF1RNestin−KO mice and controls.
Brain sections of IGF1RNestin−KO and control mice at age of E17.5 were subjected to LacZ and Ki67 double immunostaining. LacZ+ cells, Ki67+ cells and LacZ+/Ki67+ cells were scored on the sections corresponding to plate GD18 Cor. 10 (VZ/SVZ) or plate Cor 14 (DG) respectively in Schambra et al. (1992). Values are expressed as the percentage of total number of cells, and represent means±S.E.M. from 3–4 samples. *P<0.05; **P<0.01, compared with control mice.
| Control mice | IGF1RNestin−KO mice | |
|---|---|---|
| VZ/SVZ | ||
| LacZ+ cells | 29.96±0.90 | 22.87±1.44 * |
| Ki67+ cells | 52.74±0.52 | 39.18±0.17 ** |
| LacZ+/Ki67+ cells | 19.29±0.94 | 12.16±0.43 * |
| DG | ||
| LacZ+ cells | 46.69±3.79 | 22.10±1.08 * |
| Ki67+ cells | 50.10±6.79 | 30.15±1.08 * |
| LacZ+/Ki67+ cells | 23.82±0.23 | 6.92±0.74 ** |
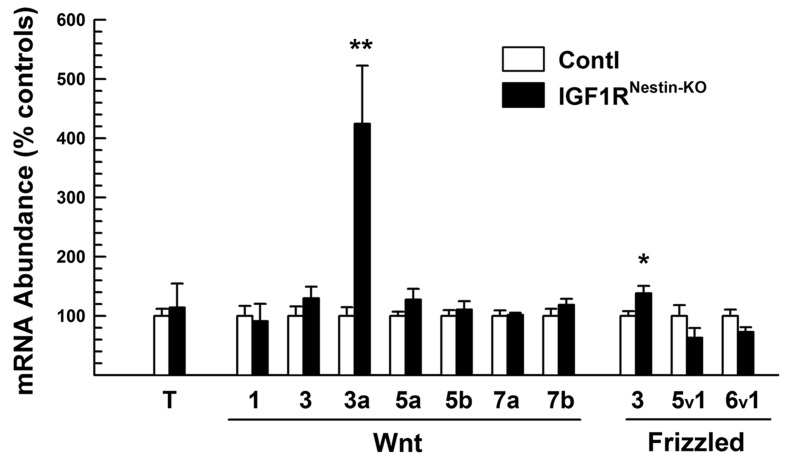
It has been shown that, in Xenopus embryo, IGF-I is capable of regulating the expression of several Wnt mRNAs (Carron et al., 2005). To determine whether IGF signalling also can regulate the expression of other canonical Wnt signalling molecules in mouse brain, we quantified the abundance of mRNA for Wnt ligands, frizzled receptors and TCF-4 transcription factor, which are highly expressed in the CNS in a spatial- and temporal-specific pattern (Roelink and Nusse, 1991; Parr et al., 1993; Hollyday et al., 1995; Cho and Dressler, 1998). As shown in Figure 6, the mRNA abundance of the Wnt ligands and Frizzled receptors examined, except for Wnt 3a and Frizzled 3, was similar in the brain of E17.5 IGF1RNestin−KO mice and control mice. The abundance of TCF-4 mRNA in IGF1RNestin−KO mice also did not differ from that in control mice (Figure 6). In contrast, the mRNA abundance of both Wnt 3a and Frizzled 3 in the brain of IGF1RNestin−KO mice was significantly increased, being ∼400% and 130% of that in control mice respectively (Figure 6).
Figure 6. mRNA expression of Wnt ligands, Frizzled receptors, and TCF-4 transcription factor (T) in the brains of E17.5 IGF1RNestin−KO mutant (KO) and control (Contl) mice.
Values represent means±S.E.M. from 4–5 samples. *P<0.05; **P<0.01, compared with control mice.
Blunting IGF–IGF1R signalling in mutant mice significantly reduces neural cell proliferation, survival and development (Zeger et al., 2007; Liu et al., 2009b; Lehtinen et al., 2011; Liu et al., 2011). If β-catenin is a downstream signalling molecule in the IGF–IGF1R–Akt pathway, increasing β-catenin abundance could, at least in part, rescue the phenotypic changes induced by IGF1R deficiency. To test this possibility, we increased the abundance of brain β-catenin by treating pregnant dams bearing E11.5 IGF1RNestin−KO embryos with lithium. Lithium, a widely used clinical medicine to control mood (Emilien et al., 1995; Cookson, 2001), has been shown to suppress GSK3β activity (by increasing GSK3β phosphorylation), resulting in an increase in β-catenin stability, and, thus, its abundance. In addition, lithium has no obvious effects on Akt activity in cultured oligodendrocyte precursors (Ye et al., 2010) or in brain (De et al., 2002), or the activity of PKA (protein kinase A), Erk1 (extracellular-signal-regulated kinase 1) and CKII (casein kinase II) in vitro (Klein and Melton, 1996).
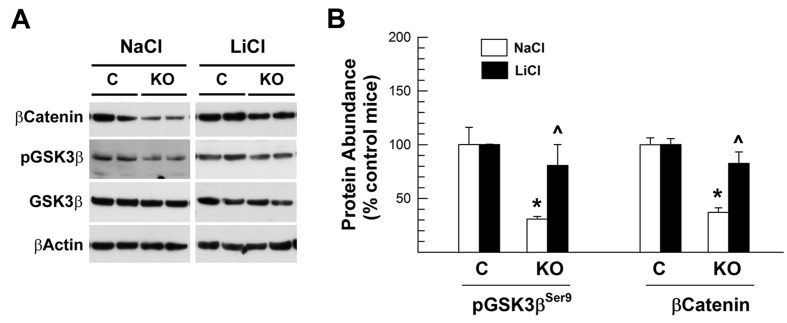
As we reported above, the abundance of inactive pGSK3βSer9 and β-catenin was significantly reduced in the brain of IGF1RNestin−KO mice treated with NaCl, being ∼40% of that in NaCl-treated littermate controls (Figure 7). Compared with LiCl-treated littermate controls, the abundance of pGSK3βSer9 and β-catenin also was reduced in the IGF1RNestin−KO mice treated with LiCl for 6 days. The magnitude of the reduction, however, was much smaller, and the abundance of pGSK3βSer9 and β-catenin proteins in LiCl-treated IGF1RNestin−KO mice was twice as much as that in NaCl-treated IGF1RNestin−KO mice (Figure 7). Similar results were also observed for non-phosphorylated and active β-catenin proteins (results not shown).
Figure 7. The abundance of pGSK3β and β-catenin proteins in the brain of LiCl-treated E17.5 IGF1RNestin−KO mice.
E11.5 IGF1RNestin−KO (KO) and control (C) mice were treated with LiCl or NaCl for 6 days, and killed at E17.5, as described in the Materials and methods section. (A) Representative Western immunoblot analysis of forebrain pGSK3β and β-killed. (B) Quantification of pGSK3β and β-catenin protein abundance. The abundance of pGSK3β and β-catenin in NaCl-treated or LiCl-treated IGF1RNestin−KO mice is expressed as the percentage of their respective littermate controls to eliminate the potential influence of developmental variations among litters. Values represent means±S.E.M. from 5–7 samples. *P<0.01, compared with their respective control mice; ˆP<0.05, compared with NaCl-treated IGF1RNestin−KO mice.
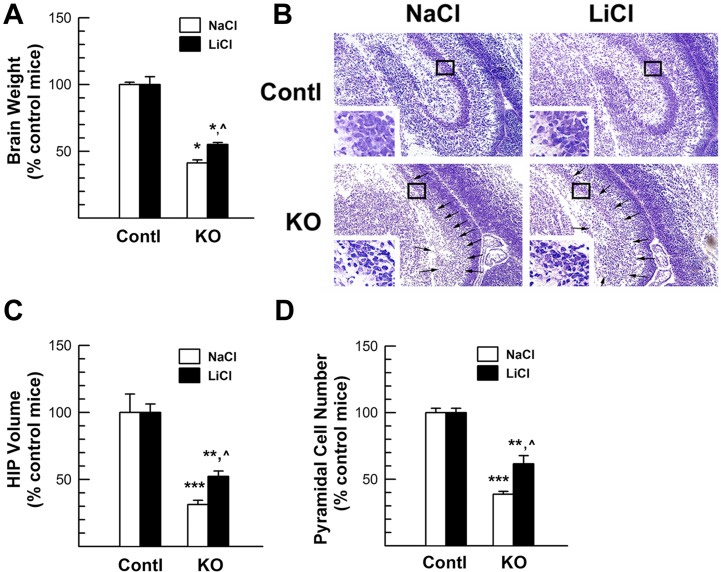
Next, we examined the morphology of the HIP, a brain region with a distinct cytoarchitecture that facilitates our analysis. LiCl treatment markedly mitigated the detrimental effects of IGF1R ablation on the growth of brain and HIP (Figure 8). When compared with NaCl-treated IGF1RNestin−KO mice, the brain weight of E17.5 IGF1RNestin−KO mice that were previously treated with LiCl for 6 days was ∼40% greater (Figure 8A). At other developmental ages, i.e., E16.5 and E18.5, similar results were also observed in IGF1RNestin−KO mice that were respectively treated with LiCl-treated for 5 or 7 days (Supplementary Figure S2 available online at http://www.asnneuro.org/an/004/an004e092add.htm), further validating LiCl effects on brain growth in IGF1RNestin−KO mice. Consistently, the size of HIP in LiCl-treated E17.5 IGF1RNestin−KO mice was ∼48% greater than that in NaCl-treated IGF1RNestin−KO mice (Figures 8B and 8C). The cortex plate in LiCl-treated IGF1RNestin−KO mice also was ∼20% thicker (results not shown).
Figure 8. Brain and HIP growth in LiCl-treated IGF1RNestin−KO mice.
E11.5 IGF1RNestin−KO (KO) and control (Contl) mice were treated with LiCl or NaCl for 6 days. (A) Brain weight. (B) Representative microphotographs of HIP. Inserts in each panel show CA PCL in boxed area. Arrows in the bottom panels indicate CA and DG regions. (C) HIP volume. (D) CA pyramidal neuron number. In (A, C, D), values are expressed as the percentage of their respective control mice, and represent means±S.E.M. from 4–7 samples. *P<0.05; **P<0.01; ***P<0.001, compared with their respective control mice; ˆP<0.05, compared with NaCl-treated IGF1RNestin−KO mice.
As with HIP, the volume of CA PCL was significantly reduced in NaCl-treated mice and LiCl-treated IGF1RNestin−KO mice. The density of PCL neurons was similar in all groups of mice (Table 2), and thus, the reduction in the PCL neuron number in IGF1RNestin−KO mice was largely due to the decrease in PCL volume (Figure 8D). The magnitude of the reduction in CA PCL volume and the number of PCL neurons, however, was much smaller in LiCl-treated IGF1RNestin−KO mice. Compared with NaCl-treated IGF1RNestin−KO mice, the PCL volume and PCL neurons in LiCl-treated IGF1RNestin−KO mice was 63 −66% greater (Figure 8D). Because DG and hilus could not be accurately delineated in IGF1RNestin−KO mice due to dramatic growth retardation (Figures 3 and 7), the number of neurons in the DG region was not analysed.
Table 2. Cell density (number/mm2) in the CA and cerebral cortex (CTX) of LiCl-treated IGF1RNestin−KO and control mice.
E11.5 IGF1RNestin−KO and control mice were treated with LiCl or NaCl for 6 days, and killed at age of E17.5. Values represent means±S.E.M, from 4–7 samples.
| NaCl-treated | LiCl-treated | |||
|---|---|---|---|---|
| Control | IGF1RNestin−KO | Control | IGF1RNestin−KO | |
| CA 1—2 | 11379.13±583.90 | 11074.60±173.08 | 10731.84±353.62 | 11412.36±172.06 |
| CA3 | 10228.13±493.22 | 11710.94±367.40 | 10459. 41±498.51 | 10889.18±213.92 |
| CTX | 11623.29±926.54 | 12685.73±511.19 | 10556.29±605.07 | 11894.49±810.18 |
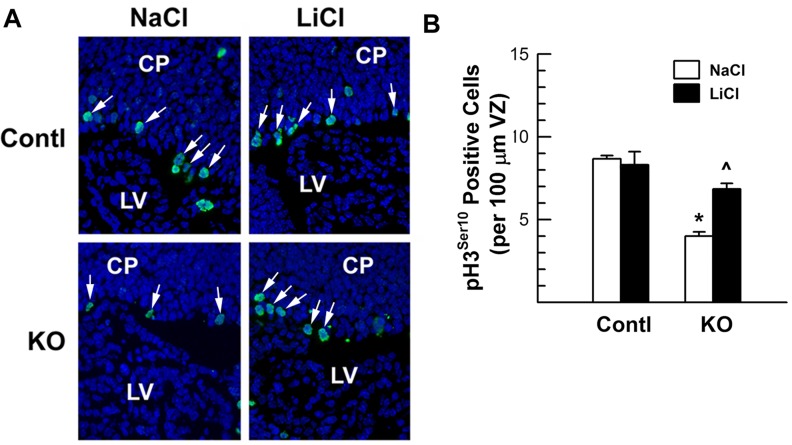
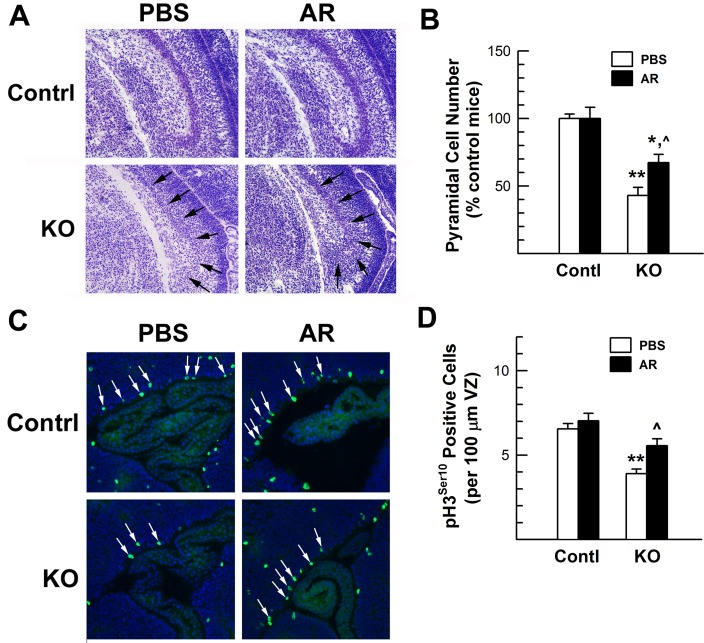
Next, we quantified the effects of LiCl on neural proliferation by determining the number of the VZ neural precursors positive for pH3Ser10, a nuclear marker for the proliferating cells that are in the M phase of the cell cycle. Consistent with our previous report that IGF increases the number of pH3Ser10+ neural cells in embryonic VZ explants (Lehtinen et al., 2011), blunting IGF1R expression significantly reduced the number of pH3Ser10+ cells in the VZ of IGF1RNestin−KO mice. Compared with NaCl-treated controls, NaCl-treated IGF1RNestin−KO mice exhibited ∼64% reduction in proliferating pH3Ser10+ precursors in VZ (Figure 9). LiCl-treated IGF1RNestin−KO mice also exhibited a decreased number of pH3Ser10+ precursors, but the magnitude of the reduction was much smaller. When compared with NaCl-treated IGF1RNestin−KO mice, LiCl-treated IGF1RNestin−KO mice had ∼72% more pH3Ser10+ cells in VZ (Figure 9). Quantification of proliferating neural precursors positive for Ki67, a marker for proliferating cells in the G1, G2 and S phases of the cell cycle, showed changes in a similar pattern (Table 3 and Supplementary Figure S3 available online at http://www.asnneuro.org/an/004/an004e092add.htm). Treatment of E11.5 IGF1RNestin−KO mice with the GSK3β inhibitor AR-A014418 for 6 days had similar results on HIP growth and neural precursor proliferation (Figure 10).
Figure 9. Proliferating neural precursors in the VZ/SVZ of E17.5 IGF1RNestin−KO mutant mice (KO) and their control littermates (Contl) that were previously treated with LiCl or NaCl for 6 days.
(A) Representative microphotographs of VZ pH3Ser10 immunostaining. Arrows indicate pH3Ser10-positive proliferating cells. (B) Quantification of pH3Ser10 positive proliferating cells. Values represent means±S.E.M. from 3–4 samples. *P<0.001, compared with their respective control mice; ˆP<0.01, compared with NaCl-treated IGF1RNestin−KO mice.
Table 3. The number of Ki67+ proliferating neural precursors in the VZ/SVZ and DG of IGF1RNestin−KO mice and controls treated with LiCl.
IGF1RNestin−KO and control mice at age of E11.5 were treated with LiCl or NaCl for 6 days and killed at age of E17.5. Ki67+ cells were scored on the sections corresponding to plate GD18 Cor. 10 (VZ/SVZ) or plate Cor 14 (DG) respectively in Schambra et al. (1992). Values are expressed as the percentage of total number of cells, and represent means±S.E.M. from 3–4 samples. *P < 0.05; *P < 0.01; ***P < 0.001, compared with their respective control mice treated with NaCl or LiCl; ˆP<0.05; ˆ ˆP<0.01, compared with NaCl-treated IGF1RNestin−KO mice.
| Control mice | IGF1RNestin−KO mice | |
|---|---|---|
| VZ/SVZ | ||
| NaCl treated | 70.60±2.71 | 43.20±2.34*** |
| LiCl treated | 69.70±1.95 | 56.39±4.21*, ˆ |
| DG | ||
| NaCl treated | 43.79±2.20 | 22.17±1.06*** |
| LiCl treated | 40.93±2.57 | 31.12±2.43**, ˆ ˆ |
Figure 10. Hippocampal growth and neural precursor proliferation in the VZ/SVZ of E17.5 IGF1RNestin−KO mutant mice (KO) and their control littermates (Contl) that were previously treated with AR-A014418 (AR) or PBS for 6 days.
(A) Representative microphotographs of HIP. Arrows in the bottom panels indicate CA region. (B) CA pyramidal neuron number. (C) Representative microphotographs of VZ pH3Ser10 immunostaining. Arrows indicate pH3Ser10+ proliferating cells. (D) Quantification of pH3Ser10+proliferating cells. In (B, D), values represent means±S.E.M. from 3 samples. *P<0.05; **P<0.01, compared with their respective control mice; ˆP<0.05, compared with PBS-treated IGF1RNestin−KO mice.
In contrast, only a few apoptotic cells (as judged by immunolabelling for activated caspase 3) were detected in the VZ and other brain regions in E17.5 IGF1RNestin−KO mice and control mice (Supplementary Figure S4 available at http://www.asnneuro.org/an/004/an004e092add.htm) regardless of treatment. The number of apoptotic cells in the VZ of IGF1RNestin−KO mice did not differ from that in control mice (results not shown), a finding that is consistent with our previous report (Lehtinen et al., 2011).
DISCUSSION
The data from our current study strongly support the concept that, in developing neural cells, β-catenin is a signalling molecule downstream of IGF–I–PI3K–Akt–GSK3β, and that IGF signalling can interact with canonical Wnt–catenin signalling to promote neural precursor proliferation in vivo. Specifically, we have shown that, in the brain of mutant mice, blunting the expression of neural IGF-I or IGF1R significantly reduces: (i) the abundance of pGSK3β, an enzyme known to regulate β-catenin stability, (ii) the expression of β-catenin, a key member of the canonical Wnt signalling pathway, at both mRNA and protein levels and (iii) the activity of the LacZTCF reporter transgene that responds to nuclear Wnt signalling stimulation. In contrast, overexpressing IGF-I in LacZTCF Tg brain and IGF-I treatment of cultured neuronal cells derived from LacZTCF brain markedly increases the expression of the LacZTCF reporter transgene. Furthermore, increasing β-catenin abundance by suppressing pGSK3β activity drastically reduces the detrimental effects of IGF1R deficiency on neural growth, as evidenced by increases in brain weight, the volume of HIP and CA, the number of PCL neurons, and the neural proliferation capacity in IGF1RNestin−KO mice.
Consistent with our previous report showing a critical role for neural IGF signalling during postnatal life (Liu et al., 2009b), our current study also demonstrates that blunting IGF1R expression specifically in the nestin+ neural precursors and their progeny significantly reduces the weight of developing brain, the volume of HIP and the number of pyramidal neurons during embryonic development. These results support a critical role for IGF–IGF1R signalling in neurogenesis and brain growth during normal prenatal development. At E17.5, when neural precursors actively proliferated in both VZ/SVZ and HIP, deficiency in IGF–IGF1R signalling leads to a significant reduction in the number of proliferating neural precursors. In contrast, less than 0.05% of active caspase 3 positive apoptotic cells are detected in VZ and other brain regions, and no significant differences are observed between IGF1RNestin−KO mice and control mice. These data are consistent with our previous study of Tg mice overexpressing IGF-I in nestin+ neural precursors (Popken et al., 2004), and suggest that, at this stage of brain development, neural apoptosis is unlikely a major factor in neurogenesis; rather, precursor proliferation plays a significant role in response to IGF stimulation.
The Erk MAPK (mitogen-activated protein kinase) pathway has been thought to play a major role in cell proliferation. However, accumulating evidence indicates that in neural cells the PI3K-Akt pathway plays a critical role in cell proliferation and is likely required for a full mitogenic response to IGF-I. Overexpression of Akt enhances the proliferation of cortical neural precursors (Sinor and Lillien, 2004). Conversely, inhibiting PI3K-Akt activity markedly suppresses the IGF-I-stimulated proliferation in cultured cortical neural precursors (Mairet-Coello et al., 2009) and cerebellar granule cell precursors (Cui et al., 1998). In line with these reports, our previous studies of cultured oligodendroglial precursor cells also demonstrate that inhibition of PI3K-Akt activity hinders the IGF-I-stimulated expression of mRNA for cyclin D1 protein (Ye et al., 2010), a molecule key to the cell-cycle progression through the G1/S phases. The IGF-I stimulatory effects on cyclin D1 expression are partially mediated by β-catenin (Ye et al., 2010), a key member of the canonical Wnt signalling pathway, indicating that IGF signalling can interact with Wnt canonical signalling, via the PI3K-Akt-β-catenin pathway, to promote their proliferations. While the predominant neuronal expression of the nestin-driven Cre transgene in our mutant mice (Liu et al., 2009b) precludes studies on oligodendrocyte lineage cells in vivo, our current study clearly supports the concept that β-catenin plays an important role in IGF proliferation signalling during neuronal development by showing that in neuronal precursor cells: (i) IGF signalling regulates the abundance of β-catenin and the activity of the LacZTCF reporter transgene, which responds to nuclear Wnt signalling stimulation, and (ii) increasing β-catenin abundance mitigates the detrimental effects of IGF1R deficiency on neural proliferation.
Our data also show that ablating neural IGF1R expression significantly reduces the abundance of β-catenin protein and its mRNA in the brain of mutant mice, suggesting that IGF signalling regulates the expression of β-catenin at both the protein and mRNA level. These findings are consistent with our previous study of cultured neural cells (Ye et al., 2010). In cultured oligodendrocytes, IGF-I rapidly increases the abundance of β-catenin protein as early as 1 h after treatment, likely by enhancing its stability. In contrast, the expression of β-catenin mRNA is not altered during first 4 h of treatment and becomes significantly up-regulated after 24 h of treatment (Ye et al., 2010). Despite the distinct patterns of β-catenin protein and its mRNA expression in response to IGF-I stimulation, inhibition of PI3K-Akt kinases significantly suppresses the IGF-I-stimulated increases in both β-catenin protein and mRNA (Ye et al., 2010), indicating a critical role for PI3K-Akt in IGF-I stimulatory actions on both β-catenin protein and mRNA in cultured oligodendrocytes. Whether IGF signalling also regulates the expression of β-catenin protein and its mRNA in a similar pattern in vivo remains to be determined.
While the brain expression of individual members in the Wnt signalling pathway has not been fully defined, multiple Wnt ligands, Frizzled receptors and TCF/LEF (lymphoid enhancer factor) family transcription factors are highly expressed in the CNS in a spatial- and temporal-specific pattern (Roelink and Nusse, 1991; Parr et al., 1993; Hollyday et al., 1995; Cui and Bulleit, 1998). Consistent with these reports, we also observed abundant expression of mRNA for multiple Wnt ligands and Frizzled receptors, as well as TCF-4 transcription factor, in developing forebrains. The mRNA abundance of these proteins, however, is similar in E17.5 IGF1RNestin−KO mice and their littermate controls, except for Wnt 3a mRNA and Frizzled 3 mRNA, both of which are increased in IGF1RNestin−KO mice. As β-catenin, a molecule downstream of Wnt and Frizzled receptor, is significantly decreased in IGF1RNestin−KO mice, we interpret the increased expression of Wnt 3a and Frizzled 3 mRNA as compensatory to reduced β-catenin signalling, and deem that IGF signalling and Wnt signalling are likely to interact mainly at the levels of GSK3β and β-catenin, although other mechanisms may also exist.
In summary, our new findings strongly point to a critically important role for the IGF and Wnt–β-catenin signalling interaction during normal in vivo neurogenesis, and suggest that β-catenin is a common effector mediating a portion of IGF and Wnt signalling to promote neural cell proliferation. Our conclusion is further supported by an earlier report that IGF-I signalling is capable of interacting with Wnt–JNK (c-Jun N-terminal kinase) signalling in Xenopus embryo (Carron et al., 2005), albeit their actions are likely different in early stages of embryonic development. More studies are needed to precisely define IGF signalling pathways and their interaction with Wnt signalling.
Footnotes
This work was supported by the National Institutes of Health [grant numbers RO1 NS038891 and RO1 HD008299].
REFERENCES
- Aberle H, Bauer A, Stappert J, Kispert A, Kemler R. Beta-catenin is a target for the ubiquitin-proteasome pathway. EMBO J. 1997;16:3797–3804. doi: 10.1093/emboj/16.13.3797. [DOI] [PMC free article] [PubMed] [Google Scholar]
- Adachi K, Mirzadeh Z, Sakaguchi M, Yamashita T, Nikolcheva T, Gotoh Y, Peltz G, Gong L, Kawase T, varez-Buylla A, Okano H, Sawamoto K. Beta-catenin signaling promotes proliferation of progenitor cells in the adult mouse subventricular zone. Stem Cells. 2007;25:2827–2836. doi: 10.1634/stemcells.2007-0177. [DOI] [PubMed] [Google Scholar]
- Amit S, Hatzubai A, Birman Y, Andersen JS, Ben-Shushan E, Mann M, Ben-Neriah Y, Alkalay I. Axin-mediated CKI phosphorylation of beta-catenin at Ser 45: a molecular switch for the Wnt pathway. Genes Dev. 2002;16:1066–1076. doi: 10.1101/gad.230302. [DOI] [PMC free article] [PubMed] [Google Scholar]
- Beck KD, Powell-Braxton L, Widmer HR, Valverde J, Hefti F. IGF1 gene disruption results in reduced brain size, CNS hypomyelination, and loss of hippocampal granule and striatal parvalbumin-containing neurons. Neuron. 1995;14:717–730. doi: 10.1016/0896-6273(95)90216-3. [DOI] [PubMed] [Google Scholar]
- Carron C, Bourdelas A, Li HY, Boucaut JC, Shi DL. Antagonistic interaction between IGF and Wnt/JNK signaling in convergent extension in Xenopus embryo. Mech Dev. 2005;122:1234–1247. doi: 10.1016/j.mod.2005.06.007. [DOI] [PubMed] [Google Scholar]
- Carson MJ, Behringer RR, Brinster RL, McMorris FA. Insulin-like growth factor I increases brain growth and central nervous system myelination in transgenic mice. Neuron. 1993;10:729–740. doi: 10.1016/0896-6273(93)90173-o. [DOI] [PubMed] [Google Scholar]
- Chenn A, Walsh CA. Regulation of cerebral cortical size by control of cell cycle exit in neural precursors. Science. 2002;297:365–369. doi: 10.1126/science.1074192. [DOI] [PubMed] [Google Scholar]
- Chenn A, Walsh CA. Increased neuronal production, enlarged forebrains and cytoarchitectural distortions in beta-catenin overexpressing transgenic mice. Cereb Cortex. 2003;13:599–606. doi: 10.1093/cercor/13.6.599. [DOI] [PubMed] [Google Scholar]
- Cho EA, Dressler GR. TCF-4 binds beta-catenin and is expressed in distinct regions of the embryonic brain and limbs. Mech Dev. 1998;77:9–18. doi: 10.1016/s0925-4773(98)00131-2. [DOI] [PubMed] [Google Scholar]
- Chrysis D, Calikoglu AS, Ye P, D'Ercole AJ. Insulin-like growth factor-I overexpression attenuates cerebellar apoptosis by altering the expression of Bcl family proteins in a developmentally specific manner. J Neurosci. 2001;21:1481–1489. doi: 10.1523/JNEUROSCI.21-05-01481.2001. [DOI] [PMC free article] [PubMed] [Google Scholar]
- Cookson J. Use of antipsychotic drugs and lithium in mania. Br J Psychiatry Suppl. 2001;41:s148–s156. [PubMed] [Google Scholar]
- Cui H, Bulleit RF. Potassium chloride inhibits proliferation of cerebellar granule neuron progenitors. Brain Res Dev Brain Res. 1998;106:129–135. doi: 10.1016/s0165-3806(97)00204-6. [DOI] [PubMed] [Google Scholar]
- Cui H, Meng Y, Bulleit RF. Inhibition of glycogen synthase kinase 3beta activity regulates proliferation of cultured cerebellar granule cells. Brain Res Dev Brain Res. 1998;111:177–188. doi: 10.1016/s0165-3806(98)00136-9. [DOI] [PubMed] [Google Scholar]
- D'Ercole AJ, Ye P, Calikoglu AS, Gutierrez-Ospina G. The role of the insulin-like growth factors in the central nervous system. Mol Neurobiol. 1996;13:227–255. doi: 10.1007/BF02740625. [DOI] [PubMed] [Google Scholar]
- De SP, Li X, Jope RS. Regulation of Akt and glycogen synthase kinase-3 beta phosphorylation by sodium valproate and lithium. Neuropharmacology. 2002;43:1158–1164. doi: 10.1016/s0028-3908(02)00215-0. [DOI] [PubMed] [Google Scholar]
- Dentremont KD, Ye P, D'Ercole AJ, O'Kusky JR. Increased insulin-like growth factor-I (IGF-I) expression during early postnatal development differentially increases neuron number and growth in medullary nuclei of the mouse. Dev Brain Res. 1999;114:135–141. doi: 10.1016/s0165-3806(99)00024-3. [DOI] [PubMed] [Google Scholar]
- Efstratiadis A. Genetics of mouse growth. Int J Dev Biol. 1998;42:955–976. [PubMed] [Google Scholar]
- Emilien G, Maloteaux JM, Seghers A, Charles G. Lithium therapy in the treatment of manic-depressive illness. Present status and future perspectives. A critical review. Arch Int Pharmacodyn Ther. 1995;330:251–278. [PubMed] [Google Scholar]
- Filali M, Cheng N, Abbott D, Leontiev V, Engelhardt JF. Wnt-3A/beta-catenin signaling induces transcription from the LEF-1 promoter. J Biol Chem. 2002;277:33398–33410. doi: 10.1074/jbc.M107977200. [DOI] [PubMed] [Google Scholar]
- Grunfeld JP, Rossier BC. Lithium nephrotoxicity revisited. Nat Rev Nephrol. 2009;5:270–276. doi: 10.1038/nrneph.2009.43. [DOI] [PubMed] [Google Scholar]
- Gutierrez-Ospina G, Calikoglu AS, Ye P, D'Ercole AJ. In vivo effects of insulin-like growth factor-I on the development of sensory pathways: analysis of the primary somatic sensory cortex (S1) of transgenic mice. Endocrinology. 1996;137:5484–5492. doi: 10.1210/endo.137.12.8940375. [DOI] [PubMed] [Google Scholar]
- Hodge RD, D'Ercole AJ, O'Kusky JR. Insulin-like growth factor-I accelerates the cell cycle by decreasing G1 phase length and increases cell cycle reentry in the embryonic cerebral cortex. J Neurosci. 2004;24:10201–10210. doi: 10.1523/JNEUROSCI.3246-04.2004. [DOI] [PMC free article] [PubMed] [Google Scholar]
- Hollyday M, McMahon JA, McMahon AP. Wnt expression patterns in chick embryo nervous system. Mech Dev. 1995;52:9–25. doi: 10.1016/0925-4773(95)00385-e. [DOI] [PubMed] [Google Scholar]
- Junghans D, Hack I, Frotscher M, Taylor V, Kemler R. Beta-catenin-mediated cell-adhesion is vital for embryonic forebrain development. Dev Dyn. 2005;233:528–539. doi: 10.1002/dvdy.20365. [DOI] [PubMed] [Google Scholar]
- Kappeler L, De Magalhaes FC, Dupont J, Leneuve P, Cervera P, Perin L, Loudes C, Blaise A, Klein R, Epelbaum J, Le BY, Holzenberger M. Brain IGF-1 receptors control mammalian growth and lifespan through a neuroendocrine mechanism. PLoS Biol. 2008;6:e254. doi: 10.1371/journal.pbio.0060254. [DOI] [PMC free article] [PubMed] [Google Scholar]
- Klein PS, Melton DA. A molecular mechanism for the effect of lithium on development. Proc Natl Acad Sci USA. 1996;93:8455–8459. doi: 10.1073/pnas.93.16.8455. [DOI] [PMC free article] [PubMed] [Google Scholar]
- Leeman MF, Vuylsteke A, Ritchie AJ. Lithium-induced nephrogenic diabetes insipidus after coronary artery bypass. Ann Thorac Surg. 2007;84:656–657. doi: 10.1016/j.athoracsur.2007.03.005. [DOI] [PubMed] [Google Scholar]
- Lehtinen MK, Zappaterra MW, Chen X, Yang YJ, Hill AD, Lun M, Maynard T, Gonzalez D, Kim S, Ye P, D'Ercole AJ, Wong ET, LaMantia AS, Walsh CA. The cerebrospinal fluid provides a proliferative niche for neural progenitor cells. Neuron. 2011;69:893–905. doi: 10.1016/j.neuron.2011.01.023. [DOI] [PMC free article] [PubMed] [Google Scholar]
- Lie DC, Colamarino SA, Song HJ, Desire L, Mira H, Consiglio A, Lein ES, Jessberger S, Lansford H, Dearie AR, Gage FH. Wnt signalling regulates adult hippocampal neurogenesis. Nature. 2005;437:1370–1375. doi: 10.1038/nature04108. [DOI] [PubMed] [Google Scholar]
- Liu C, Li Y, Semenov M, Han C, Baeg GH, Tan Y, Zhang Z, Lin X, He X. Control of beta-catenin phosphorylation/degradation by a dual-kinase mechanism. Cell. 2002;108:837–847. doi: 10.1016/s0092-8674(02)00685-2. [DOI] [PubMed] [Google Scholar]
- Liu H, Hu Q, D'Ercole AJ, Ye P. Histone deacetylase 11 regulates oligodendrocyte-specific gene expression and cell development in OL-1 oligodendroglial cells. Glia. 2009a;57:1–12. doi: 10.1002/glia.20729. [DOI] [PMC free article] [PubMed] [Google Scholar]
- Liu JP, Baker J, Perkins AS, Robertson EJ, Efstratiadis A. Mice carrying null mutations of the genes encoding insulin-like growth factor 1 (IGF-1) and type 1 IGF receptor (igf1r). Cell. 1993;75:59–72. [PubMed] [Google Scholar]
- Liu W, Ye P, O'Kusky JR, D'Ercole AJ. Type 1 insulin-like growth factor receptor signaling is essential for the development of the hippocampal formation and dentate gyrus. J Neurosci Res. 2009b;87:2821–2832. doi: 10.1002/jnr.22129. [DOI] [PubMed] [Google Scholar]
- Liu W, D'Ercole AJ, Ye P. Blunting type 1 insulin-like growth factor receptor expression exacerbates neuronal apoptosis following hypoxic/ischemic injury. BMC Neurosci. 2011;12:64. doi: 10.1186/1471-2202-12-64. [DOI] [PMC free article] [PubMed] [Google Scholar]
- Machon O, van den Bout CJ, Backman M, Kemler R, Krauss S. Role of beta-catenin in the developing cortical and hippocampal neuroepithelium. Neuroscience. 2003;122:129–143. doi: 10.1016/s0306-4522(03)00519-0. [DOI] [PubMed] [Google Scholar]
- Mairet-Coello G, Tury A, DiCicco-Bloom E. Insulin-like growth factor-1 promotes G(1)/S cell cycle progression through bidirectional regulation of cyclins and cyclin-dependent kinase inhibitors via the phosphatidylinositol 3-kinase/Akt pathway in developing rat cerebral cortex. J Neurosci. 2009;29:775–788. doi: 10.1523/JNEUROSCI.1700-08.2009. [DOI] [PMC free article] [PubMed] [Google Scholar]
- Maretto S, Cordenonsi M, Dupont S, Braghetta P, Broccoli V, Hassan AB, Volpin D, Bressan GM, Piccolo S. Mapping Wnt/beta-catenin signaling during mouse development and in colorectal tumors. Proc Natl Acad Sci USA. 2003;100:3299–3304. doi: 10.1073/pnas.0434590100. [DOI] [PMC free article] [PubMed] [Google Scholar]
- Mercer EH, Hoyle GW, Kapur RP, Brinster RL, Palmiter RD. The dopamine beta-hydroxylase gene promoter directs expression of E. coli lacZ to sympathetic and other neurons in adult transgenic mice. Neuron. 1991;7:703–716. doi: 10.1016/0896-6273(91)90274-4. [DOI] [PubMed] [Google Scholar]
- Ni W, Rajkumar K, Nagy JI, Murphy LJ. Impaired brain development and reduced astrocyte response to injury in transgenic mice expressing IGF binding protein-1. Brain Res. 1997;769:97–107. doi: 10.1016/s0006-8993(97)00676-8. [DOI] [PubMed] [Google Scholar]
- Noble W, Planel E, Zehr C, Olm V, Meyerson J, Suleman F, Gaynor K, Wang L, LaFrancois J, Feinstein B, Burns M, Krishnamurthy P, Wen Y, Bhat R, Lewis J, Dickson D, Duff K. Inhibition of glycogen synthase kinase-3 by lithium correlates with reduced tauopathy and degeneration in vivo. Proc Natl Acad Sci USA. 2005;102:6990–6995. doi: 10.1073/pnas.0500466102. [DOI] [PMC free article] [PubMed] [Google Scholar]
- Parr BA, Shea MJ, Vassileva G, McMahon AP. Mouse Wnt genes exhibit discrete domains of expression in the early embryonic CNS and limb buds. Development. 1993;119:247–261. doi: 10.1242/dev.119.1.247. [DOI] [PubMed] [Google Scholar]
- Popken GJ, Deche-Zeger M, Ye P, D'Ercole AJ. Brain development. Adv Exp Med Biol. 2005;567:187–220. doi: 10.1007/0-387-26274-1_8. [DOI] [PubMed] [Google Scholar]
- Popken GJ, Hodge RD, Ye P, Zhang J, Ng W, O'Kusky JR, D'Ercole AJ. In vivo effects of insulin-like growth factor-I (IGF-I) on prenatal and early postnatal development of the central nervous system. Eur J Neurosci. 2004;19:2056–2068. doi: 10.1111/j.0953-816X.2004.03320.x. [DOI] [PubMed] [Google Scholar]
- Richards RG, Klotz DM, Bush MR, Walmer DK, DiAugustine RP. E2-induced degradation of uterine insulin receptor substrate-2: requirement for an IGF-I-stimulated, proteasome-dependent pathway. Endocrinology. 2001;142:3842–3849. doi: 10.1210/endo.142.9.8370. [DOI] [PubMed] [Google Scholar]
- Roelink H, Nusse R. Expression of two members of the Wnt family during mouse development–restricted temporal and spatial patterns in the developing neural tube. Genes Dev. 1991;5:381–388. doi: 10.1101/gad.5.3.381. [DOI] [PubMed] [Google Scholar]
- Salic A, Lee E, Mayer L, Kirschner MW. Control of beta-catenin stability: reconstitution of the cytoplasmic steps of the wnt pathway in Xenopus egg extracts. Mol Cell. 2000;5:523–532. doi: 10.1016/s1097-2765(00)80446-3. [DOI] [PubMed] [Google Scholar]
- Schambra UJ, Lauder JM, Silver J. San Diego, New York, Boston, London, Sydney, Tokyo and Toronto: Academic Press; 1992. Altas of the Prenatal Mouse Brain. [Google Scholar]
- Schuller U, Rowitch DH. Beta-catenin function is required for cerebellar morphogenesis. Brain Res. 2007;1140:161–169. doi: 10.1016/j.brainres.2006.05.105. [DOI] [PubMed] [Google Scholar]
- Schwarz-Romond T, Asbrand C, Bakkers J, Kuhl M, Schaeffer HJ, Huelsken J, Behrens J, Hammerschmidt M, Birchmeier W. The ankyrin repeat protein Diversin recruits casein kinase Iepsilon to the beta-catenin degradation complex and acts in both canonical Wnt and Wnt/JNK signaling. Genes Dev. 2002;16:2073–2084. doi: 10.1101/gad.230402. [DOI] [PMC free article] [PubMed] [Google Scholar]
- Sinor AD, Lillien L. Akt-1 expression level regulates CNS precursors. J Neurosci. 2004;24:8531–8541. doi: 10.1523/JNEUROSCI.1470-04.2004. [DOI] [PMC free article] [PubMed] [Google Scholar]
- Solberg N, Machon O, Krauss S. Effect of canonical Wnt inhibition in the neurogenic cortex, hippocampus, and premigratory dentate gyrus progenitor pool. Dev Dyn. 2008;237:1799–1811. doi: 10.1002/dvdy.21586. [DOI] [PubMed] [Google Scholar]
- Szabo KT. Teratogenic effect of lithium carbonate in the foetal mouse. Nature. 1970;225:73–75. doi: 10.1038/225073a0. [DOI] [PubMed] [Google Scholar]
- Wang HY, Johnson GP, Friedman E. Lithium treatment inhibits protein kinase C translocation in rat brain cortex. Psychopharmacology (Berl) 2001;158:80–86. doi: 10.1007/s002130100834. [DOI] [PubMed] [Google Scholar]
- Willing AE, Zigova T, Milliken M, Poulos S, Saporta S, McGrogan M, Snable G, Sanberg PR. Lithium exposure enhances survival of NT2N cells (hNT neurons) in the hemiparkinsonian rat. Eur J Neurosci. 2002;16:2271–2278. doi: 10.1046/j.1460-9568.2002.02300.x. [DOI] [PubMed] [Google Scholar]
- Ye P, Carson J, D'Ercole AJ. In vivo actions of insulin-like growth factor-I (IGF-I) on brain myelination: studies of IGF-I and IGF binding protein-1 (IGFBP-1) transgenic mice. J Neurosci. 1995;15:7344–7356. doi: 10.1523/JNEUROSCI.15-11-07344.1995. [DOI] [PMC free article] [PubMed] [Google Scholar]
- Ye P, Xing Y, Dai Z, D'Ercole AJ. In vivo actions of insulin-like growth factor-I (IGF-I) on cerebellum development in transgenic mice: evidence that IGF-I increases proliferation of granule cell progenitors. Dev Brain Res. 1996;95:44–54. doi: 10.1016/0165-3806(96)00492-0. [DOI] [PubMed] [Google Scholar]
- Ye P, Li L, Richards RG, DiAugustine RP, D'Ercole AJ. Myelination is altered in insulin-like growth factor-I null mutant mice. J Neurosci. 2002;22:6041–6051. doi: 10.1523/JNEUROSCI.22-14-06041.2002. [DOI] [PMC free article] [PubMed] [Google Scholar]
- Ye P, Hu Q, Liu H, Yan Y, D'Ercole AJ. beta-catenin mediates insulin-like growth factor-I actions to promote cyclin D1 mRNA expression, cell proliferation and survival in oligodendroglial cultures. Glia. 2010;58:1031–1041. doi: 10.1002/glia.20984. [DOI] [PMC free article] [PubMed] [Google Scholar]
- Zeger M, Popken G, Zhang J, Xuan S, Lu QR, Schwab MH, Nave KA, Rowitch D, D'Ercole AJ, Ye P. Insulin-like growth factor type 1 receptor signaling in the cells of oligodendrocyte lineage is required for normal in vivo oligodendrocyte development and myelination. Glia. 2007;55:400–411. doi: 10.1002/glia.20469. [DOI] [PMC free article] [PubMed] [Google Scholar]


