

Abstract
Objectives
Responsiveness has been identified as one of the intrinsic goals of health care systems. Little is known, however, about its determinants. Our objective is to investigate the potential country-level drivers of health system responsiveness.
Data Source
Data on responsiveness are taken from the World Health Survey. Information on country-level characteristics is obtained from a variety of sources including the United Nations Development Program (UNDP).
Study Design
A two-step procedure. First, using survey data we derive a country-level measure of system responsiveness purged of differences in individual reporting behavior. Secondly, we run cross-sectional country-level regressions of responsiveness on potential drivers.
Principal Findings
Health care expenditures per capita are positively associated with responsiveness, after controlling for the influence of potential confounding factors. Aspects of responsiveness are also associated with public sector spending (negatively) and educational development (positively).
Conclusions
From a policy perspective, improvements in responsiveness may require higher spending levels. The expansion of nonpublic sector provision, perhaps in the form of increased patient choice, may also serve to improve responsiveness. However, these inferences are tentative and require further study.
Keywords: Health system performance, responsiveness, cross-country comparison, health care spending per capita, vignettes
Health system responsiveness has been identified as one of the intrinsic goals of health care systems, alongside health outcomes and fairness of financial contributions (World Health Organization 2000). Responsiveness relates to a system's ability to respond to the legitimate expectations of potential users about nonhealth enhancing aspects of care (Murray and Frenk 2000) and in broad terms can be defined as the way in which individuals are treated and the environment in which they are treated, encompassing the notion of an individual's experience of contact with the health system (Valentine et al. 2003a). The World Health Organization (Valentine et al. 2003a) has operationalized the concept through measurement across eight domains that aim to distinguish between aspects of health systems related to the rights of patients as human beings (e.g., domain of dignity) and aspects related to how the system meets the needs of patients as clients of the system (e.g., quality of health care facilities).
While there exists evidence on variation in reported levels of health system responsiveness across countries (Valentine et al. 2003b, 2009; Sirven, Santos-Eggimann, and Spagnoli 2008; Rice, Robone, and Smith 2011), there has been little investigation of the determinants of responsiveness, particularly of system-wide determinants (World Health Organization 2000). In the few studies that do exist, attention has focused on an apparent positive association between health care spending per capita and responsiveness (World Health Organization 2000; Anderson and Hussey 2001). However, such bivariate association may be misleading, and it has been argued that responsiveness is not just a matter of health spending (World Health Organization 2000). Characteristics such as institutional factors have also been suggested as important determinants of whether a country's health system meets its citizens' expectations (Blendon, Kim, and Benson 2001; Azfar and Gurgur 2008). Furthermore, there are likely to be a range of influences on the health system beyond the immediate control of health policy makers that should also in principle be modelled. These observations appear to be corroborated by empirical evidence showing that a positive and significant relationship between health care spending and responsiveness exists only for specific groups of countries and specific types of treatments (Valentine et al. 2003b, 2009).
This paper investigates the influence of aggregate country-level characteristics on health system responsiveness, using data on 66 countries present in the World Health Survey (WHS). Potential determinants considered include the characteristics of health systems, the structure of the population served, and the economic, cultural, and institutional characteristics of countries. We pay particular attention to the role of health care expenditures per capita while controlling for potential confounding factors.
Data on responsiveness in the WHS are self-reported and measured on an ordinal categorical scale. A common problem with such scales is that individuals when faced with the instrument are likely to interpret the meaning of the available response categories in a way that systematically differs across populations or population subgroups (Salomon et al. 2004). This compromises the comparability of data, particularly for cross-country analyses and has been termed “differential item functioning” (Holland and Wainer 1993). To address this issue, our empirical approach adopts a two-step procedure. First, we adjust for differential item functioning by making use of information on the set of anchoring vignettes available in the WHS and by applying the hierarchical ordered probit (hopit) model (King et al. 2004). Secondly, from the application of the above model, country-level estimates of responsiveness are obtained (purged of differential reporting behavior), which are then regressed on health spending per capita and other country characteristics.
HEALTH SYSTEM RESPONSIVENESS AND ITS POTENTIAL DETERMINANTS
Although the concept is still at an early stage of development, responsiveness embraces aspects of respect of human rights, such as respecting patient autonomy and dignity, as well as interpersonal aspects of care, such as the quality of basic amenities. Increasingly, patients' views and opinions are being recognized as an appropriate source of information on such nontechnical aspects of health care delivery, and the measurement of health system responsiveness has largely been based on surveys of user views where respondents are asked to rate their most recent (in the previous year) experience of contact with health services.
We seek to examine plausible system-wide influences on responsiveness. There currently exists no single generally accepted theoretical framework with which to directly guide our analysis. Accordingly, we present a tentative framework that builds on existing literature, most notably that of Valentine et al. (2009), which situates responsiveness within broader frameworks on, for example, the medical care process (Donabedian 1973), access to care (Aday and Andersen 1974), and utilization of care (e.g., Andersen 1995). The framework links responsiveness to health care access via the impact of quality of care (described through the domains of responsiveness) on utilization choices and patterns.
The framework of Valentine et al. (2009) has three broad components: the environment; agents defining need for care; and the process of care and subsequent outcomes. The first component defines the context of service provision through the characteristics of welfare provision, the structure of the health system, and available resources. The second component delineates the role of users and providers in defining the need for care and setting the context for care—for example, through diagnostic processes, decision making, social norms, and expectations and patient involvement in decision for care. The final component, which is concerned with the process of seeking and receiving care at the micro (individual) level, refers to the process of care and outcomes experienced when an individual moves through the stages of recognizing a health need, deciding to seek care, interacting with the system, and the coverage of care received. Responsiveness is viewed as a legitimate outcome of the care process.
The first two components of the framework offer a useful perspective in analyzing the influence of aggregate country-level characteristics on responsiveness. The components draw heavily on the work of Aday and Andersen (1974) in constructing a theoretical framework for the study of medical care access. The framework of Aday and Andersen (1974) begins by considering health policy objectives in their broad sense as expressed by the goals of planners, policy makers, and governments. It then proceeds through the characteristics of the health care system which is influenced by available resources (labor and capital devoted to health care) and how these resources are used (also see Andersen, Smedby, and Anderson 1970). The framework then considers the characteristics of the population at risk encompassing health care needs, the propensity of individuals to use services, and the means individuals have to access services (Andersen and Newman 1973). The final stage considers the outcomes of the care process, via utilization of services (type, location, and purpose of service) and patient satisfaction (attitudes towards the medical care system of those who have experienced contact).
We propose a conceptual framework for responsiveness, presented in Figure 1, that builds on the frameworks of Valentine et al. (2009) and Aday and Andersen (1974) but deviates in that we focus only on influences operating at the macro (country) level. The model has four broad components: (1) environment; (2) characteristics of the population; (3) access/health service utilization; and (4) responsiveness.1 Environmental characteristics can be stratified in three broad groups: (i) resources, (ii) health system characteristics, and (iii) institutional factors and correspond to the role that health policy plays in setting the context for health care organization and delivery. We use this framework to inform our choice of wide characteristics as potential correlates of responsiveness.
Figure 1.
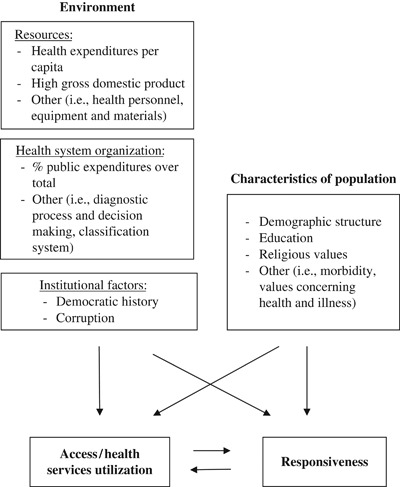
Conceptual Framework for Responsiveness
Within environmental resources we pay particular attention to the role of health expenditures per capita. This has been widely used as a determinant of health systems' performance and has been shown to have a positive relationship with responsiveness (World Health Organization 2000; Anderson and Hussey 2001) and is determined by the organizational and political processes within countries. However, responsiveness may not simply be a matter of the level of health spending: while some elements of responsiveness are likely to be costly (e.g., quality of facilities), other elements are not (e.g., dignity and communication) and may simply require a moderately increased level of training and awareness (World Health Organization 2000; Blendon, Kim, and Benson 2001). Moreover, as indicated by Azfar and Gurgur (2008), an increase in funding for the health sector does not necessarily lead to the provision of better services where institutions fail to function efficiently. It has been suggested that health care spending might have a differential impact on responsiveness across countries, for example, it may be greater in more economically developed countries due to an increased availability of human capital and better developed infrastructure (Valentine et al. 2003b, 2009). Other environmental resources that have been suggested in frameworks on access refer to labor and capital devoted to health care (Aday and Andersen 1974), including, for example, health personnel and equipment and materials utilized in providing health care. However, detailed information on such characteristics is difficult to locate across multiple countries.
The organization of health care refers to the way a system chooses to use its resources. Here we consider the proportion of total health care expenditure consumed by the public sector provision of care. Previous studies have attempted to explain variation across countries in the share of publicly provided health care (Epple and Romano 1996; Gouveia 1997), its redistributive impact (Besley and Coate 1991; Castro-Leal et al. 2000; Sahn and Younger 2000; O'Donnell et al. 2007), and the relative efficiency of public versus private provision (Besley and Gouveia 1994; Hanson et al. 2008). Patouillard et al. (2007), Bennett et al. (2005), Brugha and Zwi (1998), and Angelopoulou, Kangis, and Babis (1998) have suggested that publicly funded health care is characterized by higher technical quality than privately funded provision. As far as responsiveness is concerned, it has been hypothesized that the quality of health services is contingent on market incentives. Because private providers are not usually subsidized by governments and depend on payments from clients, they will be more likely than public providers to meet patients' expectations about nontechnical aspects of care (Andaleeb 2000). This hypothesis appears to be supported by empirical evidence (Angelopoulou, Kangis, and Babis 1998; Andaleeb 2000).
The final component of environmental characteristics is institutional factors. Among characteristics that are plausibly linked to responsiveness we consider the political history of a country. Past political control will have important consequences for the way in which the health care sector is organized; for example, a past soviet system is likely to retain remnants of a highly centralized and planned public sector. Recent studies have shown that a stable democratic political system favors economic development (Gerring et al. 2005; Persson and Tabellini 2009), and we hypothesize that countries with a long history of democracy are associated with higher levels of health systems' responsiveness compared to those where democratic political processes have more recently been introduced. In addition, institutional factors such as the levels of corruption might also impact on access, quality of care, and the responsiveness of the system to user preferences. The influence of corruption on public service provision has been extensively debated. The majority of studies argue that corruption represents “sand in the wheel of growth” and reduces economic efficiency and the provision of public goods and services (Mauro 1995). This appears to be corroborated in empirical studies showing that corruption adversely affects the quality of public services (Bearse, Glomm, and Janeba 2000), decreases their volume (Azfar and Gurgur 2008), and reduces spending in operation and maintenance (Tanzi and Davoodi 1998).
Aday and Andersen (1974) describe the characteristics of the population at risk that influence access as representing the predisposing, enabling, and health care needs components of individuals. We proxy these by using the population demographic structure and educational attainment. Demographic structure is generally considered a useful indicator of health care needs of a population and forms an important component of needs weighted capitation formulae used to distribute health care resources (Rice and Smith 2001; Smith, Rice, and Carr-Hill 2001; Gravelle et al. 2003). It is likely that higher educated citizens will demand more from health services including the way it responds to legitimate expectations of quality. In addition, education levels were found to be the major exogenous influence on health system efficiency in the World Health Report 2000 (World Health Organization 2000), and accordingly we include an indicator of average schooling levels. It has been hypothesized that religion and values concerning health and illness might influence aspects of consumer satisfaction such as courtesy shown by health care providers, information provided to patients, and quality of care in general (Aday and Andersen 1974). We proxy these through the use of a broad measure of a country's religious values derived via the World Values Survey (Inglehart and Welzel 2005).
DATA
We make use of data from the WHS. The WHS is an initiative launched by the World Health Organization aimed at strengthening capacity to monitor health outputs and outcomes across countries through the fielding of a comparable household survey instrument (see Üstün, Mechbal, and Murray 2003). Seventy countries participated in the WHS 2002–2003, and all of them, with the exception of Turkey, reported data on responsiveness. All surveys were drawn from nationally representative frames with known probability resulting in sample sizes of between 600 and 10,000 respondents across the countries surveyed.
To measure responsiveness, respondents were asked to rate their most recent experience of contact with the health system within a set of eight domains. These consist of “autonomy” (involved in decisions), “choice” (of health care provider), “clarity of communication” (of health care personnel), “confidentiality” (e.g., talk privately), “dignity” (respectful treatment and communication), “prompt attention” (e.g., waiting times), “quality of basic facilities,” and “access to family and community support.” We make use of data on inpatient services across six of the domains.2 The following five categories were available to respondents: “very good,” “good,” “moderate,” “bad,” and “very bad.” Example definitions of domains and the questions asked to survey respondents are presented in Figure 2. More detailed descriptions can be found in Valentine et al. (2003a). In addition to respondents' ratings of own contact with health services, the WHS contains a number of anchoring vignettes describing the experiences of hypothetical individuals within each of the domains. Respondents are asked to rate these vignettes using the same scale available when reporting their own experiences of health system responsiveness. Examples vignettes are also presented in Figure 2. Information from the vignettes is used to anchor respondent reports to a common scale to allow comparison across countries.
Figure 2.
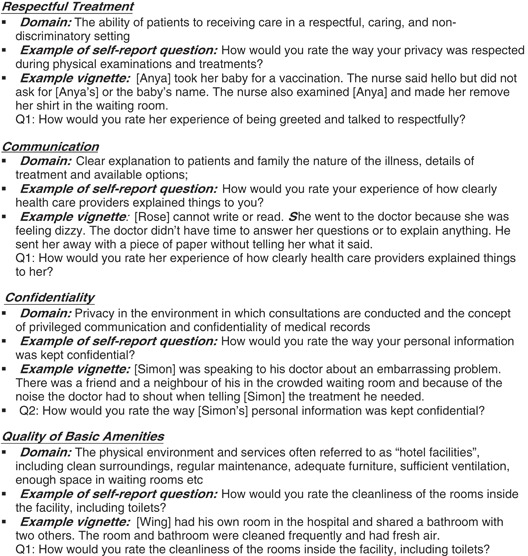
Examples of Domains of Responsiveness, Self-Report Questions, and Vignette Questions Used in the World Health Survey
Note that the above provide examples only and not an exhaustive list of possible vignettes for each domain. The response categories available to respondents were “very good,” “good,” “moderate,” “bad,” and “very bad.”
We further make use of the following respondent characteristics: age, gender, years of education, and income. The latter is derived from a measure of financial endowments based on information on the physical assets owned by households, described by Ferguson et al. (2003). We construct discrete variables to indicate the tertiles of the within-country distribution of household permanent income to which individuals belong.
Cross-country data on health expenditures per capita, health care expenditures in the public sector, the demographic structure, and aggregate level of education in a country (provided on a scale from 0 to 1) relate to 2001 and were obtained from the United Nations Development Program (UNDP 2006). The degree of economic development follows the World Bank categorization of countries as high-, upper-middle-, lower-middle-, and low income.
To proxy religious values and beliefs prevailing in a country, we make reference to the World Value Survey (Inglehart and Welzel 2005), which identifies a set of basic values common across countries. We focus on the Traditional/Secular dimension of cross-cultural variation, which reflects the contrast between societies in which religion is considered as an important element of life and those in which it is not.
Information on control of corruption is provided by the The Worldwide Governance Indicators project database, which reports aggregate and individual governance indicators for 213 economies.3 Control of corruption represents the perceptions of the extent to which public power is exercized for private gain, including both petty and grand forms of corruption, as well as “capture” of the state by elites and private interests (Kaufmann, Kraay, and Mastruzzi 2010). The measure relates to 2000, ranging from −2.5 (lowest level of control) to 2.5 (highest level of control). Information on a country's democratic history is provided by the Polity IV Project database.4 The Polity Score represents the level of democracy on a spectrum from 0 to 10 with 10 representing a fully democratic political system. Our index represents the average score over the past 35 years for each country.
Descriptive statistics for the set of country level explanatory variables are presented in Table 1. Average health expenditures per capita is approximately 560 U.S.$. There is, however, substantial variation across countries with a range of 3 to 2,580 U.S.$.
Table 1.
Descriptive Statistics on the Country Variable Potentially Influencing Health System Responsiveness
| No of Observations | Mean | Standard Deviation | Minimum | Maximum | |
|---|---|---|---|---|---|
| Health exp. per capita | 66 | 0.561 | 0.821 | 0.003 | 2.852 |
| % Public exp. over total | 66 | 0.531 | 0.212 | 6 | 90 |
| % Population over 65 | 67 | 8.827 | 5.831 | 1.1 | 19.7 |
| Education index | 67 | 0.783 | 0.208 | 0.23 | 0.99 |
| Upper-middle income | 67 | 0.164 | 0.373 | 0 | 1 |
| Lower-middle income | 67 | 0.254 | 0.438 | 0 | 1 |
| Low income | 67 | 0.224 | 0.420 | 0 | 1 |
| Traditional values | 67 | 0.567 | 0.499 | 0 | 1 |
| Control of corruption | 67 | 0.159 | 1.031 | −1.45 | 2.37 |
| Democratic history | 67 | 0.494 | 0.357 | 0 | 1 |
Note. Health expenditure per capita are expressed in 1,000 U.S.$, the percentage of public expenditures over the total health expenditures and the percentage of population over 65 are expressed as percentages and lie in the range 0–100. Control of corruption lies in the range −2.5 to 2.5 and the remaining variables lie in the range 0–1. Democratic history has been rescaled from 0–10 to 0–1.
EMPIRICAL APPROACH
Self-reported data on responsiveness are likely to be contaminated by differential item functioning discussed above, in the sense that individuals in different countries may report a fixed level of responsiveness differently due to social norms and expectations (Salomon et al. 2004). We therefore use the set of anchoring vignettes available in the WHS to benchmark the self-reported data to a scale common across populations using the hopit model (King et al. 2004). The approach allows us to enhance the cross-country comparability of the responsiveness self-reports by purging the data of individual differential item reporting before exploring potential country level drivers. Accordingly, we adopt a two-step procedure: first, we model individual-level data on responsiveness as a function of individual characteristics and country effects to derive an estimate of country-level responsiveness while controlling for differential item functioning using the hopit model; secondly, we investigate the influence of health spending per capita and other country characteristics on the adjusted country-level measures of responsiveness.
Hopit Model
Responsiveness can be viewed as a multidimensional concept, with each domain measured as a categorical variable, for which there is an assumed underlying latent scale. We model the categorical responses using an extension to an ordered probit model that allows the cut point thresholds, used to map responses on the latent scale to observed outcomes, to vary across individuals as functions of selected respondent characteristics. This is achieved using the hopit model (King et al. 2004). There are two components to the model. The first component draws on the use of anchoring vignettes to provide a source of information that enables the thresholds to be modelled as functions of relevant respondent covariates (reporting behavior equation). We use individual sociodemographic characteristics and the country of residence as determinants of reporting behavior. The second component of the model (responsiveness equation) regresses responsiveness on individual socioeconomic and demographic characteristics (age, gender, level of education, and income) and the country of residence while controlling for differences in reporting behavior by fixing the cut-point thresholds to those obtained through the reporting behavior equation. This allows us to estimate country-level responsiveness (identified as the coefficients on the set of country dummy variables) that is purged of differences in individual reporting behavior and that subsequently can be used to model potential country-level determinants. Full details of the hopit model and its application can be found, for example, in King et al. (2004), Kapteyn, Smith, and van Soest (2007), Bago d'Uva et al. (2008), and Rice, Robone, and Smith (2011). We apply this approach on data pooled across 67 countries present in the WHS.5
Estimation of the Characteristics of Responsiveness
To investigate country-specific determinants of responsiveness, we use an estimated dependent variable model (Lewis and Linzer 2005) and regress the coefficients of the country dummy variables derived from the application of the hopit model on country-level characteristics. These coefficients contain information on the relative levels of responsiveness present across countries. For example, should country A have a greater (positive) coefficient than country B, we can assume that the health care system in country A is more responsive than that in country B all other things being equal. Accordingly we can exploit the variability in the coefficients of the country dummies in order to investigate the influence of country characteristic.
The model is estimated on a pool of 66 countries.6 Throughout we apply Huber–White robust standard errors (White 1980) as the use of the estimated dependent variable model may induce heteroskedasticity from sampling variation in the estimated levels of country-specific responsiveness (Lewis and Linzer 2005). To investigate heterogeneity in the impact of regressors on responsiveness across different groups of countries, we stratify the countries on the basis of their gross national income according to the World Bank classification.7 We collapse “high-income” and “upper-middle-income” countries into a single group labeled “high income” and “lower-middle income” and “low income” into a group labeled “low income.”8 We estimate the model separately on the two subsamples. Grouping countries in this way may be informative about the impact on responsiveness of key country-level characteristics that would otherwise be lost in the pooled analysis. It may also aid analysis and interpretation of the results by facilitating comparison across countries that are more similar in their stage of social and economic development (e.g., see Hollingsworth and Wildman 2003).
RESULTS
All Countries
To conserve space we do not report the results of the application of the hopit model to purge responsiveness of differential item functioning, but these results are available on request. The reporting behavior equations show significant effects for the characteristics of individuals and for country-level effects. Furthermore, a joint test of significance of the country-level coefficients rejects the null hypothesis of homogeneity in reporting for all domains and cut-points. These results provide evidence of differential item functioning both within and across countries. Conditional on reporting behavior, country-level effects in the outcome (responsiveness) equation are also significant at the 5 percent level in the majority of domains. This shows significant difference in levels of responsiveness across countries even after purging data of differences in reporting styles. These country effects are used as the regressand in the second step of the estimation procedure.
Table 2 reports the estimates obtained from regressing the coefficients of the country effects obtained using the hopit model on the country-wide determinants of responsiveness. The R2 statistics for the regressions in the domains Dignity, Clarity of Communication, Confidentiality, and Quality of Facilities (between 54 percent and 63 percent) are greater than those for Prompt Attention (29 percent) and Choice (26 percent). Results of a link test suggest that the functional form of the models have reasonable specification.
Table 2.
OLS Estimates of the Influence of All Country-Specific Variables on Health System Responsiveness
| b/SE | ||||||
|---|---|---|---|---|---|---|
| Dignity | Prompt Attention | Clarity of Communication | Confidentiality | Quality of Facilities | Choice | |
| Health exp. per capita | 0.163* | 0.082 | 0.152* | 0.134* | 0.296** | 0.308 |
| 0.08 | 0.074 | 0.073 | 0.064 | 0.104 | 0.158 | |
| % Public exp. over total | −0.374 | −0.516* | −0.559** | −0.485* | −0.714* | −0.616 |
| 0.197 | 0.25 | 0.191 | 0.2 | 0.328 | 0.406 | |
| % Public exp. over 65 | −0.007 | −0.008 | −0.001 | −0.011 | −0.015 | 0.01 |
| 0.012 | 0.011 | 0.011 | 0.008 | 0.014 | 0.017 | |
| Education index | 0.566* | 0.750* | 0.805** | 0.649** | 1.093* | 0.177 |
| 0.241 | 0.303 | 0.286 | 0.208 | 0.436 | 0.396 | |
| Upper-middle income | −0.059 | −0.071 | −0.088 | −0.208 | −0.176 | −0.385 |
| 0.096 | 0.141 | 0.106 | 0.125 | 0.19 | 0.237 | |
| Lower-middle income | −0.106 | −0.145 | −0.303* | −0.338* | −0.293 | −0.464 |
| 0.137 | 0.16 | 0.121 | 0.156 | 0.212 | 0.243 | |
| Low income | −0.052 | −0.098 | −0.258 | −0.228 | −0.253 | −0.784** |
| 0.136 | 0.181 | 0.135 | 0.173 | 0.249 | 0.285 | |
| Traditional values | 0.072 | 0.005 | 0.11 | 0.079 | 0.124 | 0.281 |
| 0.11 | 0.116 | 0.105 | 0.087 | 0.12 | 0.14 | |
| Control of corruption | 0.056 | −0.048 | −0.027 | −0.011 | 0.023 | −0.212 |
| 0.083 | 0.079 | 0.083 | 0.068 | 0.093 | 0.113 | |
| Democratic history | 0.015 | −0.08 | −0.033 | 0.007 | −0.157 | −0.466 |
| 0.109 | 0.139 | 0.109 | 0.113 | 0.163 | 0.308 | |
| Constant | −0.289 | −0.267 | −0.631* | −0.315 | −0.671 | 0.055 |
| 0.263 | 0.325 | 0.259 | 0.262 | 0.421 | 0.475 | |
| R2 | 0.536 | 0.288 | 0.628 | 0.538 | 0.575 | 0.259 |
| N | 66 | 66 | 66 | 66 | 66 | 66 |
| Link test | ||||||
| Hat | 0.000 | 0.001 | 0.001 | 0.029 | 0.000 | 0.699 |
| Hat^2 | 0.678 | 0.422 | 0.844 | 0.109 | 0.47 | 0.165 |
Notes. Robust standard errors.
p<.01,
p<.05.
The results show that health care expenditure per capita has a positive association with responsiveness across all domains and is significant with the exception of Prompt Attention and Choice. Of other plausible determinants of responsiveness, the proportion of health care expenditure in the public sector and population levels of education appear most relevant where coefficients are statistically significant across all domains except Choice for the latter and Choice and Dignity for the former. The percentage of health care expenditure in the public sector has a negative association in all domains. This result tends to confirm previous literature suggesting that public sector services are less likely to respond to the preferences of users compared with private sector provision (Angelopoulou, Kangis, and Babis 1998; Andaleeb 2000). As expected, population levels of education are positively related to responsiveness. Effects for upper-middle-, lower-middle, and low income are negatively related to the domains of responsiveness but only three of the effects attain statistical significance. The percentage of the population older than 65, control of corruption, and democratic history appear mostly negatively associated with responsiveness, while traditional religious values have a positive association. The coefficients of these regressors, however, are not statistically significant.
Subgroup Results
Table 3 reports, for each domain, results for the estimated coefficients and standard errors for models estimated separately for “high-income” and “low-income” countries, stratified according to the World Bank classification. In estimating these models we are reliant on small samples (35 and 31, respectively), reducing the degrees of freedom available for analysis and compromising the precision of estimated relationships. Therefore, in order to draw more meaningful inference from the results, we consider the characteristics that appear to be the most important from the main set of results. Within both “high-income” and “low-income” countries health care expenditure per capita continues to be positively associated with responsiveness and is statistically significant in more than half of the models. The magnitude of the coefficients is noticeably larger for the “low-income” countries than for “high-income” countries. This result suggests that health expenditure per capita may be more influential for driving improvements in responsiveness in low-income settings. While again, we observe a negative relationship with the percentage of health care consumed in the public sector across all domains, there does not appear to be meaningful differences in its effect across the two sets of countries. For “low-income” countries education is positively associated with responsiveness in all domains and statistically significant in four of the six domains. However, conditional on other effects, education appears to be negatively related to responsiveness in “high-income” countries.
Table 3.
OLS Estimates of the Influence of Country-Specific Variables on Health System Responsiveness, for Countries Stratified in “High Income” (High and Upper-Middle Income World Bank Groups) and “Low Income” (Lower-Middle and Low Income World Bank Groups)
| b/SE | ||||||||||||
|---|---|---|---|---|---|---|---|---|---|---|---|---|
| Dignity High Income | Dignity Low Income | Prompt Attention High Income | Prompt Attention Low Income | Clarity of Communication High Income | Clarity of Communication Low Income | Confidentiality High Income | Confidentiality Low Income | Quality of Facilities High Income | Quality of Facilities Low Income | Choice High Income | Choice Low Income | |
| Health exp. per capita | 0.215*** | 3.064 | 0.067 | 0.190 | 0.135** | 3.864* | 0.164*** | 5.339*** | 0.325*** | 5.505* | 0.080 | 2.389 |
| 0.056 | 1.608 | 0.044 | 2.006 | 0.047 | 1.660 | 0.037 | 1.433 | 0.070 | 2.267 | 0.114 | 2.792 | |
| % Public exp. over total | −0.122 | −0.676* | −0.587 | −0.645 | −0.788* | −0.703* | −0.784** | −0.731** | −1.234* | −0.758* | −0.641 | −1.049* |
| 0.382 | 0.269 | 0.302 | 0.336 | 0.320 | 0.278 | 0.257 | 0.240 | 0.481 | 0.379 | 0.784 | 0.467 | |
| Education index | −0.248 | 0.344 | −1.093* | 0.894** | 0.272 | 0.613** | −1.274** | 0.448* | −1.190 | 0.733* | −1.167 | 0.300 |
| 0.675 | 0.209 | 0.534 | 0.260 | 0.565 | 0.215 | 0.454 | 0.186 | 0.851 | 0.294 | 1.385 | 0.362 | |
| Bottom income group | 0.020 | 0.152 | −0.116 | 0.128 | −0.093 | 0.171 | −0.274** | 0.294** | −0.269 | 0.219 | −0.276 | −0.050 |
| 0.147 | 0.091 | 0.117 | 0.114 | 0.123 | 0.094 | 0.099 | 0.081 | 0.185 | 0.129 | 0.302 | 0.158 | |
| Constant | 0.212 | −0.280 | 1.317* | −0.519* | 0.004 | −0.838*** | 1.539** | −0.655*** | 1.541 | −0.988*** | 1.208 | −0.221 |
| 0.735 | 0.166 | 0.582 | 0.207 | 0.615 | 0.171 | 0.494 | 0.148 | 0.926 | 0.234 | 1.508 | 0.288 | |
| R2 | 0.417 | 0.340 | 0.208 | 0.404 | 0.357 | 0.490 | 0.535 | 0.543 | 0.502 | 0.447 | 0.054 | 0.301 |
| N | 35 | 31 | 35 | 31 | 35 | 31 | 35 | 31 | 35 | 31 | 35 | 31 |
Notes. Robust standard errors; “bottom income group” has been defined relative to the set of countries analyzed.
p<.001,
p<.01,
p<.05.
CONCLUSIONS
This paper has investigated the potential influence of aggregate country-level characteristics on health system responsiveness, using data on 66 countries present in the WHS. This extensive dataset represents a major advance on those available to previous studies. Furthermore, taking advantage of the anchoring vignettes used in the study, we were able to adjust the dependent variables for systematic differential item functioning (reporting bias) across countries using the hierarchical ordered probit model.
We have proposed an analytic framework that posited four classes of system-wide determinants of responsiveness: resources, health system organization, institutional factors, and population characteristics. As expected, health expenditure per capita has a positive association with responsiveness across all domains, and its effect is statistically significant for the majority. This indicates that, at least to some extent, extra resources, perhaps in the form of increased personnel or training, may be needed to enhance health system responsiveness. Future work may seek to identify in more detail the way in which extra spending might lead to such improvements. We also find that the proportion of health care expenditure devoted to the public sector has a negative association with responsiveness. This suggests that market incentives may have a part to play in promoting responsiveness, although their role in promoting clinical quality remains contested (Angelopoulou, Kangis, and Babis 1998; Brugha and Zwi 1998; Bennett et al. 2005; Patouillard et al. 2007). Among exogenous influences, population levels of education has a positive association with several aspects of responsiveness, suggesting that a more educated population may be more successful at stimulating improvements and holding providers to account.
These results were largely confirmed when we stratified countries according to the World Bank income groups. However, although such stratification allows comparison across more homogenous groups of countries, this is at the cost of relying on small sample sizes, and the results are somewhat less conclusive. The magnitude of the coefficients of health expenditure per capita is noticeably larger for the “low-income” countries than for “high-income” countries. This suggests that health expenditure per capita may be more influential for driving improvements in responsiveness in low-income settings.
We are cautious in drawing strong inferences about causality from this study. However, the results are plausible and suggest three potential classes of influence on responsiveness: overall spending levels (positively), public sector spending (negatively), and educational development (positively). The first two factors are potential policy levers, while the third is an exogenous factor beyond the immediate control of health policy makers. We therefore cautiously suggest that policy makers seeking to enhance responsiveness levels may require higher spending levels. They might also consider sharpening some elements of choice and competition within their systems, possibly by expanding nonpublic sector provision. However, such experiments should be implemented and evaluated carefully. Our findings are tentative, and there are likely to be numerous other consequences of such reforms beyond their immediate impact on responsiveness.
Acknowledgments
Joint Acknowledgment/Disclosure Statement: This research was funded by the Economic and Social Research Council under the Public Services Program (RES-166-25-0038) and the Large Grant Scheme (RES-060-25-0045). We would like to thank the World Health Organization for providing access to the WHS and, in particular, Somnath Chatterji, Amit Prasad, Nicole Valentine, and Emese Verdes. We are grateful to two anonymous referees for useful comments on an earlier draft.
Disclosures: None.
Disclaimers: None.
NOTES
We do not elaborate on issues of access as this is a microlevel determinant.
Results for Autonomy and Social Support are not presented due to convergence problems in the hopit model.
Available at http://info.worldbank.org/governance/wgi/index.asp
Available at http://www.systemicpeace.org/polity/polity4.htm
We exclude Australia and Norway as data on key domains are not available.
United Arab Emirates is excluded due to missing data on key variables.
A finer disaggregation is not possible due to small numbers of countries in each classification.
SUPPORTING INFORMATION
Additional supporting information may be found in the online version of this article:
Appendix SA1: Author Matrix.
Please note: Wiley-Blackwell is not responsible for the content or functionality of any supporting materials supplied by the authors. Any queries (other than missing material) should be directed to the corresponding author for the article.
REFERENCES
- Aday A, Andersen RM. “A Framework for the Study of Access to Medical Care. Health Services Research. 1974;Fall:208–20. [PMC free article] [PubMed] [Google Scholar]
- Andaleeb SS. “Public and Private Hospitals in Bangladesh: Service Quality and Predictors of Hospital Choice. Health Policy and Planning. 2000;15((1)):95–102. doi: 10.1093/heapol/15.1.95. [DOI] [PubMed] [Google Scholar]
- Andersen R. “Revisiting the Behavioural Model and Access to Medical Care: Does It Matter?”. Journal of Health and Social Behaviour. 1995;36((1)):1–10. [PubMed] [Google Scholar]
- Andersen RM, Newman JF. “Societal and Individual Determinants of Medi- cal Care Utilization in the United States. Milbank Memorial Fund Quarterly Journal. 1973;51:95–124. [PubMed] [Google Scholar]
- Andersen RM, Smedby B, Anderson OW. Chicago, IL: Center for Health Administration Studies, University of Chicago; 1970. “Medical Care Use in Sweden and the United States-A Comparative Analysis of Systems and Behavior. Research Series No. 27.”. [Google Scholar]
- Anderson G, Hussey P. “Comparing Health System Performance in OECD Counties. Health Affairs. 2001;20((3)):219–32. doi: 10.1377/hlthaff.20.3.219. [DOI] [PubMed] [Google Scholar]
- Angelopoulou P, Kangis P, Babis G. “Private and Public Medicine: A Comparison of Quality Perception. International Journal of Health Care Quality Assurance. 1998;11((1)):14–20. doi: 10.1108/09526869810199601. [DOI] [PubMed] [Google Scholar]
- Azfar O, Gurgur T. “Does Corruption Affect Health and Education Outcomes in the Philippines? Economics of Governance. 2008;9:197–244. [Google Scholar]
- Bago d'Uva T, van Doorlsaer E, Lindeboom M, O'Donnell O. “Does reporting Heterogeneity Bias the Measurement of Health Disparities? Health Economics. 2008;17((3)):351–75. doi: 10.1002/hec.1269. [DOI] [PubMed] [Google Scholar]
- Bearse P, Glomm G, Janeba E. “Why Poor Countries Rely Mostly on Redistribution in Kind. Journal of Public Economics. 2000;75:432–81. [Google Scholar]
- Bennett S, Hanson K, Kadama P, Montagu D. Working with the Non State Sector to Achieve Public Health Goals. 2005. Working Paper No 2. Geneva: World Health Organisation.
- Besley T, Coate S. “Public Provision of Private Goods and the Redistribution of Income. American Economic Review. 1991;81((4)):979–84. [Google Scholar]
- Besley T, Gouveia M. “Alternative Systems of Health Care Provision. Economic Policy. 1994;9((19)):200–58. [Google Scholar]
- Blendon RJ, Kim M, Benson JM. “The Public Versus The World Health Organization on Health System Performance. Health Affairs. 2001;20((3)):10–20. doi: 10.1377/hlthaff.20.3.10. [DOI] [PubMed] [Google Scholar]
- Brugha R, Zwi A. “Improving the Quality of Private Sector Delivery of Public Health Services: Challenges and Strategies. Health Policy Plan. 1998;13((2)):107–20. doi: 10.1093/heapol/13.2.107. [DOI] [PubMed] [Google Scholar]
- Castro-Leal F, Dayton G, Demery L, Mehra K. “Public Spending on Health Care in Africa: Do the Poor Benefit?”. Bulletin of the World Health Organisation. 2000;78((1)):66–74. [PMC free article] [PubMed] [Google Scholar]
- Donabedian A. Aspects of Medical Care Administration. Cambridge, MA: Harvard University Press; 1973. [Google Scholar]
- Epple D, Romano RE. “Public Provision of Private Goods. The Journal of Political Economy. 1996;104((1)):57–84. [Google Scholar]
- Ferguson BD, Tandon A, Gakidou E, Murray CJL. “Estimating Permanent Income Using Indicator Variables”. In: Murray CJL, Evans DB, editors. Health Systems Performance Assessment: Debates, Methods and Empiricism. Geneva: World Health Organisation; 2003. pp. 748–60. [Google Scholar]
- Gerring J, Bond PJ, Barndt WT, Moreno C. “Democracy and Economic Growth: A Historical Perspective. World Politics. 2005;57((3)):323–64. [Google Scholar]
- Gouveia M. “Majority Rule and the Public Provision of a Private Good. Public Choice. 1997;93:221–44. [Google Scholar]
- Gravelle H, Sutton M, Morris S, Windmeijerd F, Leylande A, Dibbenf C, Muirheadg M. “Modelling Supply and Demand Influences on the Use of Health Care: Implications for Deriving a Needs-Based Capitation Formula. Health Economics. 2003;12:985–1004. doi: 10.1002/hec.830. [DOI] [PubMed] [Google Scholar]
- Hanson K, Gilson L, Goodman C, Mills A, Smith R, Feachem R, Sekhri Feachem N, Perez Koehlmoos T, Kinlaw H. “Is Private Health Care the Answer to the Health Problems of the World's Poor? PLoS Medicine. 2008;5((11)):1528–32. doi: 10.1371/journal.pmed.0050233. [DOI] [PMC free article] [PubMed] [Google Scholar]
- Holland PW, Wainer H. Differential Item Functioning. Hillsdale, NJ: Laurence Erlbaum; 1993. [Google Scholar]
- Hollingsworth B, Wildman J. “The Efficiency of Health Production: Re-Estimating the WHO Panel Data Using Parametric and Non-Parametric Approaches to Provide Additional Information. Health Economics. 2003;12:493–504. doi: 10.1002/hec.751. [DOI] [PubMed] [Google Scholar]
- Inglehart R, Welzel C. Modernization, Cultural Change and Democracy. New York: Cambridge University Press; 2005. [Google Scholar]
- Kapteyn A, Smith PJ, van Soest A. “Disability and Vignettes in the US and the Netherlands. The American Economic Review. 2007;97:461–73. [Google Scholar]
- Kaufmann D, Kraay A, Mastruzzi M. The Worldwide Governance Indicators, Methodology and Analytical Issues. 2010. World Bank Policy Research Working Paper 5430.
- King G, Murray CJL, Salomon J, Tandon A. “Enhancing the Validity and Cross-Cultural Comparability of Measurement in Survey Research. American Political Science Review. 2004;98((1)):184–91. [Google Scholar]
- Lewis JB, Linzer DA. “Estimating Regression Models in Which the Dependent Variable Is Based on Estimates. Political Analysis. 2005;13:345–64. [Google Scholar]
- Mauro P. “Corruption and Growth. Quarterly Journal of Economics. 1995;10:681–712. [Google Scholar]
- Murray C, Frenk J. “A Framework for Assessing the Performance of Health Systems. Bulletin of the World Health Organization. 2000;78:717–31. [PMC free article] [PubMed] [Google Scholar]
- O'Donnell O, van Doorslaer E, Rannan-Eliya RP, Somanathan A, Adhikari SR, Harbianto D, Garg CC, Hanvoravongchai P, Huq MN, Karan A, Leung MG, Ng CW, Pande BR, Tin K, Tisayaticom K, Trisnantoro L, Zhang Y, Zhao Y. “The Incidence of Public Spending on Healthcare: Comparative Evidence from Asia. World Bank Economic Review. 2007;21((1)):93–123. [Google Scholar]
- Patouillard E, Goodman CA, Hanson KG, Mills AJ. “Can Working with the Private for-Profit Sector Improve Utilization of Quality Health Services by the Poor? A Systematic Review of the Literature. International Journal for Equity in Health. 2007;6((17)):1–11. doi: 10.1186/1475-9276-6-17. [DOI] [PMC free article] [PubMed] [Google Scholar]
- Persson T, Tabellini G. “Democratic Capital: The Nexus of Political and Economic Change. American Economic Journal, Macroeconomics. 2009;1((2)):88–126. [Google Scholar]
- Rice N, Robone S, Smith PC. “Vignettes and Health Systems in Cross-country Comparative Analyses. The Journal of the Royal Statistical Society, Series A. 2011 forthcoming. [Google Scholar]
- Rice N, Smith PC. “Capitation and Risk Adjustment in Health Care Financing: An International Progress Report. The Milbank Quarterly. 2001;79:81–113. doi: 10.1111/1468-0009.00197. [DOI] [PMC free article] [PubMed] [Google Scholar]
- Sahn DE, Younger SD. “Expenditure Incidence in Africa: Microeconomic Evidence. Fiscal Studies. 2000;21((3)):321–48. [Google Scholar]
- Salomon J, Tandon A, Murray CJL, World Health Survey Pilot Study Collaborating Group “Comparability of Self-Rated Health. Cross Sectional Multi-country Survey Using Anchoring Vignettes. 2004;328(258) doi: 10.1136/bmj.37963.691632.44. British Medical Journal, doi: 10.1136/bmj.37963.691632.44. [DOI] [PMC free article] [PubMed] [Google Scholar]
- Sirven N, Santos-Eggimann B, Spagnoli J. Comparability of Health Care – Responsiveness in Europe – Using anchoring vignettes from SHARE. 2008. IRDES Working Paper 15, 2008/09.
- Smith PC, Rice N, Carr-Hill R. “Capitation Funding in the Public Sector. Journal of the Royal Statistical Society, Series A. 2001;164((2)):217–57. [Google Scholar]
- Tanzi V, Davoodi H. 1998. “Roads to Nowhere: How Corruption in Public Investment Hurts Growth” Economic Issues 12, International Monetary Fund. [accessed January 30, 2010]. Available at http://www.imf.org/external/pubs/ft/issues12/issue12.pdf.
- UNDP. 2006. “Capacity Development Practice Note.” [accessed January 30, 2010]. Available at http://www.capacity.undp.org/index.cfm?module=Library&page=Document&DocumentID=5599.
- Üstün TB, Mechbal A, Murray CJL. “The World Health Surveys”. In: Murray CJL, Evans DB, editors. Health Systems Performance Assessment: Debates, Methods and Empiricism. Geneva: World Health Organisation; 2003. pp. 762–96. [Google Scholar]
- Valentine NB, De Silva A, Kawabata K, Darby C, Murray CJL, Evans D. “Health System Responsiveness: Concepts, Domains and Operationalization.”. In: Murray CJL, Evans DB, editors. Health Systems Performance Assessment: Debates, Methods and Empiricism. Geneva: World Health Organisation; 2003a. pp. 573–96. [Google Scholar]
- Valentine NB, Ortiz JP, Tandon A, Kawabata K, Evans DB, Murray CJL. “Patient Experiences with Health Services: Population Surveys from 16 OECD Counties.”. In: Murray CJL, Evans DB, editors. Health Systems Performance Assessment: Debates, Methods and Empiricism. Geneva: World Health Organisation; 2003b. pp. 643–52. [Google Scholar]
- Valentine NB, Prasad A, Rice N, Robone S, Chatterji S. “Health Systems Responsiveness – A Measure of the Acceptability of Health Care Processes and Systems.”. In: Smith PC, Mossialos E, Leatherman S, editors. Performance Measurement for Health System Improvement: Experiences, Challenges and Prospects. London: WHO European Regional Office; 2009. pp. 138–86. [Google Scholar]
- White H. “A Heteroscadastically-Consistent Covariance Matrix Estimator and a Direct Test for the Heteroscasticity. Econometrica. 1980;48:817–38. [Google Scholar]
- World Health Organization. The World Health Report 2000. Health Systems: Improving Performance. Geneva: World Health Organization; 2000. [Google Scholar]
Associated Data
This section collects any data citations, data availability statements, or supplementary materials included in this article.